Strathprints Institutional Repository
Endegnanew, A. G. and Uhlen, K. and Haileselassie, T. M. and
Anaya-Lara, O. (2016) Transient stability analysis in Multi-terminal VSC-HVDC
grids. In: 2016 Power Systems Computation Conference (PSCC). IEEE,
Piscataway, N.J.. ISBN 978-88-941051-2-4 ,
http://dx.doi.org/10.1109/PSCC.2016.7540857
This version is available at http://strathprints.strath.ac.uk/59899/
Strathprints is designed to allow users to access the research output of the University of Strathclyde. Unless otherwise explicitly stated on the manuscript, Copyright © and Moral Rights for the papers on this site are retained by the individual authors and/or other copyright owners. Please check the manuscript for details of any other licences that may have been applied. You may not engage in further distribution of the material for any profitmaking activities or any commercial gain. You may freely distribute both the url (http://strathprints.strath.ac.uk/) and the content of this paper for research or private study, educational, or not-for-profit purposes without prior permission or charge.
Any correspondence concerning this service should be sent to Strathprints administrator:
Transient Stability Analysis in Multi-Terminal
VSC-HVDC Grids
A. G. Endegnanew
K. Uhlen
Dept. of Electric Power Engineering Norwegian University of Science and
Technology Trondheim, Norway
T. M. Haileselassie
Siemens- Oil & Gas Solutions Trondheim, Norway
O. Anaya-Lara
Dept. Electronic & Electrical Engineering University of Strathclyde
Glasgow. Scotland
Abstract—A novel approach to transient stability analysis in multi-terminal high voltage direct current (MTDC) grids is pre-sented in this paper. A symmetrical three-phase fault in an ac grid connected to a rectifier terminal of the MTDC grid causes the power injected into the dc grid to decrease, which in turn leads to a lower dc voltage in the MTDC grid. If dc voltage drops below a critical voltage limit before the ac fault is cleared, then the dc grid becomes unstable and its operation is disrupted. An analytical approach is proposed in this paper to calculate the critical clearing time of a fault in an ac grid behind a rectifier terminal beyond which dc voltage collapse occurs. A five-terminal MTDC grid modeled in EMTDC/PSCAD is used to validate the results obtained with the analytical method.
Index Terms--Critical clearing time, DC grid, Power System faults, MTDC, Transient stability
I. INTRODUCTION
More and more Voltage Source Converter based High Voltage Direct Current (VSC-HVDC) transmissions links are coming up in the North Sea both for connection of offshore wind farm to onshore grids [1, 2] and for subsea interconnec-tion of asynchronous power systems [3-5]. These point-to-point HVDC links will eventually be part of a larger DC grid with multiple connection points.
Considerable research has been conducted on modeling [6, 7], control [8-10] and steady-state operation [11, 12] of Multi-Terminal High Voltage DC (MTDC) grids. Transient stability studies of MTDC grids have focused on investigating convert-er control strategies that enhance the dynamic pconvert-erformance of the dc grid during an ac fault. Different control strategies for MTDC converters are presented in [13, 14], and it was shown that using a particle swarm optimization (PSO) method for controller tuning [13] and an adaptive current control limiter [14] improve the overall MTDC grid stability. Reference [15] explores a control method that limits the influence of unbal-anced ac faults on the MTDC grid by eliminating double fre-quency oscillations in the active power flow.
In an MTDC grid with connection to offshore wind farms, a fault in onshore ac grid causes reduction in power transfer capacity of the MTDC converter terminal due to the low ac voltage. This leads to active power imbalance in the dc grid and increases the dc grid voltage. Control strategies proposed to limit dc over-voltage include reduction of wind farm power production [16-18] or the physical implementation of a chop-per to dissipate the excess active power in the dc grid [19].
In multi-terminal or meshed dc networks, there will likely be converters and control systems supplied by different ven-dors and with slightly different design. To address this aspect, transmission system operators need to specify requirements for interoperability. One such requirement would concern the coordination of converter controls to ensure stable operation and protection against faults both on the ac and dc side. This paper presents a method for assessing transient stability in dc grids. A fault in an ac grid connected to a rectifier terminal of an MTDC causes reduction in power transfer capacity of the converter and therefore, reduction in power flow into the dc grid. During the transient disturbance period, the power de-manded by the inverter terminals is met by the limited power transferred into the dc grid by the rectifiers and by the energy discharged from the capacitors in the dc grid. The discharge of the capacitors leads to reduction of dc grid voltage. If the ac fault is not cleared before dc voltage drops below a critical voltage limit, then the dc grid voltage will not be able to re-cover. This will lead to dc grid instability and subsequently to the interruption of the dc grid operation. It is of interest to know how fast the converter controls must react to avoid a collapse of the dc grid. Previous transient stability studies have focused on the transient performance of converter con-trollers and their parameter settings. Furthermore, only simula-tions were used to study dc grid stability issues. In contrast, this work proposes a novel analytical method for calculating duration of an ac fault beyond which dc voltage instability occurs. A conservative approach is taken and it is assumed that when the transient disturbance occurs, all converters in a dc grid are operating in constant power control mode apart
from one converter which is operating in dc droop control mode. In reality, converter controllers will be either designed with voltage droop or there will be an emergency mode of operation acting when dc voltage is outside a certain range. In this respect, the use of constant power control in the analysis represents the worst-case scenario where dc voltage drops rapidly because no converter terminal participates in dc volt-age regulation and as such, the proposed method serves as a tool to assess how fast converter controllers need to react to a disturbance. An analytical method is proposed to calculate the critical dc voltage and critical clearing time of the fault in an ac grid behind a rectifier terminal beyond which dc voltage collapse occurs. A five-terminal MTDC grid modeled in EMTDC/PSCAD is used to validate the results obtained with the analytical method.
II. VSCOPERATION RANGE
This section discusses the safe operation range of a VSC converter in an MTDC network. Qualitative introduction is given based on inverter and rectifier mode of operation, and dc voltage and power flow control. Positive power flow is de-fined as power flow from ac grid into dc grid.
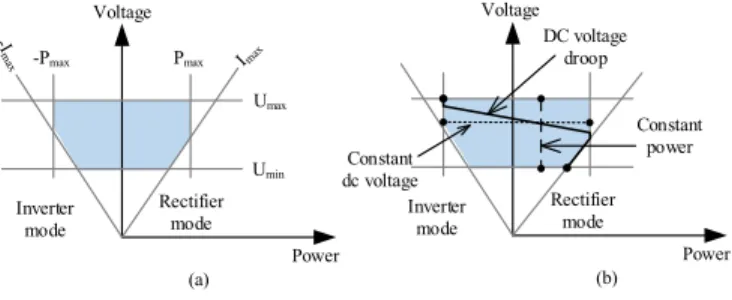
The shaded area in Fig. 1 defines the normal operating re-gion of a VSC-HVDC converter where all the operating limits are respected. The operation region is constrained by maxi-mum power capacity, maximaxi-mum dc voltage level, maximaxi-mum dc current and minimum dc voltage level. The first three con-straints are due to thermal and insulations limits, and are cru-cial for protection of the converter and dc cables from damage under high voltage and/or current levels [10, 20]. The fourth constraint (i.e. minimum dc voltage level) is inherent to the working principle of VSC and is related to modulation index, converter topology and control implementation [10, 21]. In square wave modulation, the maximum possible over-modulation puts the limit on the minimum attainable dc volt-age to 1.28VLL where VLL is the rms line-to-line voltage at the
point-of-common-coupling. Inverter mode Rectifier mode Pmax -Pmax Umax Umin Voltage Power Inverter mode Rectifier mode DC voltage droop Constant power Constant dc voltage (a) (b) Voltage Power
Fig. 1. Power vs. voltage capability diagram of a VSC-HVDC converter
The various dc voltage and power control strategies of MTDC converter terminals always lie within the boundaries of the normal operation region. Power vs. voltage characteristic lines for constant power control, dc voltage control and dc voltage droop control are shown in Fig. 1(b). Changing dc voltage and/or power references for the controllers moves the characteristic lines up or down (in cases of constant dc voltage and dc voltage droop control) or right or left (in case of con-stant power control). If for some reason, the operating point goes out of the shaded area and the controller is not able to
bring it back to the normal operating region, a separate higher-level protection system may be activated to prevent damage due to overvoltage and/or overcurrent. The details of such protection system will not be discussed here. For simplicity, it is assumed that the VSC will trip immediately when the
con-verter’s operation goes outside the designated normal
operat-ing region.
III. LARGE DISTURBANCE STABILITY IN MTDCGRID
Transient stability in ac grids refers to the ability of a pow-er system to maintain synchronism when subjected to sevpow-ere disturbances like a fault on transmission lines, loss of genera-tion or loss of a large load [22]. Similarly, in dc grids, transi-ent stability can be defined as the ability of the dc grid to maintain dc voltage level when the system is subjected to large-scale disturbances such as converter outage, dc cable outage, dc faults and faults in the ac system connected to the MTDC [7].
Large-disturbance stability in multi-terminal dc grids can be understood by looking at the interaction between all rectify-ing converter units on one side and all invertrectify-ing converter units on the other side. For illustration purposes, let us assume that the circuit in Fig. 2 represents an MTDC grid with aggre-gated rectifiers and inverters at each end. PS refers to the
ag-gregate power injected into the dc grid by the rectifiers and hence the terminal can be considered as a source converter. Likewise, PL refers to the aggregate power withdrawn from
the dc grid by the inverters and hence this terminal can be considered as a load converter. In order to simplify the analyt-ical analysis, the dc grid line resistances and inductive ele-ments are neglected. This simplification allows representation of all the dc capacitors at converter stations and the dc cable capacitances by a single shunt-connected capacitor (Cagg)
be-tween the two terminals: where Cagg is the total sum of all
dc-bus and dc cable capacitances.
PS PL
Cagg
Fig. 2. Two-terminal equivalent circuit of an MTDC grid with aggregated rectifiers and inverters
The power vs. voltage characteristics of the aggregated rectifiers and inverters will be the sum of the power vs. volt-age characteristics of the individual converters. If we assume that the rectifying converters have predominantly dc voltage droop characteristics and that of the inverting converters have predominantly constant power characteristics, then the power voltage characteristic curves of the source and load converters will resemble the curves shown in Fig. 3. The sum of dc volt-age droop characteristic lines with different droop constants forms a non-linear curve consisting of different slopes. The PS
curves in Fig. 3 represent an approximation of combined char-acteristics lines of large number of dc voltage droop controlled rectifiers. Note that the characteristic curve for the load con-verter is laterally inverted since the power axis for this termi-nal is opposite to that of the source converter.
Power PL PS0 PS1 PSmax1 PSmax P
Fig. 3. Power vs. Voltage characteristics curve of aggregated rectifying and inverting converter terminals
The intersection between the aggregate power flow through the rectifiers and the aggregate power flow through the inverters approximately gives the total amount of power exchanged between ac grids via the MTDC grid. This is shown in Fig. 3 by the intersection of the characteristics curves of the aggregated rectifiers (PS0) and the aggregated
inverters (PL). The lower intersection is unstable for small
disturbances and only the upper intersection is a valid operat-ing point. In steady state operation, PL will always be lower
than the maximum deliverable power of the aggregate rectifi-ers (PSmax) as the power flow schedules always take into
con-sideration the available loading capacity of the converters. However, transient disturbances such as sudden outage of a rectifier terminal or fault occurrence on the ac side of a rectifi-er trectifi-erminal reduce the powrectifi-er transfrectifi-er capacity of the aggregat-ed rectifiers. Meaning, PS0 characteristic curve shifts to the left
and PS1 becomes the new transient characteristic curve. When
the transient maximum deliverable power of the aggregated rectifiers (PSmax1) is lower than the power withdrawn by the
aggregated inverters (PL), then the difference ( P= PSmax1- PL)
will be supplied from the stored energy of the aggregated ca-pacitor (Cagg). This stored capacitive energy is, however, very
small and hence will last only very short duration without dis-charging the capacitor excessively. If the capacitors in the dc grid are discharged below a critical dc voltage level, the
recti-fiers’ power transfer capabilities decrease further leading to dc
voltage collapse.
If the cause of the disturbance is a fault within the dc grid or within the converter itself, then the problem will most likely persist resulting in dc voltage collapse followed by permanent disruption of power flow in the dc grid. However, ac faults are often temporary and power flow is usually restored after the clearance of the fault. In case of an ac fault behind a rectifier, if it is cleared before a critical dc voltage is reached, then the dc voltage will subsequently recover and stable power flow will resume. In addition to critical dc voltage level and the fault clearing time, dc voltage recovery also depends on whether or not there is enough deliverable power right after fault clearance that can meet the power demanded by the in-verters and the power needed to recharge the capacitors.
This study focuses on cases where power injection into the dc grid is reduced because of an ac grid fault and consequently dc grid capacitive energy depletion occurs; leading to a dc voltage collapse. Converter trips due to low voltage limit or synchronization problems, in cases of unbalanced ac faults, are not considered.
IV. DCVOLTAGE STABILITY CRITERION
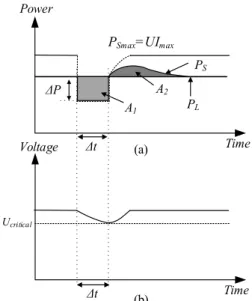
The two-terminal equivalent of an MTDC grid presented in Fig. 2 will be used to explain the dc voltage stability criteri-on. Fig. 4 shows stable power flow and dc voltage for an ac grid fault behind a rectifier unit. t is the fault clearing time
and P in Fig. 4(a) is the power supply gap in the dc grid dur-ing the transient disturbance. Thus, A1 represents the energy
deficit due to the reduced power injection caused by the ac fault. Since PL remains constant during the fault, the energy
deficit is covered by the energy discharged from the aggregat-ed capacitor. A2 represents the amount of energy needed to
recharge the aggregated capacitor with the same amount of energy as it has lost during the fault. In order to maintain dc system stability after fault clearance, the inequality A2 ≥ A1
must hold. The dc voltage stability phenomenon of dc grids has marked similarities with that of first-swing stability of synchronous generators in ac grids. However, A2 in Fig. 4(a) is
not bounded by a function of time unlike the same area in ac systems, which follows a sine curve. Due to this, the equal-area criterion in a dc grid does not specify the critical ac fault clearing time beyond which dc voltage collapse will be inevi-table. Instead, the criterion indicates that if the dc voltage re-covers after ac fault clearance, then the aggregated capacitor will be recharged with the same amount of energy as it lost during fault duration.
PSmax=UImax Power Time P PS PL A1 A2 t Voltage Time t Ucritical (a) (b)
Fig. 4. Illustration of stable case of ac fault impact on dc power flow
The maximum deliverable power by a converter (Pmax) is
the product of dc bus voltage and maximum dc current of the converter (Imax). Imax is a known and fixed value for a
convert-er, which means Pmax is dependent on dc voltage and reduces
with reduction in dc-bus voltage. After the fault is cleared, the maximum deliverable power by the aggregated rectifiers should be sufficient to meet the power demanded by the ag-gregated inverters (PL). Furthermore, additional power flow is
needed to recharge the capacitors and thereby to allow the dc voltage to return to the pre-disturbance level. If post disturb-ance PSmax is higher than PL, then the dc grid voltage will
re-cover from the fault. Hence, the dc voltage level at which the post disturbance PSmax equals PL defines the critical dc voltage
critical clearing time ( tcritical). The ac fault behind the
rectifi-er trectifi-erminal needs to be cleared before tcritical for dc grid
volt-age to recover and for dc power flow to continue uninterrupt-ed.
V. COMPUTATION OF CRITICAL CLEARING TIME AND
CRITICAL VOLTAGE
The energy discharged from the capacitors in the dc grid during the fault period can be computed as:
2 2
1 2
agg initial final
P t C U U (1)
where Uinitial is the pre-fault dc voltage level and Ufinal is
the dc voltage level when the ac fault is cleared. In order to achieve dc grid stability after fault clearance, the final voltage (Ufinal) should be greater than or equal to the critical dc voltage
(Ucritical) and the energy discharged from the capacitors should
be less than the maximum amount of capacitive energy (Emax)
that can be utilized for short-term power balancing in the dc grid. Emax is mathematically defined as:
critical final U U (2) max 0 t t Pdt E
(3) where max 1
2 2
2 agg initial critical
E C U U
Furthermore, the rectifiers’ available maximum power at
critical dc voltage (Ucritical) level should at least be equal to the
power demanded by the inverters (PL).
max( )
L critical
P P U (4)
Equations (2) - (4) together define the dc voltage stability criterion.
The three-terminal dc grid shown in Fig. 5 is used as an example to explain how the critical dc voltage and critical clearing time are determined. Terminal-A operates in dc droop control mode and regulates the dc voltage and balances power, while terminals-B and C operate in constant power control mode injecting and withdrawing fixed amount of power, re-spectively. The initial steady state power flows at the three terminals are PAo , PBo and PCo .
Cagg
A
B
C
Fig. 5. A three terminal dc grid
Assume that a three phase to ground fault occurs behind terminal-A and as a result the power injected by this terminal into the dc grid is reduced from the pre-fault level of PAo to
' A
P . The power deficit ( P) of the dc grid during the ac fault becomes:
'
o
A A
P P P (5)
By substituting (5) into (3), the critical clearing time (
t-critical) of an ac fault can be expressed in terms of Ucritical as:
2 2 0 ' 2 2 2 2 ' 1 2 1 2 2 tagg initial critical t
o
A A critical agg initial critical agg initial critical
critical o A A Pdt C U U P P t C U U C U U t P P
(6)Since terminals-B and C are operating in constant power control mode, the power flow at these terminals is unaffected by the low dc voltage during the fault and remains constant. Therefore, it is the maximum power transfer capacity of ter-minal-A that determines recovery of dc stability. In order to achieve stability, the power transfer capacity of terminal-A just after the fault clearance must be greater than or equal to the power transferred prior to the fault occurrence (PAo). This is expressed using (4) as:
A_ max A_ max ( ) o A o A P P U P UI (7)
The critical dc voltage is the voltage level where the power transfer capability after the fault clearance (Pmax(Ucritical))
equals PAo. This is mathematically given by:
max o o A A critical N P P U I kI (8)
where the factor k describes dc overcurrent capability in terms of the rated dc current for terminal-A. Imax is a known
fixed value for a converter and PAo has already been consid-ered as a known value. Hence, the critical dc voltage (Ucritical)
can be computed right away from (8). Once Ucritical is known,
the critical clearing time ( tcritical) can computed from (6).
It should be noted tcritical is related to PA' and uncertainty
in its values leads to variation in tcritical. The most
conserva-tive approach, which would give the shortest tcritical, is to
as-sumePA' 0.
VI. SIMULATION STUDIES
The proposed method of calculating critical dc voltage and critical clearing time was tested using the five-terminal MTDC system shown in Fig. 6. An average converter model with cascaded outer and inner vector control loops in dq-reference frame is used [8]. Converters connected to terminals 1 and 3 operate in rectifier mode while converters connected to termi-nals 2, 4 and 5 operate in inverter mode. All converters, except converter 1, operate in constant power operation mode, i.e.
injecting or withdrawing constant amount of power into and from the dc grid. Converter 1 operates in dc droop control mode controlling voltage and balancing power. Two cases were simulated, and their results were compared with the find-ings from the analytical method. In the first simulation case, only dc cable capacitances were used for the dc grid, while in the second simulation case, dc cable resistances and capaci-tance were used to model the dc grid. With these two cases, it is possible to analyze the effect of dc cable resistances in the results. The dc cable parameters used in the simulation analy-sis are shown in Fig. 6 and initial steady-state power flow for the different cases is presented in Table I.
1 2 3 4 5 l34=160 km l23=160 km l14=125 km l12=80 km Prated-1=900 MW Prated-2=800 MW Prated-3=1000 MW Prated-4=750 MW Prated-5=1200 MW DC-1=0.04
All cable resistance=0.01 Ω /km All cable capacitance=5 µ F/km Bipolar dc transmission for all cases Urated-1=400 kV
Fig. 6. Test MTDC system for the transient stability analysis
Table I. Initial steady state power flow for the test MTDC grid
Terminal no. 1 2 3 4 5 Ratings Prated (MW) 900 800 1000 750 1200 Urated (kV) 400 400 400 400 400 Case 1 P o (MW) 838 -400 675 -600 -513 Uo (kV) 400 400 400 400 400 Case 2 P o (MW) 838 -394.1 690 -600 -513 Uo (kV) 400.96 399.99 401.2 397.1 390.53
As mentioned earlier, dc grid cable resistances and induc-tive elements are neglected to simplify the analytical analysis and allow representation of all the dc-bus capacitors and the dc line capacitors by a single shunt capacitor. Assuming a time constant of 5 ms for all converter dc-bus capacitances, the sum of all dc-bus capacitances in the system is calculated as:
5 , 1 2 2 2 2 5 900 800 1000 750 1200 400 290.625
i rated i b rated P C U ms MW kV F (9)Similarly, summing up all the dc cable capacitances:
1 5 / 80 200 125 160 160 250 km 2 2437.5
CL F km F (10)The total aggregated capacitance in the test MTDC grid is found by adding (9) and (10).
2728.125
agg b L
C C C F (11)
Let us assume that Converter-1 in Fig. 6 is equipped with dc over-current controller which limits the dc current from exceeding 1.1 times the rated dc current. Therefore, Imax for
Converter-1 becomes: max 900 1.1 2.475 400 N I kI MW kA kV (12)
A three-phase-to-ground fault in the ac grid behind Con-verter-1 results in reduction in power transferred into the dc grid from the pre-fault level 838MW to about 110MW. The critical dc voltage, based on (8), becomes:
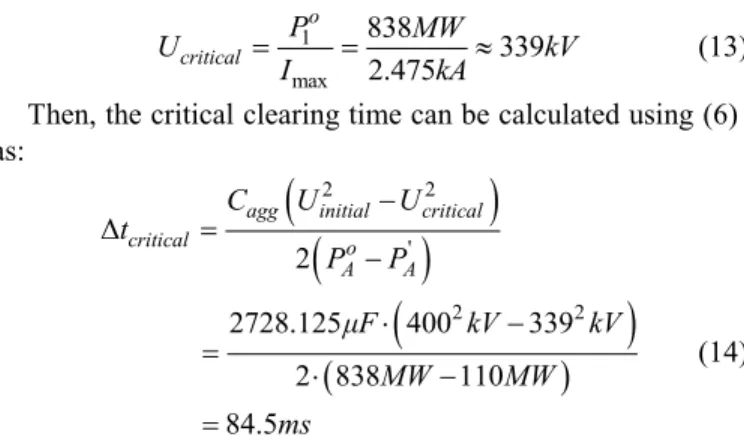
1 max 838 339 2.475 o critical P MW U kV I kA (13)
Then, the critical clearing time can be calculated using (6) as:
2 2 ' 2 2 2 2728.125 400 339 2 838 110 84.5agg initial critical
critical o A A C U U t P P F kV kV MW MW ms (14)
In order to validate the analytical approach, the test MTDC grid was simulated in EMTDC/PSCAD. In the first simulation case, Case 1, only dc cable capacitances are used for dc grid modelling; similar to the analytical approach. In this ideal loss-less grid, the dc grid has a flat voltage profile of 400 kV at all terminals and the sum of all terminal power flows is ze-ro. The initial steady-state power flows for Case 1 are present-ed in Table I. A three-phase short circuit fault was applipresent-ed in the ac grid connected to converter-1 at 1.5 s into the simula-tion. A ground fault resistance of 0.12 Ω was selected to ob-tain 110 MW power flow at converter-1 during the fault. Fault clearing times both shorter than and close the calculated criti-cal clearing time were simulated. The dynamic responses of the MTDC grid for three different fault clearing times are pre-sented in Fig. 7 to Fig. 9.
First, the dc grid’s transient response for a fault clearing
time of 70 ms was studied. This fault clearing time is shorter than the analytically computed critical clearing time and there-fore, it is expected that the MTDC grid will remain stable after the fault. Fig. 7 shows the response of the MTDC grid for an ac fault with 70ms duration.
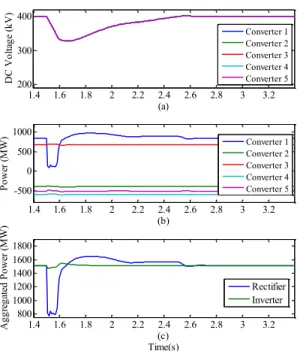
1.4 1.6 1.8 2 2.2 2.4 2.6 2.8 3 3.2 200 300 400 (a) D C V o lt ag e (k V ) Converter 1 Converter 2 Converter 3 Converter 4 Converter 5 1.4 1.6 1.8 2 2.2 2.4 2.6 2.8 3 3.2 -500 0 500 1000 (b) P o w er ( M W ) Converter 1 Converter 2 Converter 3 Converter 4 Converter 5 1.4 1.6 1.8 2 2.2 2.4 2.6 2.8 3 3.2 800 1000 1200 1400 1600 1800 (c) Time(s) A g g re g at ed P o w er ( M W ) Rectifier Inverter
Fig. 7. MTDC response for ac fault duration of 70 ms: (a) DC voltage at each converter terminal, (b) DC power at each converter terminal, (c) Aggregated
rectifier and converter power flows
It is clear from the plots in Fig. 7 that dc voltage recovers from the ac fault disturbance and dc grid operation continues uninterrupted. The top plot shows dc voltage measured at each converter terminal, while the middle plot shows power flow measured at the dc side of each terminal. The bottom plot shows the aggregated power flowing through the rectifiers (converter 1 & 3) and inverters (converters 2, 4 & 5) in the system. In steady state, the aggregated rectifier and aggregated inverter power flows are equal because it is a loss-less dc grid. However, during transient disturbance, there is a large differ-ence between the two indicating dc grid power imbalances. Due to reduced power flow into the dc grid (see Fig. 7(b) and (c)) during the fault, the capacitors in the dc grid are dis-charged, leading to drop in dc voltage as shown in Fig. 7(a). When the fault is cleared, dc voltage starts to increase and eventually returns to the pre-fault level at around 2.6 s. From Fig. 7(b), it can be observed that only dc power flow at con-verter-1 is changed during the ac fault while the power flow at the other converters in the dc grid remains constant. This is due to the constant power control implemented in converters 2 to 5. The area enclosed by the aggregated rectifier and aggre-gated inverter power flow curves in Fig. 7(c) indicate the en-ergy discharged from the capacitors during the fault and ener-gy restored to the capacitors in the dc grid after the fault.
MTDC grid response for 85 ms ac fault duration is shown in Fig. 8. DC voltage recovers after the fault and the grid re-mains stable after the disturbance. However, the dc voltage recovery time is much longer compared to the recovery time for 70 ms fault duration shown in Fig. 7. The disturbance re-covery time is also evident in Fig. 8(c), where area enclosed by aggregated rectifier and aggregated inverter power flow curves after the fault (area denoted by A2 in Fig. 4) is narrow
and long. 1.4 1.6 1.8 2 2.2 2.4 2.6 2.8 3 3.2 200 300 400 (a) D C V o lt ag e (k V ) Converter 1 Converter 2 Converter 3 Converter 4 Converter 5 1.4 1.6 1.8 2 2.2 2.4 2.6 2.8 3 3.2 -500 0 500 1000 (b) P o w er ( M W ) Converter 1 Converter 2 Converter 3 Converter 4 Converter 5 1.4 1.6 1.8 2 2.2 2.4 2.6 2.8 3 3.2 800 1000 1200 1400 1600 1800 (c) Time(s) A g g re g at ed P o w er ( M W ) Rectifier Inverter
Fig. 8. MTDC response for ac fault duration of 85 ms: (a) DC voltage at each converter terminal, (b) DC power at each converter terminal, (c) Aggregated
rectifier and converter power flows
DC grid voltage collapses and dc grid operation is inter-rupted when the ac fault is cleared after 86 ms. Fig. 9 shows dc grid performance for ac fault duration of 86 ms.
1.4 1.6 1.8 2 2.2 2.4 2.6 2.8 3 3.2 200 300 400 (a) D C V o lt ag e (k V ) 1.4 1.6 1.8 2 2.2 2.4 2.6 2.8 3 3.2 -500 0 500 1000 (b) P o w er ( M W ) Converter 1 Converter 2 Converter 3 Converter 4 Converter 5 1.4 1.6 1.8 2 2.2 2.4 2.6 2.8 3 3.2 800 1000 1200 1400 1600 1800 (c) Time(s) A g g re g at ed P o w er ( M W ) Rectifier Inverter
Fig. 9. MTDC response for ac fault duration of 86 ms: (a) DC voltage at each converter terminal, (b) DC power at each converter terminal, (c) Aggregated
rectifier and converter power flows
From the simulation results, it can be concluded that the critical clearing time for the studied five terminal dc grid for the considered steady-state power flow and ac fault is 85ms. Therefore, a fault in the ac grid behind converter-1 that reduc-es dc grid power flow to 110 MW should be cleared at the latest after 85 ms. This fault clearing time is very close to the calculated critical fault clearing time of 84.5 ms. DC voltage
level right before the fault is cleared, is around 333 kV. How-ever, dc voltage continues to drop (at a lower rate) until 1.69 s when the aggregated rectifier and inverter powers are equal. Therefore, the critical voltage level in the simulation, i.e. the voltage level at which post-disturbance aggregated rectifier and inverter powers are equal, is around 321 kV, while the calculated critical voltage level is 339 kV.
In the second simulation case, Case 2, dc cable capacitance and resistance parameters shown in Fig. 6 were used. This case is included to analyze the effect of dc cable resistances on the critical clearing time. The initial load flow for this case are presented in Table I. The power flow at converter-3 is changed (compared to Case 1) to account for the losses in the dc grid, and dc voltage is not the same at all terminals due to dc cable voltage drop. Similar to the previous case, a three-phase short circuit fault was applied in the ac grid behind con-verter-1 that resulted 110 MW power flow during the fault. It was found that the critical fault clearing is 80 ms, which is shorter than Case 1. However, the critical voltage level is on average around 320 kV, which is similar to Case 1.
The analysis presented above indicates converter terminals that are not affected by the disturbance are operating solely in constant power mode. Since the considered fault occurs be-hind the terminal that was regulating voltage, the dc grid volt-age drops until the fault is cleared. In this respect, the above analysis represents the worst-case scenario (in respect to con-verter control), where critical fault clearing time is the shortest because dc voltage drop is not mitigated by controller actions of other converters in the system. As such, the proposed meth-od can serve as a tool to assess how fast the converter control-lers need to react on disturbances. However, in the real sys-tem, converters will participate in both power and voltage regulation. Therefore, the critical clearing time will be longer than the scenarios considered in this work.
VII. CONCLUSION
In this paper, a method for dc voltage transient stability analysis in MTDC has been presented. It is shown that if an ac grid fault resulting in reduction of the dc grid voltage is not cleared before the critical clearing time, the dc grid will be-come unstable and operation will be disrupted. The derivation of the analytical equation for the fault clearing time has been presented in the paper. With the help of a five-terminal dc grid model in PSCAD simulation software, the validity of the ana-lytically estimated critical clearing time has been verified. The proposed method can be used as an aid to specify require-ments for the design of the converter controls to manage faulty situations in the ac grid close to rectifier terminals.
VIII. REFERENCES
[1] (05.10.2015). Offshore Wind Connections-Abb. Available:
http://new.abb.com/systems/hvdc/offshore-wind-connections
[2] (05.10.2015). Helwin2 Link Commissioned. Available:
http://www.windpoweroffshore.com/article/1352515/helwin2-link-commissioned
[3] "The European Offshore Wind Industry - Key Trends and Statistics 2013," European Wind Energy Association (EWEA)Januray 2014. [4] "Wind Energy Scenarios for 2020," European Wind Energy Association
(EWEA)July 2014.
[5] (05.10.2015). Nsn (Norway-Uk). Available:
http://www.statnett.no/en/Projects/Cable-to-the-UK/
[6] J. Beerten, S. Cole, and R. Belmans, "Modeling of Multi-Terminal Vsc
Hvdc Systems with Distributed Dc Voltage Control," Power Systems,
IEEE Transactions on, vol. 29, pp. 34-42, 2014.
[7] N. R. Chaudhuri, B. Chaudhuri, R. Majumder, and A. Yazdani,
Multi-Terminal Direct-Current Grids: Modeling, Analysis, and Control: Wiley, 2014.
[8] T. M. Haileselassie and K. Uhlen, "Precise Control of Power Flow in
Multiterminal Vsc-Hvdcs Using Dc Voltage Droop Control," in Power
and Energy Society General Meeting, 2012 IEEE, 2012, pp. 1-9. [9] W. Wenyuan and M. Barnes, "Power Flow Algorithms for
Multi-Terminal Vsc-Hvdc with Droop Control," Power Systems, IEEE
Transactions on, vol. 29, pp. 1721-1730, 2014.
[10] T. K. Vrana, J. Beerten, R. Belmans, and O. B. Fosso, "A Classification of Dc Node Voltage Control Methods for Hvdc Grids,"
Electric Power Systems Research, vol. 103, pp. 137-144, 10// 2013. [11] Y. Phulpin and D. Ernst, "Ancillary Services and Operation of
Multi-Terminal Hvdc Grids," in International Workshop on Transmission
Networks for Offshore Wind Power Plants as well as on Transmission Networks for Offshore Wind Power Farms, Aarhus, Denmark, 2011. [12] M. Aragüés-Peñalba, A. Egea-Àlvarez, S. G. Arellano, and O.
Gomis-Bellmunt, "Droop Control for Loss Minimization in Hvdc Multi-Terminal Transmission Systems for Large Offshore Wind Farms,"
Electric Power Systems Research, vol. 112, pp. 48-55, 7// 2014. [13] D. C. Kong and X. P. Zhang, "Transient Stability Analysis and
Optimal Coordinated Control of Multi-Terminal Vsc-Hvdc Based
Offshore Wind Farms," in Renewable Power Generation (RPG 2011),
IET Conference on, 2011, pp. 1-6.
[14] W. Wang, M. Barnes, and O. Marjanovic, "The Impact of Control Design on Dynamic Behaviour of Multi-Terminal Vsc-Hvdc (Mtdc)
System under Ac Grid Fault Conditions," in Power Electronics,
Machines and Drives (PEMD 2014), 7th IET International Conference
on, 2014, pp. 1-6.
[15] J. A. Suul, A. Luna, Rodri, x, and P. guez, "Power Control of Vsc Hvdc Converters for Limiting the Influence of Ac Unbalanced Faults on
Multi-Terminal Dc Grids," in AC and DC Power Transmission (ACDC
2012), 10th IET International Conference on, 2012, pp. 1-7.
[16] O. D. Adeuyi, M. Cheah-Mane, J. Liang, L. Livermore, and Q. Mu, "Preventing Dc over-Voltage in Multi-Terminal Hvdc Transmission,"
Power and Energy Systems, CSEE Journal of, vol. 1, pp. 86-94, 2015. [17] C. L. Moreira and B. Silva, "Operation and Control of Multiterminal
Hvdc Grids for Ac Fault Ride through Compatibility," in Energy
Conference (ENERGYCON), 2014 IEEE International, 2014, pp. 287-294.
[18] B. Silva, C. L. Moreira, H. Leite, and J. A. P. Lopes, "Control Strategies for Ac Fault Ride through in Multiterminal Hvdc Grids,"
Power Delivery, IEEE Transactions on, vol. 29, pp. 395-405, 2014. [19] L. Xu and L. Yao, "Dc Voltage Control and Power Dispatch of a
Multi-Terminal Hvdc System for Integrating Large Offshore Wind
Farms," Renewable Power Generation, IET, vol. 5, pp. 223-233, 2011.
[20] O. Gomis-Bellmunt, J. Liang, J. Ekanayake, and N. Jenkins, "Voltage–
Current Characteristics of Multiterminal Hvdc-Vsc for Offshore Wind
Farms," Electric Power Systems Research, vol. 81, pp. 440-450, 2//
2011.
[21] N. Mohan, T. M. Undeland, and W. P. Robbins, Power Electronics:
Converters, Applications, and Design: Wiley, 2002.
[22] P. Kundur, Power System Stability and Control: McGraw-Hill Inc.,