Decision Support Systems for the Food Industry
Sigurj´on Arason2, Eyj´olfur Ingi ´Asgeirsson3, Bj¨orn Margeirsson2, SveinnMargeirsson2, Petter Olsen1, and Hlynur Stef´ansson3 1 Nofima, N-9291 Tromsø, Norway
2 Mat´ıs, Borgart´un 21, 105 Reykjav´ık, Iceland 3 Reykjav´ık University, Kringlan 1, 103 Reykjav´ık, Iceland
Abstract. Applications of Decision Support Systems (DSSs) in the food industry, and in particular the seafood industry, are discussed. The amount of data recorded in the food industry has increased greatly in the last decade, parallel to descending cost of data recording through automati-zation and computer systems. The data can be used to fulfill the demands of consumers that want information on their food products, such as ori-gin, impact on the environment and more. By using traceability this flow of data can be used for decision support. Many fields within food pro-cessing can gain from using DSS. Such fields include for example lowering environmental impact of food processing, safety management, processing management and stock management. Research and development projects that the authors have taken part in and the following implementations of software solutions are discussed and some examples given of practical usage of DSS in the food industry as a result of such work.
1
Decision Support Systems for the food industry
-earlier development.
The seafood industry is the single most important food industry in Iceland and Norway. Therefore, much of our discussion in this chapter is based on research in the seafood industry and takes point of view in that industry. Research and development regarding decision support in the seafood industry has been ex-tended to the meat industry and combined with other methods, such as stock supply management. That shows well the value chain characteristics of the food industry in general. If some methods are applicable to a single value chain, for example a seafood chain, such methods are often applicable on other chains as well.
The food market has changed dramatically in the past years. Merging of re-tailers has created multi-national companies selling a large part of their products under their own label, capable of putting pressure on producers of food prod-ucts with regard to price. It is likely that the economics of scale will continue to be important when competing for the attention of consumers with decreasing buying power. This development, as well as the rise of speciality stores, aiming for the attention of high earning consumers, often marketed with statements of sustainability and originality. This has lead to a great pressure on the next link
in the chain, which is processing. The demands from the market mean that a processing manager needs raw material that is easy to process and in the right volume, in accordance to orders from the market. In many instances, the raw material supply is constrained. In the most important industry for Iceland, the seafood industry, the total allowable catch is for example constrained by regu-lations (quotas). The revenues are therefore mainly determined by the product price and the production yield from the constrained supply of raw material. The raw material properties that the processing plants are looking for are there-fore that the fish can be utilized well, that the properties and volume of the catch fulfill the demands from the consumers and therefore result in high prod-uct price. As Hasan and Raffensberger [9] point out, activities included in the seafood value chain, such as fishing, vessel scheduling, processing and marketing depend on each other. Decisions on fishing, processing, labour allocations, quota allocation and marketing may play an important role in the final quality of the marketed product and thereby the profits obtained. In order to supply fresh fish markets with quality products trawler scheduling, handling of raw material, processing scheduling and logistics all have to go hand in hand. Poor handling of the fish results in less quality of the products. Improper cooling and icing does for example result in higher temperature of the flesh, influencing growth of bacteria. Increased growth of bacteria contributes to a shorter shelf life, one of the most important factors for retailers. The age of the raw material is very important and thus a well organized time plan from catch to processing is of equal importance. As mentioned by Arnarson and Jensson [2], producers hav-ing more time to process a given quantity of raw material can be expected to produce more valuable products, than producers struggling with time pressure. Thus, having sufficient time for processing and knowledge on the raw material in advance to organize the processing in most efficient way, is very important.
The cost of processing is important as well. Manpower, energy and transport are among the factors influencing the cost. The same cost factors apply to the catching link. The fishermen need fish that can be caught easily, preferably not far from landing harbor, since long sailing time to catching grounds will increase oil cost and make it more difficult to supply the processing plants with fresh fish, but such raw material is of course a condition for being able to process fillets to be exported to the markets as fresh and thus with high contribution margin.
Decision support is also important in the processing link. Advance knowledge on the properties of the raw material is essential when planning the production. Many fish processing factories have a flexible work force, and can on short no-tice (typically a day) choose to employ more or fewer people in the processing. The most manually intensive process in the captured fish chain is the manual trimming and final deboning of the fish fillet, and dozens of people often work in parallel on this task. The skills, experience, speed and yield vary a lot between the people on the trimming line, and it is common to keep a performance his-tory for each worker and to give monetary bonuses for high speed / high yield / few bones missed. One of the most important daily decisions for the production leader to make is how many people to put on the trimming line. Too many,
and trimmers stand idle. Too few, and a bottleneck will form in front of the trimming line which in turn will cause a significant increase in throughput time, and a corresponding decrease in quality of the finished product. To make this decision, the production leader needs to know the expected performance of the workers, but also how labor-intensive the trimming is expected to be. Estimating this last factor is very complex. The work involved in manual trimming depends directly on the species, size, shape and texture of the fish. Generally, the fish species is known in advance (although catches in practice often contain several species), but detailed data about the other properties are not directly available in advance. What is known is that many other factors, like fishing area, time of year, temperature, gear type, treatment onboard, etc. influence the size, shape and texture, and so important decisions must be made based on a large, complex and interrelated set of data, some known and some estimated.
The Nordic fish industry exploits technical solutions heavily. Modern fish searching equipment, such as radar, is used to aid in locating the fish. Electronic log-books are now obligatory. By collecting electronic data on the catch, the companies enable sharing of information between vessels and land-based pro-cessing on the raw material and a build up of a database on the catch and its properties.
Fig. 1.A simplified value chain of cod. The arrows stand for flow of material (upstream) and information (upstream and downstream).
2
Decision Support Systems for the food industry - data
quality and traceability.
One of the biggest challenges for decision support is the ex-ante availability of real, relevant and representative data to base the decisions on. In the production industry in general, the availability and management of the ingredient, process and product data is through a traceability system. The most concise definition of product traceability is in the old ISO 8402 standard where ’traceability’ is defined as ’the ability to trace the history, application or location of an entity by means of recorded identifications’, and ’product traceability’ is said to specif-ically include ’the origin of materials and parts, the product processing history, and the distribution and location of the product after delivery’. A popular mis-conception is that traceability is synonymous with the ability to identify origin. Note that the definition explicitly points out that if you have traceability, you
should not only know where the product or the ingredients came from, but also what processes they went through and where they ended up.
For the production industry in general, there are various reasons why com-panies choose to invest in traceability systems. The most important benefits of internal traceability has been enumerated by Moe [24] to be:
1. Possibility for improved process control
2. Cause-and-effect indications when product does not conform to standards 3. Possibility of correlating product data with raw material characteristics and
processing data
4. Better planning to optimize the use of raw material for each product type 5. Avoidance of uneconomic mixing of high- and low-quality raw materials 6. Ease of information retrieval in quality management audits
7. Better grounds for implementing IT solutions to control and management systems
In addition, having a good traceability system also give significant advantages when dealing with suppliers, customers and the rest of the supply chain. Moe [24] indicates that the advantages of external, or supply chain traceability, mainly relate to:
1. Efficient recall procedures to minimize losses
2. Information about the raw material can be used for better quality and pro-cess control
3. Avoiding unnecessary repetition of measurements in two or more successive steps
4. Improving incentive for maintaining inherent quality of raw materials 5. Makes possible the marketing of special raw material or product features 6. Meets current and future government requirements (e.g. confirming country
of origin)
In addition to the drivers above, the possibility for improved decision support (both internally and in relation to suppliers and customers) can in itself be seen as a driver for investing in a traceability system. The drivers above are common for the production industry in general, and each company decides how important traceability is for them, and what level of ambition and degree of accuracy and granularity they want for the data in their traceability system.
With respect to traceability, the food industry is a special case where special requirements and drivers apply. The food safety aspect is the main reason for this, but there are also several other reasons why more recordings and better product documentation is needed in the food industry. The most important can be summarized as follows:
1. Having systems in place for backward tracing (upstream, towards origin) in case source of contamination needs to be identified
2. Having systems in place for forward tracing (downstream, towards consumer) in case contamination exists and a targeted recall needs to be effectuated
3. Food product documentation and traceability as part of mandatory Hazard Analysis and Critical Control Points (HACCP) system
4. Fulfilling legal requirements relating to food product documentation and traceability in production
5. Fulfilling legal requirements relating to food product documentation and traceability when exporting food
6. Fulfilling commercial requirements relating to food product documentation and traceability
7. Documenting food product properties relating to resource use, sustainabil-ity, ethics and the environment, in particular related to various types of eco-labels. Examples include Fair Trade, Max Havelaar, Green Point, Free Range, Svanen, Marine Stewardship Council, but there are also dozens of other national and international labels various types.
The last point reflects a growing concern for consumers and so for the food production industry. In addition to the labeling schemes mentioned above, var-ious large companies have reported plans for documenting resource use and en-vironmental load more explicitly for some food products. This includes putting information on distance travelled (food miles), associated CO2or greenhouse gas emissions, water or other resource use, etc. directly on the food product label. In addition, there is growing interest as well as increasing legislative and com-mercial requirements relating to the documentation of sustainable origin. For fish products in particular illegal, unreported and unregulated (IUU) fishing is a major problem, and the pressure to record data, document the product and have a good traceability system has increased significantly in the fish industry.
Since the food industry has all these extra drivers for traceability, it means that in general more data, and more accurate and detailed data will be avail-able in a traceability system for food products than for comparavail-able non-food products, and so better decisions can be made.
2.1 Thermal modeling for decision support in chill chains
Precise control of the product temperature throughout the chill chain is es-sential in order to minimize cost and maximize product quality and thereby product value. The most likely stages of the chill chain, where hazardous tem-perature abuse is experienced, are various interfaces between different trans-portation modes. This includes e.g. loading, unloading and delivery operations, even temporary storage, which easily can introduce some delays. The thermal load from the ambience of packaged, perishable products inevitably causes heat transfer from the ambience to the products and thereby temperature increases in the products. How seriously the thermal load affects the packaged products mainly is determined by the configuration and thermal properties of the pack-aging and products and the ambient conditions (air temperature, air velocity and even humidity). Several investigations have been reported in the open lit-erature on different aspects of frozen food chains focusing on the templit-erature rise as a function of product properties [4] ambient conditions [5], size and type
of packaging presence and thickness of air layer between the product and the packaging [35] and finally, the use of insulating pallet covers [30]. These studies reveal large variations of temperature even after short exposure to ambient con-ditions. The effect of including frozen cooling mats inside fresh fish boxes has also been studied [19, 21]. Experiments revealed that using cooling mats in fish boxes is an effective way to protect fresh fish fillets against temperature abuse. The same study showed that insulating performance of expanded polystyrene (EPS) boxes is significantly better than of corrugated plastic (CP) boxes, independent of usage of cooling mats. The difference in insulating performance between the two packaging types is actually even larger when cooling mats are utilized. The relation between choice of packaging and utilization of cooling mats appeared in the result that temperature abuse caused similar temperature increase in fresh fillets stored in EPS boxes without a cooling mat as in fresh fillets stored in CP boxes with a cooling mat. The same study showed that in dynamic tem-perature conditions, the temtem-perature distribution in a whole pallet of fish fillets can be far from homogeneous. The product temperature difference can easily exceed 6−8◦C depending on the order of magnitude of the temperature
fluctu-ations and their durfluctu-ations. But planning and conducting experiments, like the ones referred to above, are both time-consuming and expensive because of raw material cost, labour cost etc. In this context, numerical modeling has proved to be a useful and cost-sparing tool for predicting product temperature in dy-namic temperature conditions [25, 26]. The parameters related to the packaging, which can be taken into consideration in numerical thermal models for packaged products, are e.g. materials used in the packaging, the method of packaging the chilled/frozen product inside consumer packs, how consumer packs are packed in master cartons and finally, how master cartons are packaged in pallets. All these parameters can heavily influence the thermal performance of the packag-ing. Numerical analysis can also help establish the optimal positions for placing thermometers as well as have an idea of the distribution of the temperature in the pallet from temperature readings in few points. Temperature monitoring systems in cold chains are normally aimed at measuring and monitoring the ambient air temperature in the chain. The predominant parameter for deter-mining the storage life of the perishable, chilled product is on the other hand product temperature - not the ambient air temperature. Thus, a clear need is for coupling the ambient air temperature-time history to the product tempera-ture. This is exactly what numerical thermal models for packaged products can provide. Thermal models can thus provide product temperature input to micro-bial growth models from ambient temperature-time history and thereby be used for risk assessment purposes in chill chains. The influence of ambient heat load on the packaged product’s temperature is not the only field where numerical thermal models are helpful for making decisions and optimizing the chill chain. The rapid evolution in the computer industry since the ninth decade of the last century has enabled commercial CFD (Computational Fluid Dynamics) codes to be used for effectively improving temperature control in refrigerated trucks [1, 27] and cold stores [20, 28, 7, 11]. These numerical investigations have proved
the potential of CFD in improving design of buildings for chilling and storing foodstuffs.
2.2 Choosing the right raw material
The problem of choosing the right raw material has always been an important task for all food producers. For Icelandic seafood producers, the situation has been no different, choosing the right catching location is of utmost importance. Sigvaldason et al. [31] were probably the first to use operations research (OR) in Icelandic fisheries to choose catching location. Another example of an OR study in Icelandic fisheries is that of Jensson [14], who introduced a simulation model for analyzing fleet operation. His focus was among other things on the effect of fleet operations on the total catch, on the utilization of different factories and on the different size categories of boats. Jensson [15] should also be mentioned, where the focus was on daily scheduling in fish processing. Millar and Gunn [23] presented a different simulation model, with the aim of to assessing the impact of catch rate variability on the cost-performance of a coordinated fishing fleet. They concluded that such models were of use for decision making in the industry. Randhawa and Bjarnason [29] looked into landing of the catch while taking inventories of raw material at the processing plants into account. A recent model, developed by Hasan and Raffensberger [9] was aimed at coordinating trawler scheduling, fishing, processing and labour allocation of an integrated fishery. Results of the model could be used to aid decision makers on where catch should be conducted, how much was to be caught, what kind of products should be produced and on workforce allocation as well.
Many different factors affect the profitability of a seafood value chain. To name a few, the following cost factors were considered necessary to construct an optimization model for the fish industry in 1969 [31].
1. Salaries of crew on vessels and employees of land based processing. 2. Cost of fishing gear.
3. Cost of cooling system/ice cost on vessel.
4. Maintenance cost, vessels and land based processing. 5. Insurance cost.
6. Landing cost.
7. Cost of food for crew.
8. Office cost and other fixed cost of running the company. 9. Financial costs.
2.3 Optimization models, theory and practical outcomes
To solve the problem of choosing the right location, timing and more for raw material acquisition, linear optimization model has been proposed and used [19, 8]. The proposed model is a combination of an assignment problem and a pro-duction problem, where the objective is to assign vessels to fishing grounds and to determine the allocation of the expected catch in order to maximize the total
profit of the fishing company. The solution of the model is actually a detailed plan for both fishing and processing for a specific planning period, often a year, where the constraints of fishing regulations, such as quota, and personnel re-strictions are considered. This plan can then be used as a suggestion for the actual plan or as a source of inspiration for the planners. Figure 2 illustrates the relationship and the causal chains for the model. The indexes used in the model are the following:
To solve the problem of choosing the right location, timing and more for raw material acquisition, linear optimization model has been proposed and used [19, 8]. The proposed optimization model can be described as a multi-commodity flow model, where the properties of the material flowing through the proposed network are dependent upon the way the raw material flows through it. This is because the properties of the fish change as it flows through the network, illustrated in Figure 2. The indexes used in the model are the following:
v : Fishing area.
s : Vessel identity.
h: Harbor identity.
r : Distribution of raw material, e.g. domestic market, foreign market or own factory.
a : Product type.
t : Season.
f : Category of raw material. Each species can be divided into different cate-gories, e.g. based on grading.
g : Fish species. Cod, haddock, redfish, etc.
The decision variables (the variables that the model can control in order to find the best solution) are:
Yvshtf : Quantity of fish species f caught by vessel s in fishing area v during seasont and landed in harborh.
Zvshrtf : Quantity of fish species f caught by vessel sin fishing area v during seasont, landed in harborhand sold in distribution canalr.
Qvshratf : Quantity of fish speciesf caught by vesselsin fishing areav during seasont, landed in harborh, sold in distribution canalrand processed into producta.
Uaf : Quantity of productafrom fish speciesf.
T inf : Quantity of quota transferred into fish speciesf.
T outf : Quantity of quota transferred from fish speciesf.
W inf : Quantity of quota leased to the company of speciesf.
W outf : Quantity of quota leased from the company of species f.
Dvsth : Days used by shipsin fishing areavin seasont, sailing from harborh.
DTrt : Daytime hours used in own processing plant (r) in seasont.
The objective of the proposed model is to maximize the total profit of the value chain from catch through processing:
Profit = Fishing revenue - Fishing cost + Processing revenue - Processing cost Fishing revenue comes from sales of caught fish and leasing quota from the company. Fishing cost is the cost of catching, landing and marketing, if mar-keted as whole fish. Processing revenue are the revenues from the processing plant and Processing cost is the cost of processing. The model is subject to a number of constraints, such as quota and labour availability. The constraints, parameters of the model and the mathematical presentation are discussed in detail in Margeirsson et al.[19] and Gudmundsson et al. [8].
The model requires four different categories of data:
1. Data regarding the fishing grounds; catch volume, species composition,
sail-ing distances. Available through electronic log-books (see for example www.seadata.is). 2. Data on the fish caught; properties of catch with respect to processing.
Avail-able through measurements from quality control.
3. Data on operations expenses including fishing, transport and processing. Available from most information systems used in the companies (see for example www.wisefish.com).
4. Data on markets; demand and price of seafood (as raw material) and seafood products.
Table 1.A general form of linear programming model.xiare the decision variables of
the model,ciare the cost coefficients whileaijandbj are data parameters.
Maximize c1x1+c2x2+...+cnxn, (objective function)
Subject to a11x1+a12x1+...+a1nxn≤b1 (constraint 1) a21x1+a22x1+...+a2nxn≤b2, constraint 2)
.. .
am1x1+am2x1+...+amnxn≤bm, (constraint m) x1, x2, ..., xn≥0
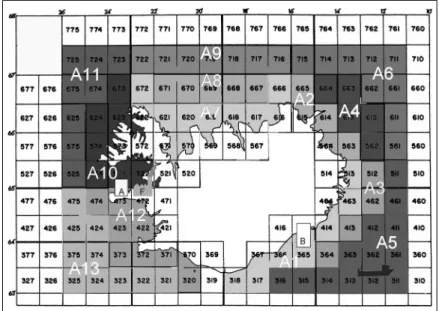
To ensure that the model is solvable, all the constraints and the objective functions are linear. Linear optimization problems, such as the problem shown in Table 2.3, are usually solved in a fairly short time, given that their size is not prohibitively large. When solving the model, the Icelandic catching areas were divided into 13 subareas (A1-A13, see Figure 3) and the year divided into quarters. Data on catch volume and species composition (relative proportion of the most important species) in each area were estimated, in collaboration with the catching manager of one of the larger seafood companies in Iceland (GR: Gudmundur Run´olfsson hf). To simplify, only two harbors were used for landing and the model was based on a company with one location for processing.
Fig. 2.A network for one season that shows a flow of caught fish through a value chain of a fisheries company.
Sailing distance from the two harbors (see Figure 3) to the 13 areas was ranked (the sailing distance from each harbor to a specific area was estimated as 1, 1.5 or 2, depending on the distance between the area and the harbor). Access was granted to accounting system of GR, where data on operations expenses including fishing, transport and processing were obtained. Data on markets were also obtained from GR.
Fig. 3.Partition of Icelandic waters into 13 different areas (A1-A13). The figure also shows the locations of two harbors, A and B and the fish processing plant F. Harbors A and B are the harbors where the trawler of the company in the scenarios can land. Fish processing plant F is owned by the company.
We refer to Margeirsson et al.[19] and Gudmundsson et al. [8] regarding the results from the model. The main result show that by combining the effort of industrial companies in the fish industry with the scientific and management skills of the research and university community, knowledge on the properties of the catch can be improved substantially and OR can be used to assist decision making in the value chain of cod, where factors such as catching ground, catch-ing season, oil price, leascatch-ing of quota and management of land-based processcatch-ing are among the factors that have to be taken into consideration.
3
Decision support systems in the meat supply chain
In modern food industry as well as most other modern industries, there is a gen-eral and constant pressure to improve service levels and take inventory out of the supply chain as far as possible. At the same time there is a pressure to achieve higher throughput in a shorter timeframe and cut down cost of the production. In addition to the increased competition the food industry faces growing chal-lenges from increasing operational complexity, new government regulations and consolidation within the industry. Decision support systems have recently proved themselves to be helpful tools and are becoming essential to stay competitive within most sectors of the food industry.The production and processing of meat is a challenging part of the food industry. Some of the biggest challenges are to maintain traceability, predict the demand of the customers and the perishable goods and dated products require special handling and attention. Meat is in general expensive raw material and the lifetime of the raw material and the fresh meat products is often limited to 1-2 weeks. It is well known in the meat industry that there is a considerable waste of raw material and products at various locations in the supply chain of meat. The aim of the project covered in this case study is to improve efficiency and reduce waste in the entire food supply chain. The case study includes two relatively large producers of meat and also a relatively large retailer with Because of the expensive raw material there is a great potential for increasing profits by reducing waste and as a result the project is of great importance for manufactures as well as retailers.
3.1 Cause of waste = need for DSS
The first part of the project included a detailed analysis of the food supply chain with the objective of identifying the main causes of waste of raw material and final products. We divided the supply chain into links and each link was analyzed with respect to processes that influence costs and prices as well as factors that promote waste. The results showed that the main sources of waste are:
1. Excessive production and inventory levels of perishable products 2. Improper handling of products and raw material
3. Problems with logistics
The problems with logistics were mainly caused by inadequate cooling or freezing of products during transportation. We responded to those problems and to the improper handling of products and raw materials by redefining work pro-cesses and increasing training of employees. The excessive or wrong production and inventory levels were identified as the biggest sources of waste and the focus of the project was as a result put on improving performance of production and inventory management. The inventory and production management is of course also important in order to avoid lack of products in stores which can decrease customer satisfaction quite noticeably and affect both retailer and producer.
Collaborative planning methods used together with advanced forecasting methods are generally known to be of help in reducing inventory levels and increasing efficiency in supply chains [33]. The theory can be considered as es-tablished and there exists various studies that report successful implementations [34]. It is generally accepted that collaboration of different companies in the food supply chain can also be an effective method to reduce cost [22]. Collaboration is also an effective method to reduce waste when perishable products are involved such as in food supply chains. Our analysis showed that the companies in the supply chain, especially the producers and the retailers did not share information or collaborate in any other ways with the common objective of improving the management of the entire supply chain. One of the main reasons we discovered
was lack of trust but also lack of simple procedures and tools to support the collaboration. Other studies have also identified the lack of trust as the main barrier for increased collaboration in the supply chain of various products [6, 10, 12, 16]. These studies also report other problems based on experience from vari-ous experimental projects. The general conclusion is that there is a considerable potential benefit but it has too often failed to maintain the collaboration after the duration of the experiments and maintain the collaboration as a part of the daily processes in the companies. We believe this is mainly because of the lack of simple procedures and efficient tools and decision support systems to support the collaboration. Sm˚aros [32] reports several barriers for the increased collab-oration and among others the limited capabilities of retailers to make accurate sales forecasts, different needs of retailers and suppliers for sales forecasts, and finally the lack of combining daily information with long-term production plans. Effective decision support systems can for sure be of great help with removing these barriers.
Most companies run enterprise resource planning systems (ERP) systems for keeping track of production, inventories and sales. The ERP systems store huge databases containing various business data but the data is usually poorly used for improving decision making. Vast experience and knowledge is often hidden in the databases and it is often possible to improve decisions by using the data combined with effective decision support systems. That is exactly what we did in our study of the meat supply chain in order to reduce waste and improve efficiency. To begin with we focused at individual links of the supply chain and developed a decision support system for producers (and suppliers) and retailers used independently but the next step was to develop methods for collaborative planning. The logic of the system for the producers/suppliers and the retailers was however very similar. In the following we will explain our work on decision support systems for each link, i.e. producer and retailer, and finally for the collaboration between the links.
3.2 Decision support for food producers
The analysis phase of the project clearly showed that the producers of the meat products were having problems with estimating demand for end products and planning the production properly in accordance with demand. The producers were as a result experiencing problems with both overstocking and shortages. The overstocking is in particularly bad because of the short shelf life of most of the meat products. In addition the producers were also having problems with the inventory of various ingredients and components needed for their production which reduced their own response time to unexpected changes in demand. The level of information technology in the meat processing industry has increased during the last year. All larger companies have implemented ERP systems but advanced decision support systems are still uncommon and managers are mostly working with data and doing homemade calculations with spreadsheet software. To provide decision support for the producers involved in our project we have been developing a decision support system based on an already existing solution
AGR Inventory Optimiser (AIO) that was originally developed for retailers. AIO is an inventory planning and optimization decision support system that aims to minimize both inventory costs and shortages.
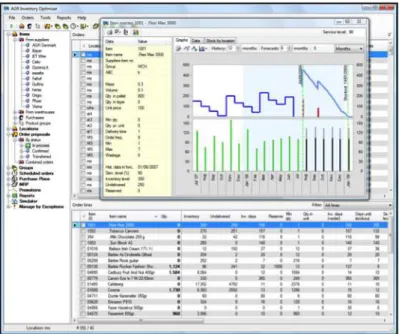
The head of production planning in the factory makes a production schedule for each week and updates the schedule more often if needed by products with very high production frequencies or if some of the presumptions changes. The managers of each production line then use the production plan as a ranked list of tasks they have to finish. Figure 4 shows a screenshot of the user interface.
Fig. 4.The figure shows the user interface for reviewing production proposals.
As input for the demand forecasting we use sales information about each product number. We use historical data from the existing ERP systems and the expert system automatically selects the best fitting forecasting method. It chooses among the following classes of forecasting models: simple methods, curve fitting, low volume models, exponential smoothing and Box-Jenkins. The system ensures that the most relevant forecasting method gets chosen for an item de-pending on the nature of the product and the amount of historic data available. Based on the forecast and information about current inventory levels the system calculates production amounts where:
Production amount = TSL – current stock – production already in progress
TSL (Target stock level) = (expected demand on delivery time + production frequency) + safety stock
and
safety stock =Z×S×√delivery time + production frequency Z = service level parameter (e.g. 95% = 1,65).
S= standard deviation of demand.
The objective of the calculations is to minimize inventory levels at the same time as fulfilling the predefined service level. The production amounts are dy-namically updated in an automatic manner as inventory level or demand changes. The products with the highest sale and shortest shelf life are produced three times per week. Such a high production frequency requires accurate sales fore-casts that predict daily sales. It is very challenging to create sensible forefore-casts for daily sales of consumer products based on the shipments from the producers and we have had problems with making them accurate enough. The forecasts for the products with low production frequency and often long shelf life are on the other hand much more accurate and easier to make. This is a problem that will be commonly found within the food industry for products with short shelf time.
As mentioned previously the system makes an automatic proposal of a pro-duction plan for each week based on current inventory levels and demand fore-casts. The system also takes into account the shelf life of the products and of the production dates of existing inventory. The system provides a user-friendly interface for the production manager to review the production proposals and use his or her expertise to improve the results. It is very important to note that the best results may be obtained by combining the automation of an optimization based system with the expertise of an advanced production manager.
The producer also uses the system to make purchasing plans for the in-gredients or components he needs to use for the production. The system uses Bill-of-materials (BOM) to specify how an end-item is constructed from various components and it uses material requirement planning (MRP) calculations to specify the amount that is needed of each component for an end-item, based on a production plan and the bill-of-materials for the end-item. The MRP calcula-tions also take into account the dates the components are needed based on the production plan for the final products.
3.3 Decision support for retailers - Inventory management and Replenishment
By analyzing the operation of the retailers we found similar inventory man-agement problems as found in the production companies. The retailers were obviously having problems with estimating demand as a result they were expe-riencing problems with both overstocking and shortages. The overstocking is in
particularly bad because of the short shelf life of most of the meat products and at the stores we could see too much of out-of-date and spoiled products. Our initial solution was therefore to implement a similar decision support system as we implemented for the producers. The main difference is that the stores use the decision support system to create orders from the supplier while the pro-ducers use the system to make production plans although the underlying logic is very similar. As before the system provides automatic estimation of demand and automatic calculation of purchasing proposals that the purchasing manager reviews and finally confirms.
Fig. 5.The figure shows the item master with product details and graphical presen-tation of historical data and future estimates. The purchasing managers at the stores can view historical inventory development, historical sales figures, future forecasts, un-delivered production orders and projected inventory levels.
The implementation of the system should be rather straightforward if all data is available. We have however experienced great problems in accessing the required data from the ERP system the stores have. Among of the required data is the real-time inventory level of products in the stores. Since we are working with perishable products with very short shelf life we also need the age distribution of the inventory of each product in order to be able to estimate the remaining life-time of the inventory. This has not been possible in our case. Most ERP systems currently in use are not set up for storing real-time inventory levels with or without age distribution of the stock. More recent versions of most advanced ERP systems have this functionality but the implementation can be expensive and especially if companies need to upgrade from old versions as in our case. The estimated cost for the retailer of implementing a new ERP system that can deal with the inventory and the age distribution of the stock is 5-10
million Euros. Of course would a new ERP system be able to do many other nice to have things but it wasnt by any means possible to justify the investment for the time being. This made our implementation very difficult and instead of using exact data we had to rely on more rough estimates. We got the inventory levels in the stores by using unconfirmed data from the reception of deliveries to the stores and combined it with data on shipments that were sent from the producers to the individual stores. This way we got acceptable accuracy for the inventory levels data but we were not able to get data on the age distribution of the stock. Instead we had to rely on the First In First Out principle (FIFO).
The availability of reliable information on inventory levels including the age distribution of the stock is a crucial factor for easy and successful implementation of decision support system for purchasing and inventory management of goods with short shelf life.
3.4 Information sharing - collaboration planning
As mentioned previously can collaborative planning methods be of help in re-ducing inventory levels and increasing efficiency in supply chains [33]. For the meat supply chain under consideration here it can be beneficial to share informa-tion about sales and inventories within the chain. Demand variability increases as one moves up the supply chain away from the consumer and small changes in consumer demand can result in large variations in orders placed upstream. Eventually, the network can oscillate in very large swings as each organization in the supply chain seeks to solve the problem from its own perspective [3]. This phenomenon is known as the bullwhip effect and has been observed across most industries [17, 18]. The bullwhip effect was obvious in the meat supply chain un-der consiun-deration in our study. As an attempt to remove the bullwhip effect we have been using the AIO decision support system as a platform for information sharing and we have tried to use the additional information as a part of the planning process. Since the system had been implemented both for the retailer and the producer this was a rather straight forward choice.
The idea is to share information on stock levels and sales within the supply chain. The information on stock levels is on one hand shared between individual stores of the retailer and on the other hand between the retailer and the producer. If a certain store is overstocked of some products while other stores are under stocked of the same products it can be beneficial to redistribute the stock more evenly between the stores and thereby prevent the stock from expire and reduce the probability of stock outs. The producer can also reduce his inventory levels and shorten the lead time of his products by using real-time sales and inventory information from the retailer stores.
To share the information we use an exception based reporting module. We use predefined user interfaces as well as a flexible user interface that allows users to create rules to deal with situations that need to be alerted. Dynamic lists are presented when certain criteria are met, e.g. potential stock outs, exceptionally high sales, large deviation between forecasted and actual sales, overstocked items, under stocked items etc. Advanced users can define their own criteria by writing
Fig. 6. The figure shows an example of a report generated in the system. Here it is showing the proportional distribution between suppliers of items in danger of running out of stock before next delivery.
SQL statements in an advanced filter which is included in the decision support system.
3.5 Conclusions
The most important lesson learned from this case study is not a new one, namely the importance of having access to accurate and well structure data. The poten-tial benefits from using decision support systems for implementing collaborative planning methods and advanced forecasting, inventory and production manage-ment methods are obvious. These potential benefits will however not be properly obtained without the access to accurate and up-to-date data on the inventory levels and lifetime of inventory at all levels in the supply chain.
Information stored in ERP system can be very valuable if used correctly. Most current ERP systems are however not using the information properly to support decision making and there is a large scope for improvements obtained with useful and effective decision support modules, either as part of the ERP systems or individually developed.
4
Overall conclusion and next steps
It can be concluded that DSS have already proved useful in the food industry and there are great possibilities for extended usage. The food industry is different to many other industries, since the nature of the products and and ingredients can
change dramatically with time and differently in different conditions. Traceabil-ity is therefore important, in order to know the history of the product and/or ingredient of interest. An important matter when food is discussed if for example safety. Food safety information can be attached to a product by utilizing trace-ability - enabling easier management by food control authorities and improved quality management within food value chains.
The potential scope of DSS is wide. To mention a few interesting fields, DSS can be used to minimize environmental impact from food processing, for process management purposes, for stock management (taking into account the fact that most food products are highly perishable.
In order to accelerate the usage of DSS in the food industry, more collabora-tion between food business operators, software providers, research institutes and universities is demanded. Merging of information systems and operation research is required and detailed understanding of the food industry as well, in order to interpret the answers found and ensure realistic usage of DSS. One obvious field of interest is to take the natural variability in raw material into account when managing the value chain of food
It is quite evident that there are a lot of opportunities in using DSS within the food industry. Automatization in the past decades has meant that a lot of data is gathered but are of little use, since no one knows how to handle them or create information from the data. One should though always keep in mind that believing your data blindly can often be unsafe and the old phrase oftrash in -trash out is fully legitimate in the food business as well as other places.
References
1. Amara, S.B., Youbi-Idrissi, M., Moureh, J., Guipart, J. Numerical simulation of air humidity distribution in a refrigerated truck enclosure. Proceedings IIF-IIR. Inter-national Congress of Refrigeration. Bejing, China, 2007.
2. Arnarson I and Jensson P. 2004. Impact of the cost of the time resource on efficiency of economic processes, European Journal of Operational Research, 172, pp. 616-630. 3. Boute, R.N., Disney, S.M, Lambrecht, M.R and Houdt, B.V, 2007, An integrated production and inventory model to dampen upstream demand variability in the sup-ply chain. European Journal of Operational Research, 178 (1), 121-142.
4. Chao, L., Levin, B.R., 1981. Structured habitats and the evolution of anticompetitor toxins in bacteria. Proc. Natl. Acad. Sci. USA 78, 6324-6328.
5. Dolan, K.D., Singh P., Heldman DR. 1987. Prediction of temperature in frozen foods exposed to solar radiation. Journal of Food Processing and Preservation 1987;11:135-58.
6. Fliender G., 2003. CPFR: an emerging supply chain tool. Industrial Management & Data Systems 103/1, 2003, p. 14-21.
7. Foster, A.M., Swain, M.J., Barrett, R., James, S.J. 2003. Experimental verification of analytical and CFD predictions of infiltration through cold store entances. Int. J. of Refrigeration 26:918-925.
8. Gudmundsson R., Jensson, P., Margeirsson S., Arason S. 2006. ´Akvardanataka og bestun ´ı sj´avar´utvegi. M.Sc. Thesis, University of Iceland, Department of Mechanical and Industrial Engineering. Reykjavik.
9. Hasan, M.B. & Raffensperger J.F. 2006. A mixed integer programming for an inte-grated fishery. Orion Volume 22(1). pp. 19-34. South Africa.
10. Hingley M.K., 2005. Power to all our friends? Living with imbalance in the supplier-retailer relationships. Industrial Marketing Management 34 (2005) p.870-875. 11. Hoang, M.L., Verboven, P., De Baerdemaeker, J., Nicolai, B.M. 2000. Analysis of
the air flow in a cold store by means of computational fluid dynamics. Int. J. of Refrigeration 23:127-140.
12. Hollingsworth A, 2004. Increasing retail concentration Evidence from the UK food retail sector. British Food Journal Vol 106 nr 8 pp. 629-638. Emerald Group Pub-lishing Limited ISSN 0007-070X.
13. The Icelandic Ministry of Fisheries and Agriculture: Icelandic fisheries in figures 2008, http://eng.sjavarutvegsraduneyti.is/Publications/nr/9466.
14. Jensson P. 1981. A simulation model of the capelin fishing in Iceland, pp. 187-198, in HALEY, K.B. (ED.), Applied operations research in fishing, Proceedings of The NATO Symposium, Trondheim.
15. Jensson P. 1988. Daily production planning in fish processing firms. European Journal of Operational Research, 36, pp. 410-415.
16. Johnson S., 2004. Supply chain management in the lamb industry: An analysis of opportunities and limitations. AFBM Journal 2 nr 2. Australian Bureau of Agricul-tural and Resource Economics Commonwealth of Autralia, Canberra.
17. Lee, H.L., Padmanabhan, V., Whang, S., 1997. The bullwhip effect in supply chains. Sloan Management Review 38 (3), 93102, Spring.
18. Lee, H.L., Padmanabhan, V., Whang, S., 1997. Information distortion in a supply chain: The bullwhip effect. Management Science 43 (4), 546558.
19. Margeirsson S., Gudmundsson R., Jensson R., Jonsson G.R., Arason S. 2007c. A Planning Model for a Fisheries Company. European Journal of Operational Research. Submitted.
20. Margeirsson, B., Arason, S. 2008. Temperature monitoring and CFD modelling of a cold storage. In: CCM 2008: The 3rd International Workshop on Cold Chain Management. 2 - 3 June 2008. Bonn, GER, p. 215 - 226.
21. Margeirsson, B., Arason, S., Palsson, H. 2009. Thermal performance of corrugated plastic boxes and expanded polystyrene boxes. Matis report 01-09.
22. Marzian R, Garriga E., 2002. European CPFR insights. ECR Europe, Accenture. 23. Millar H.H., Gunn E.A. 1990. A simulation model for assessing fishing fleet per-formance under uncertainty. Proceedings of the 1990 winter simulation conference. Edited by Osman Balci, Randall P. Sadowski and Richard E. Nance.
24. Moe, T. 1998. Perspectives on traceability in food manufacture. Trends in Food Science & Technology, 9(5), 211-214.
25. Moureh, J., Derens, E. 2000. Numerical modelling of the temperature increase in frozen food packaged in pallets in the distribution chain International Journal of Refrigeration 23: 540-552.
26. Moureh, J., Laguerre, O., Flick, D., Commere, B. 2002. Analysis of use of insulating pallet covers for shipping heat-sensitive foodstuffs in ambient conditions. Computers and Electronics in Agriculture 34: 89-109.
27. Moureh, J., Menia, N., Flick, D. 2002. Numerical and experimental study of air-flow in a typical refrigerated truck configuration loaded with pallets. Computers and Electronics in Agriculture 34: 25-42.
28. Nahor, H.B., Hoang, M.L., Verboven, P., et al. 2005. CFD model of the airflow, heat and mass transfer in cool stores. Int. J. of Refrigeration 28:368-380.
29. Randhawa S.U. & Bjarnason E.T. 1995, A decision aid for coordinating fishing and fish processing, European Journal of Operational Research, 81, pp. 62-75.
30. Sharp, A.K., Irving, A.R. Insulating covers for pallets of food. Proceedings IIF-IIR Commission D2. Prague, Czechoslovakia, 1981.
31. Sigvaldason H., Hafsteinsson J., J´ohannsson K., Benediktsson O. 1969. Br´adabirgdask´yrsla um adgerdaranns´oknir ´a ´utgerd togskipa med tilliti til hr´aefnis¨oflunar fyrir frystih´us ´a Nordurlandi. Fisheries Association of Iceland and Computing services of the University of Iceland.
32. Sm˚aros J. 2007 Forecasting collaboration in the European grocery sector: observa-tions from a case study. Journal of Operaobserva-tions Management 25 (2007) 702716. 33. Stadler, H. and Kilger, C., 2005. Supply Chain Management and Advanced
Plan-ning, Springer-Verlag.
34. Womack, J. P. and Jones, D. T. 2003. Lean Thinking Banish waste and create wealth in your corporation, Lean Enterprise Institute (2003).
35. Zuritz, C.A., Sastry, S.K. Effect of packaging materials on temperature fluctua-tions in frozen foods: mathematical model and experimental studies. Journal of Food Science 1986; 51(4):1050-6.