UNIVERSIDAD AUTÓNOMA DE NUEVO LEÓN
FACULTAD DE INGENIERÍA MECÁNICA Y ELÉCTRICA
DIVISIÓN DE ESTUDIOS DE POSGRADO
REAL TIME COORDINATION OF OVERCURRENT RELAYS BY MEANS OF
OPTIMIZATION ALGORITHM
THESIS
IN ORDER TO OBTAIN THE MASTER DEGREE IN ELECTRICAL ENGINEERING
P R E S E N T :
ENG. MENG YEN SHIH
UNIVERSIDAD AUTÓNOMA DE NUEVO LEÓN
FACULTAD DE INGENIERÍA MECÁNICA Y ELÉCTRICA
DIVISIÓN DE ESTUDIOS DE POSGRADO
REAL TIME COORDINATION OF OVERCURRENT RELAYS BY MEANS OF
OPTIMIZATION ALGORITHM
THESIS
IN ORDER TO OBTAIN THE MASTER DEGREE IN ELECTRICAL ENGINEERING
P R E S E N T :
ENG. MENG YEN SHIH
Universidad Autónoma de Nuevo León
Facultad de Ingeniería Mecánica y Eléctrica
Subdirección de Estudios de Postgrado
Los miembros del comité de tesis recomendamos que la tesis REAL TIME COORDINATION OF OVERCURRENT RELAYS BY MEANS OF OPTIMIZATION ALGORITHM, realizada por el alumno Meng Yen Shih, matrícula 1609597, sea aceptada para su defensa como opción al grado de Maestro en Ingeniería Eléctrica.
El Comité de Tesis
Asesor
Dr. Arturo Conde Enríquez
Coasesor Dr. Luis Martín Torres Treviño
Vo. Bo.
Dr. Moisés Hinojosa Rivera División de Estudios de Posgrado
Coasesor
© Copyright by CONACYT 2013 All Rights Reserved
DEDICATION
This thesis is dedicated to my parents.
ACKNOWLEDGMENTS
First and foremost, I have to thank my parents for their love and support throughout my life. Thank you both for giving me strength to reach for the stars and chase my dreams. My elder and younger sister and all my family in Taiwan, you deserve my wholehearted thanks as well.
I would like to sincerely thank my supervisor, Dr. Arturo Conde Enríquez, for his advice, guidance, insightful criticisms, and patient encouragement aided the writing of this thesis in innumerable ways. I would also like to thank all my teachers who taught and educated me in this master’s program, Dr. Manuel Andrade Soto, Dr. Gina María Idárraga Ospina, Dr. Miguel Francisco Escalante Guitierrez, Dr. Jose Antonio De La O Serna, MSc. Luis David Aréchiga Rodríguez.
Also thanks to Dr. Arturo Román Messina and Dr. Ernesto Vázquez Martínez for the acceptance in the scientific summer program 2009 and 2010 (XIX and XX Verano de la Investigación Científica, Academia Mexicana de Ciencias), without these participations I wouldn't have known the schools and accumulate enough courage therefore to assist this postgraduate program.
Thanks to my postgraduate friends, Miguel Jacobo, Luis Trujillo, Carlos Castillo, Mario González, Fernando Salinas, Daniel Guillen, Erika Tejada,Fernando Sanchez, Luis Alfaro, Raúl Tokayo, Raúl Aguirre, Alexander Cruti, Cutberto Conejo, Cesar Ochoa, Mario Lopez, Allan Soriano, Daniel Rivas, Miguel Flores, Omar Donjuan, Ruben Hernandez and especially Jorge Eduardo and Gustavo González who kindly helped in many areas.
Thanks to Consejo Nacional de Ciencia y Tecnología (CONACYT) for supporting me financially throughout the masters program.
Thank you Lord for everything, for accompany me and for teaching me, I shall glory your name and act according to your will till the end.
ABSTRACT
Eng. Meng Yen Shih,Instituto Tecnológico De Chetumal (2006-2010) Candidate for the degree:
"Master of Science in Electrical Engineering with Orientation in Electrical Power System"
Universidad Autónoma de Nuevo León Facultad de Ingeniería Mecánica y Eléctrica
Thesis title:
REAL TIME COORDINATION OF OVERCURRENT RELAYS BY MEANS OF OPTIMIZATION ALGORITHM
Directed by: Professor Arturo Conde Enríquez
ABSTRACT:
Sub-transmission and distribution systems are the most numerous and dynamic parts of the entire power system. Hence economic and robust protection scheme must be implemented. The directional overcurrent relay (DOCR) is the ideal solution to this problem. Despite of its simple operation scheme, it is very complicated when the coordination of DOCRs involves short circuit currents and load demands of huge difference in the interconnected system. But the nature of the sub-transmission and distribution systems cannot be avoided. Therefore, this time consuming task which is traditionally done as manual labor should be replaced by computational resources. The computational resources here refer to optimization algorithms.
As it was mentioned before, the distribution system is numerous and dynamic. In other words, it is complicated and changes unpredictably as time goes by, so an efficient algorithm is indeed needed to face this challenge. The word "efficient" here means to encounter quality relay settings in a reasonable computational time.
The objective of this thesis is to coordinate the protections on a real time basis (online), which is very different from all reported literatures of coordination because such literatures coordinate off line and on fixed networks. This novel idea of "Real Time Coordination" is studied based on the idea of enhancing sensitivity and operation time of DOCRs.
Conventionally, relay settings are not reset every now and then; it depends on the complexity of the system. In radial or industrial systems there may be more resetting frequency. But in a meshed system, re-coordination of DOCRs is a very rare practice, they are often done locally. Therefore, this lead to big advantage of the "Real Time Coordination" compared to conventional practice. As load flow changes drastically from winter to summer and vice versa, relays can be coordinated with the latest system information which enhances sensitivity and operation time of DOCRs. There would also be a significant benefit if DOCRs are re-coordinated every 15 minutes.
In order to accomplish the objective, three algorithms are studied and compared. The Genetic Algorithm (GA) because of its widely implementation and well known fame in the protection area was taken as comparison reference. On the contrary, Ant Colony Optimization (ACO) and Differential Evolution (DE) are unknown algorithms in the protection area. But the ACO has been used lately in different studies such as reactive power flow planning, power flow economic dispatch, power generation scheduling, and has reported to be a powerful tool in solving complex problems in different areas. The DE has not yet been used in any power analysis, but it is reported to be very efficient in different areas [17]. Their advantages and disadvantages are reported and documented, and the outstanding algorithm was selected.
As the optimization algorithm coordinates the DOCRs, the real time algorithm updates entrance data (network topology, contingency load flow currents, and fault currents) for the optimization algorithm. This was developed to monitor the network operation; it is assumed that the hardware has already been manufactured and that the hardware just needs the installation of an appropriate real time algorithm.
The main contribution of this thesis is the comparison of the three algorithms and the development of the real time algorithm. It is demonstrated that sensitivity and operation time were enhanced using real time coordination.
The IEEE 14 and 30 bus systems are used as test systems.
The principal objective of this thesis is to develop the "Real Time Coordination Algorithm". The criteria of implementation or application are not considered as part of this thesis but are briefly described.
TABLE OF CONTENTS
Page
ACKNOWLEDGMENTS ... vi
ABSTRACT ... vii
LIST OF TABLES ... xiii
LIST OF FIGURES ... xvi
1. CHAPTER 1 INTRODUCTION ... 1 1.1 Introduction ... 1 1.2 State of Art ... 2 1.2 Justification ... 4 1.3 Objective ... 5 1.4 Hypothesis ... 6 1.5 Thesis Structure ... 6
2. CHAPTER 2 DIRECTIONAL OVERCURRENT RELAY PROTECTION ... 8
2.1 Introduction ... 8
2.2 Objectives of Protection Schemes ... 9
2.2.1 Sensitivity ... 9 2.2.2 Selectivity ... 10 2.2.3 Reliability ... 10 2.2.4 Speed ... 10 2.2.5 Simplicity ... 11 2.2.6 Economic ... 11
2.3 Directional Overcurrent Relay ... 11
2.3.1 Indicator of Fault Locations ... 12
2.3.2 Direction of Relays ... 13
2.3.3 Primary and Backup Relays ... 14
2.3.4 Relay Characteristic Curve ... 15
2.3.4.1 Effects of Relay Parameters ... 17
2.4 Coordination of Directional Overcurrent Relays ... 18
2.4.1 Procedure of Manual Coordination ... 20
2.5 The Need of Real Time Coordination of Directional Overcurrent Relays ... 23
2.5.1 Effect of Input/output of Generators. ... 24
2.5.2 Effect of Input/output of Distribution Lines. ... 27
2.5.3 Effect of Increase/decrease of Load Demands. ... 30
2.6 Conclusion ... 31
3. CHAPTER 3 REAL TIME COORDINATION OF PROTECTIONS USING OPTIMIZATION ALGORITHMS ... 32
3.1 Introduction ... 32
3.2 Real Time Coordination of Protections ... 33
3.2.1 Introduction ... 33
3.3 Objective Function of the Optimization Algorithms ... 37
3.4 Coordination of Protections using Genetic Algorithm... 39
3.4.1 Introduction ... 39
3.4.2 Basic Description of Genetic Algorithm ... 39
3.4.3 Steps of Protection Coordination using Genetic Algorithm ... 41
3.4.4 Initial Population ... 41
3.4.5 Selection ... 42
3.4.6 Reproduction ... 46
3.4.7 Mutation ... 47
3.5 Coordination of Protections using Ant Colony Algorithm ... 49
3.5.1 Introduction ... 49
3.5.2 Basic Description of Ant Colony Algorithm ... 50
3.5.3 Steps of Protection Coordination using Ant Colony Algorithm ... 53
3.5.4 AS-graph ... 53
3.5.5 Pheromone Matrix ... 55
3.5.6 Transition Rule ... 57
3.5.7 Pheromone Updates ... 59
3.5.7.1 Local Pheromone Update ... 59
3.5.7.2 Global Pheromone Update ... 60
3.5.8 Intelligent Exploration... 61
3.6 Coordination of Protections using Differential Evolution Algorithm ... 62
3.6.1 Introduction ... 62
3.6.2 Basic Description of Differential Evolution Algorithm ... 63
3.6.3 Steps of Protection Coordination using Differential Evolution Algorithm ... 64 3.6.4 Initial Population ... 65 3.6.5 Trigonometric Mutation ... 66 3.6.6 Binomial Crossover/Recombination ... 68 3.6.7 Selection ... 68 3.7 Conclusion ... 69
4. CHAPTER 4 EVALUATION AND COMPARISON AMONG THE ALGORITHMS IN IEEE TEST SYSTEMS ... 71
4.1 Introduction ... 71
4.2 Real Time Coordination and Comparison of Algorithms: GA, ACO and DE ... 72
4.2.1 Parameter Settings and Test System Data ... 72
4.2.1.1 Parameter Settings ... 72
4.2.1.2 Test System Data ... 73
4.2.2 Results and Comparison ... 75
4.2.2.1 Case 1 ... 75
4.2.2.2 Case 2 ... 77
4.2.2.3 Case 3 ... 79
4.2.2.5 Comparison and Conclusion ... 85
4.3 Real Time Coordination using DE ... 89
4.3.1 Parameter Settings and Test System Data ... 89
4.3.1.1 Parameter Settings ... 89
4.3.1.2 Test System Data ... 90
4.3.2 Results and Analysis ... 92
4.3.2.1 Case 1 ... 92 4.3.2.2 Case 2 ... 93 4.3.2.3 Case 3 ... 95 4.3.2.4 Case 4 ... 96 4.3.2.5 Case 5 ... 98 4.3.2.6 Case 6 ... 99
4.3.2.7 Analysis and Conclusion ... 101
4.3.2.8 Implementation Criteria ... 106
4.4 Conclusion ... 107
5. CHAPTER 5 CONCLUSION AND RECOMMENDATIONS FOR FUTURE WORK ... 109
5.1 Introduction ... 109
5.2 Summary and General Conclusion ... 109
5.3 Good Coordination Practice and Highlighted Experiences ... 109
5.4 Contributions ... 112
5.5 Recommendations for Future Work ... 113
6. BIBLIOGRAPHY ... 115
7. APPENDIX A ... 118
Radial Coordination ... 118
Mesh Coordination ... 122
LIST OF TABLES
Table Page
Table 2.1: IEEE standard constants. ... 17
Table 2.2: Consequences affecting DOCRs' settings. ... 23
Table 4.1: Parameter settings of GA, ACO and DE. ... 72
Table 4.2: Comparison of averaged results of GA, ACO and DE at maximum load. ... 76
Table 4.3: Averaged relay settings, operation time, CTI and sensitivity of GA, ACO and DE for 14 bus test system at maximum load. ... 77
Table 4.4: Comparison of averaged results of GA, ACO and DE at minimum load. ... 78
Table 4.5: Averaged relay settings, operation time, CTI and sensitivity of GA, ACO and DE for 14 bus test system at minimum load. ... 79
Table 4.6: Comparison of averaged results of GA, ACO and DE at minimum load, considering DOCRs as protections for transformers. ... 81
Table 4.7: Averaged relay settings, operation time, CTI and sensitivity of GA, ACO and DE for 14 bus test system at minimum load, considering DOCRs as protections for transformers. ... 82
Table 4.8: Parameter settings of GA, ACO and DE. Open range search. ... 83
Table 4.9: Comparison of averaged results of GA, ACO and DE at minimum load. Open range dial simulation. ... 84
Table 4.10: Averaged relay settings, operation time, CTI and sensitivity of GA, ACO and DE for 14 bus test system at minimum load. Open range dial simulation. ... 85
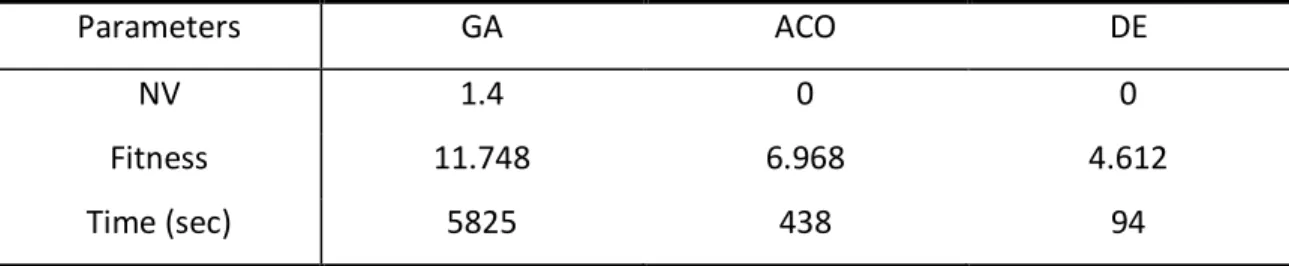
Table 4.11: Averaged execution time of GA, ACO and DE for the 4 cases. ... 86
Table 4.12: Averaged fitness of GA, ACO and DE for the 4 cases. ... 86
Table 4.13: Averaged number of violations of GA, ACO and DE for the 4 cases. ... 87
Table 4.15: Simulation result of DE of IEEE 30 bus system operating at maximum
load. ... 93 Table 4.16: Averaged relay settings, operation time, CTI and sensitivity of DE for
30 bus test system at maximum load. ... 93 Table 4.17: Simulation result of DE of IEEE 30 bus system operating at minimum
load. ... 94 Table 4.18: Averaged relay settings, operation time, CTI and sensitivity of DE for
30 bus test system at minimum load. ... 95 Table 4.19: Simulation result of DE of IEEE 30 bus system operating at minimum
load with n-1 contingency of line [1 2 2]. ... 96 Table 4.20: Averaged relay settings, operation time, CTI and sensitivity of DE for
30 bus test system at minimum load. ... 96 Table 4.21: Simulation result of DE of IEEE 30 bus system operating at minimum
load with output of G2 and input of G3. ... 97 Table 4.22: Averaged relay settings, operation time, CTI and sensitivity of DE for
30 bus test system at minimum load with output of G2 and input of
G3. ... 98 Table 4.23: Simulation result of DE of IEEE 30 bus system operating at maximum
load with increment of load on bus 30 of 15MW. ... 99 Table 4.24: Averaged relay settings, operation time, CTI and sensitivity of DE for
30 bus test system at maximum load with increment of load on bus
30 of 15MW. ... 99 Table 4.25: Simulation result of DE of IEEE 30 bus system operating at maximum
load with increment of line between buses 1 and 3. ... 100 Table 4.26: Averaged relay settings, operation time, CTI and sensitivity of DE for
30 bus test system at maximum load with increment of line between
buses 1 and 3. ... 101 Table 4.27: Results comparison of the 30 bus test system of DE operating at
maximum (case 1) and minimum (case 2) load. ... 102 Table 4.28: Comparison of number of coordination pairs. ... 103 Table 4.29: Results comparison of the 30 bus test system of DE operating at
Table 4.30: Pickup current with contingency analysis before the increment of
load at bus 30. ... 104 Table 4.31: Load current without contingency analysis after the increment of
load at bus 30. ... 105 Table 4.32: Results comparison of the 30 bus test system of DE operating at
maximum load (case 1) with increment of line between buses 1 and 3. ... 105 Table 4.33: Sensitivity before the newly constructed line between buses 1 and 3. ... 106 Table 4.34: Sensitivity after the newly constructed line between buses 1 and 3. ... 106
LIST OF FIGURES
Figure Page
Figure 2.1: Indicator of fault locations: . ... 12
Figure 2.2: Relays and . ... 13
Figure 2.3: Direction of Relays. ... 14
Figure 2.4: Primary and backup relays. ... 15
Figure 2.5: Primary and backup of relays. ... 15
Figure 2.6: Effect of parameters , , , . ... 17
Figure 2.7: Coordination of DOCRs in a radial system. ... 18
Figure 2.8: Coordination of DOCRs in a ring fed system... 19
Figure 2.9: Effect input/output of Generators. ... 24
Figure 2.10: Effect input/output of Generators. ... 26
Figure 2.11: Effect of input/output of Distribution Line. ... 27
Figure 2.12: Effect of input/output of Distribution Line. ... 29
Figure 2.13: Effect of increase/decrease of Load Demands. ... 30
Figure 3.1: Flow Diagram of Real Time Coordination. ... 34
Figure 3.2: Detailed Flow Diagram of Real Time Coordination. ... 35
Figure 3.3: Chromosome. ... 40
Figure 3.4: Roulette Wheel Selection. ... 43
Figure 3.5: Comparison of Roulette Wheel and Rank Selection. ... 45
Figure 3.6: Reproduction. ... 46
Figure 3.7: Reproduction. Simple Arithmetic Recombination. ... 47
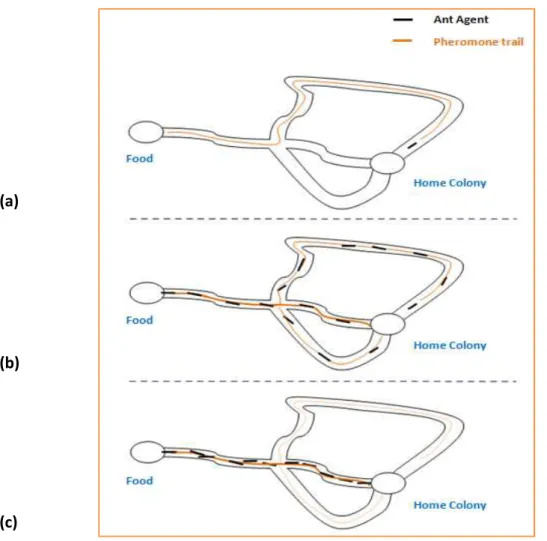
Figure 3.9: Natural behavior of Ants. ... 51
Figure 3.10: AS-graph. ... 55
Figure 3.11: Pheromone Matrix. ... 57
Figure 3.12: Transition Rule ... 58
Figure 3.13: Main stages of the DE algorithm. ... 63
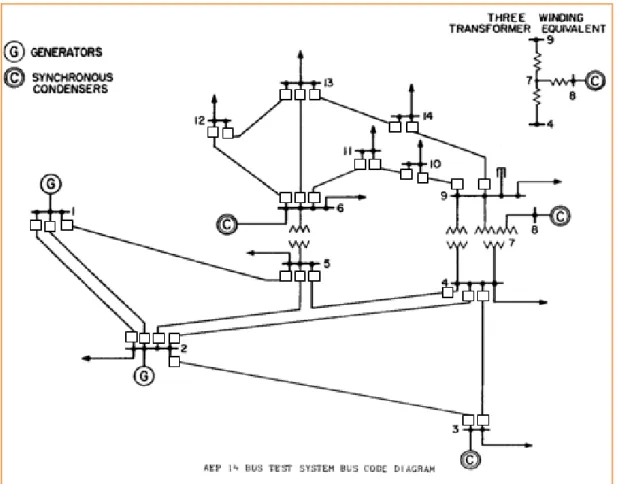
Figure 4.1: IEEE 14 bus test system... 74
Figure 4.2: Averaged fitness convergence of the 14 bus test system of GA, ACO and DE in ten simulations operating at maximum load. ... 76
Figure 4.3: Averaged fitness convergence of the 14 bus test system of GA, ACO and DE in ten simulations operating at minimum load. ... 78
Figure 4.4: IEEE 14 bus test system. Considering DOCRs as protections for transformers. ... 80
Figure 4.5: Averaged fitness convergence of the 14 bus test system of GA, ACO and DE in ten simulations operating at minimum load, considering DOCRs as protections for transformers. ... 81
Figure 4.6: Averaged fitness convergence of the 14 bus test system of GA, ACO and DE in five simulations operating at minimum load. Open range dial simulation. ... 84
Figure 4.7: Overall performance of GA, ACO and DE... 87
Figure 4.8: IEEE 30 bus test system... 91
Figure 4.9: Fitness convergence of the 30 bus test system of DE operating at maximum load. ... 92
Figure 4.10: Fitness convergence of the 30 bus test system of DE operating at minimum load. ... 94
Figure 4.11: Fitness convergence of the 30 bus test system of DE operating at minimum load with n-1 contingency of line [1 2 2]. ... 95
Figure 4.12: Fitness convergence of the 30 bus test system of DE operating at minimum load with output of G2 and input of G3. ... 97
Figure 4.13: Fitness convergence of the 30 bus test system of DE operating at
maximum load with increment of load on bus 30 of 15MW. ... 98 Figure 4.14: Fitness convergence of the 30 bus test system of DE operating at
1. CHAPTER 1 INTRODUCTION
1.1 Introduction
Protection is widely used in all different voltage levels of the electrical power system: generation, transmission, sub-transmission and distribution etc. An overcurrent relay is a protection that is widely implemented in the sub-transmission and distribution systems due to its competing cost. Depending on the operative conditions and fault locations in a mesh system, the load or fault currents can circle in or out of the overcurrent relay's protective zone. Hence directional overcurrent relays are used to discriminate whether the fault is located in or out of the protective zone. The propose of coordinating the overcurrent relays is to encounter settings that minimize the operation time for faults within the protective zone and at the same time offering pre-specified timed backup for relays that are in the adjacent zones. So the maximum fault current that the relay detects in its protective zone must be greater than the fault currents in the adjacent zones. The above condition is met in radial systems, one source mesh systems and two source mesh systems where the sources are located symmetrically at the end. But the above condition is not always met in the multi-source mesh systems due to the numerous operative configurations. Since the systems cannot operate in the absence of protection, other protection principles must be used, i.e. impedance relay. It is then said that for certain operative configurations of mesh system, overcurrent protection principle is out of range or in other words reaches the limit of its protection principle [1].
Coordinating the overcurrent relays in the distribution systems is to meet the fundamental requirements of sensitivity, selectivity, reliability and speed [18], which the main objective is to satisfy clients need.
But due to the growing demand of electrical power, new lines and contracts are constructed and signed. This adds another dynamic factor to the dynamic distribution system. So the coordination becomes more difficult.
Coordinating the overcurrent relays by means of a real time optimization algorithm lead us to better results such as: faster fault extinction, lower possibility of false tripping operation and also lower index of fault extinction delay at different seasons of the year.
1.2 State of Art
Although DOCRs have nonlinear characteristic curves (nonlinear function), the coordination is carried out as a linear problem. This is because the coordination of a pair of relays is performed based on one point, which is the maximum coordination current of the pair of relays. Therefore, the relays guarantee coordination at this point; however, there may be a loss of coordination for faults that are located far from this point.
Over the past decades, manual coordination of DOCRs has been the most common practice performed by protection experts. However, due to its complexity and nonlinearity, manual coordination has been formulated as an optimization problem. Several optimization methods have been proposed to attack this problem. Coordination of DOCRs in the frame of deterministic optimization theory using linear programming (LP) was an approach first reported in 1988. The problem was presented as a linear function in which dials were computed for given values of pickup currents [2]. LP was then studied more for this problem due to its simplicity [3], [4].
Heuristic methods, such as the genetic algorithm (GA) and particle swarm optimization (PSO) [5] of the artificial intelligence (AI) family have quickly gained popularity in solving coordination problems [6], [7], [8], [9]. GA has been frequently reported in different literatures due to its simplicity, robustness and easy implementation. This algorithm is based on the evolutionary ideas of natural selection of genes which consist of selection, reproduction and mutation. In this case, the problem was presented as a nonlinear function in which both the dial and the pickup
current parameters were computed.
Recently, hybrid methods have also arisen in solving coordination problem. Their main attractions are the reduction of search space, execution time and the number of iterations required in encountering the solution. The hybrid GA and mixed PSO are newly developed methods that are combined with LP, in which their search space are drastically reduced by encoding only the pickup currents as input variable strings, leaving the dials as task for LP to solve [10], [11]. In other words, these hybrid methods solve coordination problems by the linearization of the relay function.
Coordination of DOCRs considering different network topologies has been reported in different occasions [10], [21], [22]. A set of relay settings are encountered which will satisfy the coordination constraints of different cases of the network topology. On the other hand, the real time coordination proposed in this thesis is not to find a set of relay settings that will satisfy the coordination constraints of different cases of the network topology, but to re-coordinate all DOCRs for every change of network topology. The advantages by doing so are minimum relay operation time, increment of sensitivity, and the ability to withstand another unknown contingency. Moreover, the idea is to coordinate DOCRs online, which as a result enhances in meeting the fundamental requirements of the DOCRs.
The Ant Colony Optimization (ACO) has not been implemented in the coordination study but has lately been used for the study of reactive power flow planning [13], power flow economic dispatch [14], power generation scheduling [15], and has reported to be a powerful tool in solving complex problems in different areas [16]. The advantage of this algorithm compared to GA is the role of global memory played by pheromone matrix which leads to better and faster solution convergence.
The Differential Evolution (DE) is a family of the Evolutionary Algorithm (EA). But compared to most other EAs, DE is much more simple and straightforward to implement. Main body of the algorithm takes four to five lines to code in any programming language. The DE is studied and compared with other algorithms, the gross performance of the DE in terms of accuracy, convergence speed, and robustness
makes it very attractive for applications to real-world optimization problems, where finding an approximate solution in reasonable amount of computational time is much weighted [17].
Hence, it is a novel idea in this thesis to formulate the coordination problem using ACO and DE. The GA, which is widely known in the coordination area, is used as the comparison reference.
1.2 Justification
DOCRs are the simplest and cheapest, but they are the most difficult to apply and the quickest to need re-setting as system changes. Coincidentally, they are mostly implemented in the distribution network, which is the most dynamic part of the whole power system. Consequently, these dynamic changes affect their sensitivity and selectivity, which cause inappropriate operations. However, due to the fact that DOCRs need to meet the fundamental requirements of sensitivity, selectivity, reliability and speed [12], coordination on a real time basis is proposed in this paper. Moreover, the idea is to coordinate DOCRs online which as a result enhances in meeting the fundamental requirements mentioned above. The developed real time algorithm first updates data from the latest changes of the system, and then computes load flow and fault analysis in order to obtain input data for the optimization algorithms.
In a more detailed way speaking, nowadays primary and secondary DOCRs are coordinated according to the maximum three phase short circuit currents and fixed maximum load currents in the system. As system is perturbed, the use of a fixed maximum load current as reference for coordination can usually cause a fault extinction delay or simply no fault extinction when the actual fault current is below the reference current.
The fault extinction time, correct/false tripping operations of each relay directly impact the fundamental requirements of sensitivity, selectivity, simplicity, reliability,
speed and economic. These fundamental requirements were established to meet the desired index of power supply's continuity. And since the utility measures the continuity in monetary values the protections must carry out its function meeting those requirements.
While DOCRs operate as fast and accurate as possible, the primary instruments (transformers) have longer lifetime. Because one shall not forget that the damage of transformers are not reversible but cumulative. Also the enhancement of voltage quality is an important matter.
1.3 Objective
Objective:
Develop a real time algorithm which takes all the changes of elements and network operation into account for coordinating the overcurrent relays.
This algorithm will be gathering all the latest data (Ybus) such as power system's topology and status of the shunt elements (loads and compensators). In this way, the relays will always be updated with the latest reference current data according to the latest Ybus. Bear in mind that even though there might be no fault occurrence in the network (no change of power system topology), the reference current varies constantly due to the natural power demand curve which differs from hour to hour of the day and season to season of the year.
Methodology:
Develop an algorithm which carries out the real time updates of the network topology (Ybus) and another algorithm which carries out the coordination of overcurrent relays by an optimization method.
First, the system's data is updated according to elements and network changes. Then, the Ybus is constructed or modified from the obtained data using the Incident method and the inverse of Inspection method. Next, both lists of “Relay Names” and
“Coordination Pairs” are generated automatically. After that, the load flow analysis is run using the Newton Raphson or another method. Then, the Zbus is constructed or modified by the Block construction method and Partial Inversion Motto. Finally, fault analysis is run using Thevenin's method or Symmetrical Components [18].
Algorithm validation using academic or real network as testing system.
1.4 Hypothesis
The automatic and online re-setting of DOCRs according to the dynamic operations of the electrical system permits the reduction of fault extinction time (relay operation time), the increment of sensitivity, and the ability to tolerate another contingency.
1.5 Thesis Structure
This thesis is divided in five chapters. In chapter one, general introduction, preliminary ideas, hypothesis, objective, coordination problems and difficulties are presented in order to evaluate and sort out the problem.
Chapter two presents the general idea of Directional Overcurrent Relays (DOCRs), theoretical ideas of their fundamental requirements, direction of relays, the relay characteristic curves and effects of each relay parameter, steps of manual coordination of DOCRs, and description of the need of real time coordination. This is to get a closer view of the coordination problem so as to be able to focus on it.
Chapter three presents the coordination of DOCRs on a Real Time basis using optimization algorithms. The coordination problem is formulated as optimization problems using three algorithms: Genetic Algorithm (GA), Ant Colony Optimization (ACO) and Differential Evolution (DE). Basic ideas and detailed description of the algorithms are presented. Gaining knowledge about optimization is very necessary
because the most suitable algorithm will be chosen to work hand in hand with the Real Time algorithm.
Chapter four presents the implementation of three algorithms in different cases using the IEEE 14 bus test system. Their speed, result quality, robustness and convergence are evaluated, compared and documented. The outstanding algorithm was chosen and implemented in the IEEE 30 bus test system where the idea of Real Time Coordination is carried out to see whether the hypothesis is correct or wrong.
Chapter five presents the general conclusion of the developed work, highlighted experiences, principal contributions of this thesis, and a list of recommendations for future work.
2. CHAPTER 2 DIRECTIONAL OVERCURRENT RELAY PROTECTION
2.1 Introduction
Lines are protected by overcurrent, distance, or pilot relays, depending on the requirements. Overcurrent relay is the simplest and cheapest, the most difficult to apply, and the quickest to need readjustment or even replacement as a system changes. It is generally used for phase and ground fault protection on station service and distribution circuits in electric utility and in industrial systems, and on some sub- transmission lines where the cost of distance relay cannot be justified. It is also used for primary ground fault protection on most transmission lines where distance relays are used for phase faults, and for ground backup protection on most lines having pilot relaying for primary protection.
It is generally the practice to use a set of two or three overcurrent relays for protection against inter-phase faults and a separate overcurrent relay for single phase to ground faults. Separate ground relays are generally favored because they can be adjusted to provide faster and more sensitive protection for single phase to ground faults than the phase relays can provide. However, the phase relays alone are sometimes relied on for protection against all types of faults. On the other hand, the phase relays must sometimes be made to be inoperative on the zero phase sequence component of ground fault current.
Overcurrent relay is well suited to distribution system protection for several reasons. Not only is overcurrent relay basically simple and inexpensive but also these advantages are realized in the greatest degree in many distribution circuits.
In electric utility distribution circuit protection, the greatest advantage can be taken of the inverse time characteristic because the fault current magnitude depends mostly on the fault location and is practically unaffected by changes in generation or in the high voltage transmission system. Not only may relays with extremely inverse curves be used for this reason but also such relays provide the best selectivity with fuses and
reclosers. However, if ground fault current magnitude is severely limited by neutral grounding impedance, as is often true in industrial circuits, there is little or no advantage to be gained from the inverse characteristic of a ground relay.
2.2 Objectives of Protection Schemes
The fundamental objective of system protection is to isolate a problem area in the power system as soon as possible, so that the impact to the rest of the system is minimized and as much as possible is left intact. There are four basic requirements of a protective relay that one shall take into account: sensitivity, selectivity, reliability and speed. Other factors such as simplicity and economic may be taken into account as well. In this case, the directional overcurrent relay should satisfy all or most of the four basic requirements.
2.2.1 Sensitivity
Sensitivity is the capability of a relay to respond to a minimum fault in the adjacent zone. A relay can reduce its sensitivity due to two cases, fault current location in the vertical asymptotic region or fault current is too close to pickup current. For the first case, one shall bear in mind that there are two asymptotic regions in the relay characteristic curve. The first asymptotic region is vertical, in which operation time is increased exponentially for any fault that occurs in this region, and the second asymptotic region is horizontal, in which operation time is minimum and constant for any fault that occurs in this region. So if a fault is located nearby or in the vertical asymptotic region its sensitivity reduces or losses. For the second case, as fault current tends to be equal to pickup current or vice versa, the operation time increases. Hence sensitivity is reduced or even lost.
2.2.2 Selectivity
Selectivity, which is also known as relay coordination, is the process in which the settings of the relays allow the relays to operate as fast as possible for faults within their primary zone, but have delayed operation in their backup zone. Consequently, selectivity or relay coordination is important to assure maximum service continuity with minimum system disconnection.
2.2.3 Reliability
Reliability has two important aspects, dependability and security. Dependability is defined as "the degree of certainty that a relay or relay system will operate correctly" (IEEE C 37.2). Security "relates to the degree of certainty that a relay or relay system will not operate incorrectly" (IEEE C37.2). In other words, dependability indicates the ability of the protection system to perform correctly when required, whereas security is its ability to avoid unnecessary operation during normal day-after-day operation, and faults and problems outside the designated zone of operation. Thus, the protection must be secure (not operate on tolerable transients), yet dependable (operate on intolerable transients and permanent faults) [12].
2.2.4 Speed
It is one of the objectives that the protection isolates the trouble zone as rapidly as possible. But even though a zero-time or very high speed protection is desirable, it may result in an increased number of undesired operations. As a broad generality, the faster the operation, the higher the probability of incorrect operation. So, a very small amount of time always remains as one of the best means of distinguishing between tolerable and intolerable transients.
2.2.5 Simplicity
A protective relay system should be as simple and straightforward as possible while still accomplishing its intended goals. For every added unit which may enhance the protection scheme should be considered very carefully whether it is or not a basic need of the protection requirements. Because each added unit provides a potential source of trouble and added maintenance, therefore, more probability of failure operations. An incorrect operation may cause a catastrophic problem in the power system.
2.2.6 Economic
As cost is always a major factor, it is fundamental to obtain the maximum protection for the minimum cost. The cost of a protection scheme is relatively high, but it should not be evaluated alone due to the primary equipments it is protecting and cost of an outage through an improper protection. So one shall not save the cost of a protection scheme since it might result to a larger expense which is to repair or replace primary equipments damages.
2.3 Directional Overcurrent Relay
The directional overcurrent relays (67) are designed to sense the actual operating conditions on an electrical circuit and trip circuit breakers when a fault is detected. Phase relationship of voltage and current are used to determine the direction to a fault [19]. The relay first discriminates whether the fault is located in front of or behind the relay. If the fault is located behind the relay, then no operation will take place. But if the fault is located in front of the relay, a comparison of fault magnitude
and reference current will take place in order to make the decision whether to operate or not.
2.3.1 Indicator of Fault Locations
The exceeding of actual sensed current from the reference current ( ) is called fault or short circuit current ( ). It is an indicator used to identify the fault location. But the fault current depends on the pre-fault voltage and Thevenin's impedance at the fault point (distance). The further the fault is located from the source the bigger the impedance between the fault and the source, therefore, the smaller the fault magnitude.
Figure 2.1: Indicator of fault locations: .
It is illustrated in Figure 2.1 that the fault F1 which is located nearby bus 2 has a fault magnitude of 13,000 A while fault F2 located nearby bus 3 has a fault magnitude of 9,000 A. The fault is an indicator that indirectly reveals the fault location depending on its magnitude. As pre-fault voltage drops away from 1 per unit, the smaller the fault magnitude becomes. Fault F1 is greater than F2 because it is closer to the source thus has smaller impedance from source to fault point than F2.
Figure 2.2 illustrates the idea that relays sense the same fault magnitude. Fault
F1 which is located immediately after bus 2 has a fault magnitude of 11,000 A while fault F2 which is located nearby bus 3 has a fault magnitude of 9,000 A. Both relay A and B see the same fault magnitude for faults F1 and F2. This is very important, as this concept is latterly used in coordination of overcurrent relays in a radial system. Keep in mind that there are occasions when the primary and backup relays sense different fault magnitudes. This is due to infeed effect and will be presented afterwards.
Figure 2.2: Relays and .
Note that faults F1 and F2 in Figure 2.1 and Figure 2.2 are not simultaneous and the relays used are non-directional due to the reason that they are in a radial system.
2.3.2 Direction of Relays
The directional overcurrent relays will only operate for events "in front of" them and do not operate for events "behind" them. They are used in mesh systems in order to discriminate the fault location. On the contrary, non-directional overcurrent relays are commonly used in radial systems.
When the current is not in the direction of the relay it will not be seen, thus no operation will ever take place. The Figure 2.3 illustrates that relays A and D sense the load flow current while relays B and C do not because they are in opposite direction of
the load flow current. If by any means, there was a fault located between relays C and D; relays A, C and D will see the fault and relay B won't because the fault is located behind B. Similarly, if there was a fault located between relays A and B, relays A, B and D will see the fault and relay C won't because the fault is located behind C.
Figure 2.3: Direction of Relays.
2.3.3 Primary and Backup Relays
The directional overcurrent relay is a relative selectivity protection, in other words, these relays can be coordinated, and they can function as primary (principal) and also as secondary (backup) protection as desired. A primary relay is the protection that should operate with minimum time to extinct a fault. Meanwhile a backup relay is the protection that will operate with a pre-specified time delay to extinct a fault when the primary relay fails.
For fault F1 illustrated in Figure 2.4, relay C functions as primary while relay A functions as backup for relay C, they both see the fault contribution of source 1. On the other hand, relay D functions as primary for the fault contribution of source 2. Note that relay B does not see the fault due to the reason that the fault is situated behind relay B.
Figure 2.4: Primary and backup relays.
For fault F2 illustrated in Figure 2.5, relay B functions as primary while relay D functions as backup for relay B, they both see the fault contribution of source 2. On the other hand, relay A functions as primary for the fault contribution of source 1. Note that relay C does not see the fault due to the reason that the fault is situated behind relay C.
Figure 2.5: Primary and backup of relays.
2.3.4 Relay Characteristic Curve
The relays function accordingly to the relay characteristic curve (inverse time curve). This so called inverse time curve operates with less time as fault magnitude raises and more time as fault magnitude drops. It is given in equation (2.1) IEEE standard norm C37.112-1996.
= ∅ !" #$ %&# ' ( )*+ , ∗ where: = ./ 0 1 /. 1 2/ ∅ !" = 2 3 2 2 ℎ.// ℎ / ℎ1. . ../ = ./ 0 ./5/./ /, , , = 1 15 666 . = 2/
∅ !" is the maximum three phase short circuit current that the relay sees.
is the relay pickup reference current. It is normally between 1.4 to 2 times load current 789:.
is the factor that moves the characteristic curve on the vertical axis to a desired time and current conserving the same inversion grade.
The dial represents the journey of the disk (integral of the velocity with respect to time) in electromagnetic relays. It is also known as TDS dial setting or TMS time-multiplier setting in different literatures.
For the relay to operate, the fault current ( ) must be greater than the reference current ( ). In other words, the operation time is positive as in equation (2.1). While fault current tends to be equal or very close to reference current the operation time increases. On the contrary, the relay will not operate if the fault current ( ) is smaller than the reference current ( ). In other words the operation time is negative as in equation (2.1).
The IEEE constants of the overcurrent relays are shown in Table 2.1. These are the conventional curves: moderate inverse (MI), very inverse (VI) and extremely inverse (EI).
Norm Curve Type A B n
IEEE
Moderate Inverse 0.0515 0.114 0.02
Very Inverse 19.61 0.491 2
Extremely Inverse 28.2 0.1267 2 Table 2.1: IEEE standard constants.
2.3.4.1 Effects of Relay Parameters
The effect of each parameter of equation (2.1) is presented in Figure 2.6:
(a) (b)
(c) (d)
Figure 2.6: Effect of parameters , , , .
The variation of affects the time-current curve by moving the curve left or right as shown in Figure 2.6 (a). The variation of , affect the curvature of the head of the time-current curve as shown in Figure 2.6 (b). The variation of affects the tail of the time-current curve as shown in Figure 2.6 (c). The affects the time-current
curve by moving the curve up or down as shown in Figure 2.6 (d). The different curves resulted by different dials are the curve family.
2.4 Coordination of Directional Overcurrent Relays
"Coordination" can also be known as "selective setting". When the directional overcurrent relays (DOCRs) are implemented on the lines they can offer protection to adjacent lines, buses, transformers, motors etc. The overcurrent relays' settings must ensure that the primary protection has enough time to clear the fault in its protected zone before the backup comes in. A backup device that should not trip "selects" with the downstream device that is close to the fault. The downstream device that is closer to the fault and should trip "coordinates" with the backup device that should not trip. Coordination on feeders or radial lines is the same, except that it moves only in one direction: from the power source to the loads [12]. The idea of coordination of DOCRs in radial system is illustrated in Figure 2.7.
Figure 2.7: Coordination of DOCRs in a radial system.
Coordination a mesh system will be explained using Figure 2.8. Relays R12, R23 and R31 are in clockwise direction. R12 offers backup for R23, R23 offers backup for R31
and R31 offers backup for R12. By doing so the clockwise coordination circle is closed. Meanwhile relays R21, R13 and R32 are in anticlockwise direction. R21 offers backup for R13, R13 offers backup for R32 and R32 offers backup for R21. Then the anticlockwise coordination circle is closed too. Note that each relay functions as primary for faults in its own zone and backup for adjacent zone.
For convenience, the relay names are no longer named with alphabets A, B, C, D as in a radial system but by location of each relay. This is due to the reason that a ring fed system can consist of hundreds of relays, so it will be very advantageous if each relay revels its location in the network. For example, R12 represents relay connected near bus 1 facing bus 2. Similarly, R21 represents relay connected near bus 2 facing bus 1, and so on.
Figure 2.8: Coordination of DOCRs in a ring fed system.
The idea is "to set the protection to operate as fast as possible for faults in its primary zone, and yet delay sufficiently for faults in its backup zones" [12].
Or "the process to decide the sequence of the relay operations for each possible fault location and to provide sufficient coordination margins without excessive time
delay, taking into account the desired protection qualities of selectivity, reliability, sensitivity, and speed".
In a radial system it is recommended to start the coordination from the relay nearest to the load toward the source. On the other hand, there is no such recommendation in a mesh system but arbitrary choose a start point and coordinate the relays. This might result to a bad coordination at the moment closing the mesh system, meaning the last relay which must be coordinated with the first relay that was chosen as start point do not satisfy the coordination idea. In other words, the first relay that was chosen as the start point fails to offer backup for the last relay that was to be coordinated with at the moment of closing the ring fed system. This is very common scenery, so if it happens one must start the coordination all over again from selecting a new start point. As a result, optimization algorithms were implemented to avoid the repetitive and extreme time consumption of coordinating a mesh system. This will be discussed in detail in chapter 3.
2.4.1 Procedure of Manual Coordination
The procedure of manual coordination is presented as followed:
1. Select one of the IEEE conventional curves
Choose one of the following: moderate inverse (MI), very inverse (VI) or extremely inverse (EI). By doing so you will have the constants , and . Other types of curves published by different standards or manufactures may be chosen as well.
2. Propose a dial for the first primary relay
It is recommended to start with a small or the smallest dial available of the relay so that the other relays that come after will not have a big operation time.
3. Calculate operation time of primary relay
; <9;== A B B C D ∅ !" #E$ !EF #$ %&##E$ !EF G ( )* + H I I J ∗ ; <9;=
The three-phase fault current, pickup current and dial of the primary relay will be used in this calculation.
4. Calculate operation time of backup relay
K9 = ; <9;=+ LM
Calculate the backup time by adding a desired and pre-specified CTI to the primary time. The CTI is a pre-specified time called "Coordination Time Interval". It is a controlled time delay of each coordination pair. In that way, whenever the primary relay fails to extinct the fault the backup relay enters and tries to extinct the fault after the pre-specified delay. This CTI is the time summation of breaker operation, over journey of the electro-mechanic relay's disk and a security factor. It is normally between 0.2 and 0.5 seconds, but 0.3 seconds is mostly used. In digital relays, the CTI normally lies between 0.2 and 0.3 seconds.
(2.2)
5. Calculate dial of backup relay K9 = K9 A B B C D ∅ !" N! %&# #$ %&#N! %&# G ( )* + H I I J
The three-phase fault current, pickup current and dial of the backup relay will be used in this calculation.
Steps 3, 4 and 5 are repeated continuously until the coordination task is accomplished while steps 1 and 2 are performed only once at the beginning.
Note that in a radial system with only one source both primary and backup relays sense the same three-phase fault current ( ∅ !" #E$ !EF = ∅ !" N! %&#). But in a mesh system where there are many sources located at different geographic points, the three-phase fault current that the backup sense is sometimes much more smaller than what the primary see ( ∅ !" #E$ !EF ≠ ∅ !" N! %&#). This is called the infeed effect and can often cause mal-coordination (loss of coordination). Hence the reason why it is necessary to specify which three-phase fault current it is in the equations above. The three-phase fault current of the backup relay is called "coordination current". This coordination current is defined as the maximum current that the coordination pair can see.
It is recommended to use the same curve type throughout the coordination process so as to avoid the intersection of time-current curves which might lead to coordination loss. But by using the same curve type throughout the whole coordination process does not guarantee that there will be no loss of coordination, therefore, it is justified to use different types of curves throughout the process as one wish to, due to the reason that they might give better results.
2.5 The Need of Real Time Coordination of Directional Overcurrent Relays
The sub-transmission and distribution systems are the most dynamic part of the power system. The protections directly suffer the consequences of the following changes:
Dynamic changes Consequences (Variation)
Input/output of generators [Ipickup, Isc] Input/output of distribution lines [Ipickup, Isc]
Input/output of loads [Ipickup] Increase/decrease of generation [Ipickup, Isc] Increase/decrease of load demand [Ipickup, Isc] Table 2.2: Consequences affecting DOCRs' settings.
As presented in Table 2.2, the distribution system suffers constant changes. Here are some possible cases that can cause coordination problems to the system:
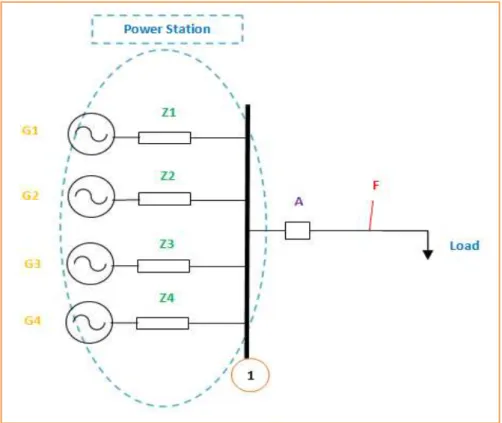
2.5.1 Effect of Input/output of Generators.
Figure 2.9: Effect input/output of Generators.
Figure 2.9 illustrates the effect of system's variation when sources input/output to/from the system. Note that the generators' resistances were neglected. This example illustrates the idea with generators of the same capacity for easier comprehension. But generators of different capacity follow the same logic.
Suppose the load consumes 500 A constantly and that all four generators above are of the same capacity (MVA), then all of them will have the same impedance. P* = PQ=
PR= PS1.T′ * = T′ Q = T′ R = T′ S so each generator will contribute the same
amount of .
Now suppose that each generator contributes 1,000 A . Then for a fault at point
F relay A will see * = 4,000 , contribution of all four generators. This big * is due to: PVWX8:Y* = T′ YZ = [ * \′][^ [ \′]_^ [ \′] ^ [ \′]` =a′:[ S .
Now if G3 and G4 are out of service for maintenance then for a fault at point F
relay A will only sense Q= 2,000 , contribution of only G1 and G2. This Q which is smaller than * is due to bigger PVW on node one: PVWX8:Y* = T′ YZ = [ *
\′][^
[ \′]_
=a′:[
Q .
So if relay A's setting (dial) remained the same as if all generators were in service
= *, then it will operate with more time delay when the fault occurs at point F
with = Q when the actual system is operating with G3 and G4 out of service. This is because Q< *&& Q is closer to than *.
Note: the more a is located to the left of the relay characteristic curve the more time delay it has (proof by observing the relay curve). The closer a is to the more time delay (less sensitive) there will be for the relay to operate (proof by calculating the IEEE relay formula).
For the case that the load current of relay A is 2,500 A instead of 500 A. Then for the example illustrated above, the relay A will simply not function because >
Q. So relay A will never operate.
With Real Time Coordination, the above can be avoided. The relay will get its latest setting according to the latest change of system's power plant. Being that there is a change source's PVW and consequently a change of .
Figure 2.10: Effect input/output of Generators.
Figure 2.10 illustrates the effect of system's variation when sources input/output to/from the system. When we coordinate two relays based on a point ( ∅ !") with a specified CTI, it surely guarantee the coordination of both relays nearby this point. But as further the fault is located from the coordination point ( ∅ !"), the lesser the coordination of this pair of relays is guaranteed. In other words there is possibility of coordination loss on the left hand side of the curves if there is an intersection. This can be observed in the Figure 2.10 (b). By using relay B as reference, the blue arrow indicates a good coordination for faults within its zone while the yellow arrow indicates loss of coordination for faults with minor magnitude.
Faults of minor magnitude are more often to occur than ∅ !" such as: [∅, _∅ etc so it increases the probability of false operation of the relays (loss of coordination) if we use a fixed setting for the relays.
(b) (a)
Note that with Real Time Coordination, the relays will always have the fastest time settings for the latest system's topology and load flow. Hence, the relays will operate faster with better sensitivity and selectivity which consequently increases the voltage quality. While minimizing the duration the better the power quality becomes.
Thus the real time coordination of overcurrent relays must be done in order to fulfill the requirements. An optimization algorithm must be developed to facilitate and improve the process of real time coordination.
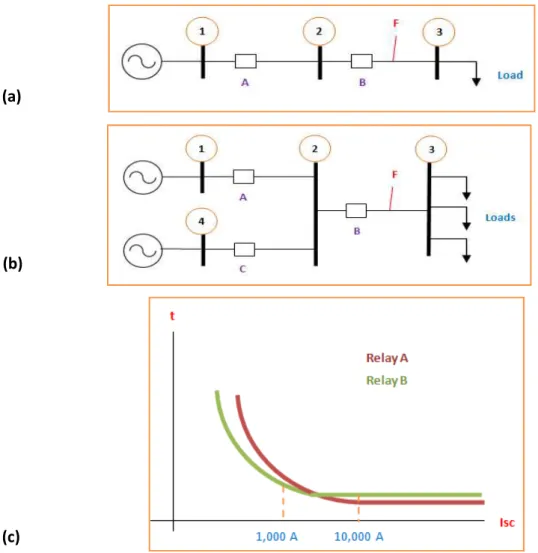
2.5.2 Effect of Input/output of Distribution Lines.
Figure 2.11: Effect of input/output of Distribution Line.
Figure 2.11 illustrates the effect of system's variation when dR is frequently out of service. The doesn't affect in this study because the fault at piont F
has almost the same magnitude with or without dR.
If dQ and dR have the same impedance then they'll have the same 789: flow; if any of them has more impedance than the other, then the 1,000 A of 789: will be distributed more passing the line with smaller impedance and less passing the line with bigger impedance.
Suppose that in this case Pe_ = Pe so 789:e
_ = 789:e which are 500 A and 500 A. Then:
k = ∗ 789:k = g1.5ig500 i = 750
Now, if both dQ and dR are in service most of the time then the established f and k have no problem, but if one of them is out of service frequently, then the other relay must take the value of l because the line left in service will have the same amount of load flow as d*.
If dR is frequently out, then:
f = ∗ 789:f = g1.5ig1,000 i = 1,500
If the above is not taken into account, then whenever dR is out of service, relay B will operate even when there is no fault occurrence. Because dQwill have a load flow of 1,000 A, in other words relay B will see 1,000A. So 789:e
_ = 1,000 > f=
750 .
So this will make relay B operate even though it is just a n-1 contingency, loss of a line which leads to an increment of load flow on the other line.
But now if we set f = 1,500 due to the reason that dR is frequently out of service, the disadvantage will be when both dQ and dR are in service and when a fault
F occurs on dQ, relay B will respond to the fault with a greater time (become less sensitive due to a bigger f).
With Real Time Coordination, the above can be avoided. And all relays are going to be more sensitive because they will get the latest settings every time according to the latest change of the network topology.
Figure 2.12: Effect of input/output of Distribution Line.
Figure 2.12 illustrates the effect of system's variation when dRis suddenly out of service. Suppose that all lines are in service then the relays A, B, C, D are all coordinated according to the ∅ !" that each of them senses.
If dR is suddenly out of service and a fault occured at point F on dS, then the relay D will be sensing less ∅ !" than it normally sees; because when both dQ and dR are in service there's less line impedance between nodes 2 and 3, so ∅ !" was greater.
Under this circumstance the relay D will become slower to operate (less sensitive) or even loss of coordination (loss of relays' selectivity) because relay B might operate before relay D. This is because relay B will see almost the same ∅ !" with or without dR, while relay D will suffer big change/reduction of ∅ !" when dR is out.
2.5.3 Effect of Increase/decrease of Load Demands.
Figure 2.13: Effect of increase/decrease of Load Demands.
Figure 2.13 illustrates the effect of system's variation due to system's constant growing. More loads and sources.
The Figure 2.13 (a) illustrates a radial system that was constructed many years ago. Relays A and B were coordinated according to the fault at point F. ∅ !" =1,000 . Relay A operates as backup for relay B.
Many years after, the simple radial system in Figure 2.13 (a) has now more loads and an additional equivalent source connected to node 2 as shown in Figure 2.13 (b). (a)
(b)
This made the fault at the point F larger. ∅ !" =10,000 . If there were no intersection of curves then there'll be no problem because the effect of increment of
∅ !" will only accelerate the operation of relay B. But according to the example
illustrated in the Figure 2.13 (c), the curves' tails of relays A and B did intersect. This means that there is a loss of coordination (loss of selectivity) so relay A will now operate before relay B. The false operation of relay A leads to no backup relay for relay B.
The use of different types of relay curves in coordination normally leads to intersection of curves. But bear in mind that the example above is to illustrate intersection of curves due to variation and not due to the use of different types of curves. Being that there is a change of .
2.6 Conclusion
Requirements such as sensitivity, selectivity, reliability, speed, simplicity and economic, that a DOCR need to fulfill are presented. The relay shall fulfill as many requirements as possible but due to the different network operations, DOCRs can never fulfill all at once.
Indicator of fault locations for relays, directions of relays, primary and backup of relays, relay characteristic curves and the effects of each parameter are presented. The short circuit current is of great importance for the DOCRs. If the short circuit current (Isc) is too small in certain area of the network, then relays located in that area become insensitive. Under this circumstance, other protection principles must be implemented to replace the absence of DOCRs. DOCRs are implemented in the distribution network in order to discriminate the fault location. If a relay shall offer backup for more than one relay, it can just coordinate with the slowest primary relay, because by doing so, all other primary relays will have backup as well.
Also some examples illustrating the need of real time coordination due to the dynamic operations of the network are presented.
3. CHAPTER 3 REAL TIME COORDINATION OF PROTECTIONS USING OPTIMIZATION
ALGORITHMS
3.1 Introduction
One of the most fundamental principles in our world is the search for an optimal state. For example, biological principle of survival of the fittest [1940] which, together with the biological evolution, leads to better adaptation of the species to their environment. Here, a local optimum is a well-adapted species that dominates all other animals in its surroundings. Homo sapiens have reached this level, sharing it with ants, bacteria, flies, cockroaches, and all sorts of other creepy creatures.
As long as humankind exists, perfection is one of the objectives. People want to reach a maximum degree of happiness with least amount of effort. In the economy, profit and sales must be maximized and costs should be as low as possible. Therefore, optimization is one of the oldest of sciences which even extends into daily life.
Optimization is defined as "finding an alternative with the most cost effective or highest achievable performance under the given constraints, by maximizing desired factors and minimizing undesired ones" [23].
In other words, the goal is to find the values of controllable factors determining the behavior of a system (i.e. a production process, control of robots) that maximize productivity or minimize waste.
Some problems have many solutions while some have only one solution when optimization algorithms are implemented. Thus for complicated problems which have many solutions, one must establish an objective function to evaluate the fitness value of the solution, whether the solution is a global or local best solution.
An objective function is an equation to be optimized given certain constraints and with controllable variables that need to be minimized or maximized. The objective function affects directly the quality of the optimization algorithm in getting a global or local solution. The global best solution is of course the most desirable solution because
it's the setting that will make the process carry out its function to the maximum or minimum. But one must take the simulation time into account and thus satisfy with a
suitable solution. Practice of optimization is restricted by the lack of full information and the lack of time to evaluate what information is available.
Nowadays coordination of overcurrent relays is a very important subject in different networks. On the contrary to other kinds of relays, fuses and reclosers, overcurrent relays coordination has been presented in many methods. As of such techniques are optimal coordination methods that have advantages as compared to common coordination techniques. The operation of relays in network is considered linear and symmetrical attribute of [25]. Whereas that isn't like this and the attributes of and are unknown quantities. Thus the objective function converts this problem into a nonlinear problem.
It is a very time consuming task coordinating hundreds of directional overcurrent relays manually in a meshed distribution system. Besides, for online (real time) coordination a powerful and adequate optimization algorithm must be implemented.
3.2 Real Time Coordination of Protections
3.2.1 Introduction
The coordination of directional overcurrent relays is mostly studied based on fixed network topology in an interconnected mesh power system (IMPS), and is formulated as an optimization problem. In practice, the system is constantly operated in different topologies due to outage of distribution lines, transformers and generating units. There are some situations for which the changes in the network topology or element's operation could cause the protective system to operate without selectivity (loss of coordination). The objective of this thesis is to coordinate all the protections at every moment of element's operation change or network topology change. To