© 2013. Md. Mursalin, Md . Motaher Hossain, Md. Kislu Noman & Md. Shafiul Azam. This is a research/review paper, distributed under the terms of the Creative Commons Attribution-Noncommercial 3.0 Unported License http://creativecommons.org/licenses/by-nc/3.0/), permitting all non-commercial use, distribution, and reproduction inany medium, provided the original work is properly cited.
Global Journal of Computer Science and Technology
Graphics & Vision
Volume 13 Issue 3 Version 1.0 Year 2013
Type: Double Blind Peer Reviewed International Research Journal Publisher: Global Journals Inc. (USA)
Online ISSN: 0975-4172 & Print ISSN: 0975-4350
Performance Analysis among Different Classifier Including Naive
Bayes, Support Vector Machine and C4.5 for Automatic Weeds
Classification
By Md . Mursalin,
Md . Motaher Hossain, Md. Kislu Noman
& Md. Shafiul Azam
Pabna University of Science and Technology
Abstract -
Weeds are often one of the biggest problems encountered by farmer in conventional
agriculture. Maximum productivity of crops can be achieved by proper weeds management. Applying
excessive herbicide uniformly throughout the field has an adverse effect on the environment. An
automated weed control system which can differentiate the weeds and crops from the digital image
could be a feasible solution for this problem. This paper demonstrates Naïve Bayes, SVM (Support
Vector Machine) and C 4.5 classification algorithm for classifying the weeds and investigates the
performance analysis among these three algorithms. In this study 400 sample images over five
species were taken where each and every species contains 80 images. The result has shown that
Naïve Bayes classification algorithm achieve the highest accuracy (99.3%) among these three
classifier.
Keywords :
herbicide, image processing, weed classification, naïve bayes, SVM, C 4.5 classifier.
GJCST-F Classification:
I.5.4
Performance Analysis among Different Classifier Including Naive Bayes, Support Vector Machine and C4.5 for Automatic Weeds Classification
Including Naive Bayes, Support Vector Machine
and C4.5 for Automatic Weeds Classification
Md. Mursalinα, σ, Md. Kislu Nomanρ Md. Shafiul Azam
&
Md. Motaher Hossain Ѡ
Abstract - Weeds are often one of the biggest problems encountered by farmer in conventional agriculture. Maximum productivity of crops can be achieved by proper weeds management. Applying excessive herbicide uniformly throughout the field has an adverse effect on the environment. An automated weed control system which can differentiate the weeds and crops from the digital image could be a feasible solution for this problem. This paper demonstrates Naïve Bayes, SVM (Support Vector Machine) and C 4.5 classification algorithm for classifying the weeds and investigates the performance analysis among these three algorithms. In this study 400 sample images over five species were taken where each and every species contains 80 images. The result has shown that Naïve Bayes classification algorithm achieve the highest accuracy (99.3%) among these three classifier.
Keywords : herbicide, image processing, weed classification, naïve bayes, SVM, C 4.5 classifier.
I.
Introduction
The huge rate of herbicide in the world causes negative impact on the ecological environment and the survival of species. It has also arises some economic concern. In year of 2005, the total estimated cost of applied herbicides was $16 billion in United States [8].
The
main cost ineffective and strategic problems in
herbicides system is that they are applied on the field
uniformly. Generally the volumes of weeds are more in
some specific region but herbicides are still applied
regardless. In addition, applying herbicides manually is
very costly and time consuming. Statistics has been
shown that if same kinds of herbicides are applied
repeatedly for reducing the unwanted weeds then there
is a good possibility that they become tolerant tothose
types of herbicides [6]. Moreover some herbicides
contaminate the ground water even though it applied in
the soil. Thus farmers need more sophisticated
alternative weed control techniques which will reduce
the usages of chemicals and provide safety for the
overallecosystem.
Several researches have been done for
investigating fruitful solution for controlling the weeds
without collapsing down the environment. The machine
vision technique has the ability to differentiate the crops
from weeds so that herbicides can be applied
effectively. In this technique image are captured by a
digital camerafrom different parts of a crop field so that
weedscan be identified properly. Shearer, et al. [10] has
developed a photo sensor plant detection systemwhich
has the ability of detecting and sprayingonly the green
plant. Jiang Zhengrong, et al [7] has proposed
automatic weed identification based on image
processing technology. They have investigated the
spectrum analysis, color identification, texture
assessment for weed identification. In [3], weeds and
crops are classified by SVM and achieved 98% where
using Bayesian classifier achieved 95% accuracy over
224 test images. Weis et al, proposed a sensor related
analysis techniques of weed detection system [14]. In
[12], comparison of different classification algorithms
has been shown for weed detection based on shape
features. For selective herbicideapplication a model has
been proposed [1] with 95% accuracy, which
categorizes images into narrow and broad classes
based on the Histogram Maxima using a thresholding
technique. In [13] calculation of various shape features
foridentifying weeds in digital images has been shown.
Active shape models can identify youngweed seedlings
with the accuracy of 65% to 90%[11].
The aim of this paper is to introduce a model
which will classify weeds and crops from digitalimages
Global Journal of Computer Science and Technology Volume XIII Issue III Version I
11 (DDDDDDDD ) Year 013 2 F
eeds are those unwanted plants which grow in the area not belongs to them and cause more negative impact on economy income. It competes with the crop for resource such as soil, water, sunlight and fertilizer. So the production efficiency and quality of economic crops would decrease when the weeds are out of control. Statistics has been shown that the worldwide estimated potential loss due to all kinds of pests was at 40%-80%; besides them the potential losses for weeds were found 34% which is the highest of all pests [8]. As a result, better weed control system must be deployed to sustain the productivity without hampering the environment. Currently several weed control policies exist e.g. removing weeds manually by human laborers, crop rotation, mechanical cultivation, and chemical herbicides.
W
Author α ρ : Lecturer, Department of Computer Science and Engineering, Pabna University of Science and Technology.
E-mails : [email protected], [email protected] Author σ : Lecturer, Department of Electrical and Engineering, Pabna University of Science and Technology. E-mail : [email protected]
Author Ѡ:Assistant Professor, Department of Computer Science and Engineering, Pabna University of Science and Technology.
E-mail : [email protected]
evaluate their performance in an automated weed
control system. These three classification technique are
examined to find the optimum solution. Naïve Bayes
classifier has been preferred as it is simple, effective
and fast amongother classification algorithms.
II.
Methods
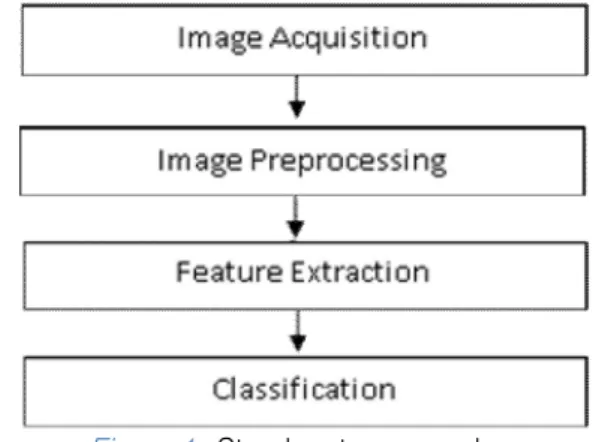
a) Process Flow
The overall procedure of this paper has shown
inFig: 1. Images were captured by a digital camerawith
4.9-24.5 mm lens. The position of camera was 90
degree angle form the ground that means vertically
towards the ground. The distancebetween camera lens
and the ground was 1.3 feet.Photo shed was used for
keeping same lightintensity. 1024x768 photo resolution
was set for capturing the color image of weeds and
crops. All images were taken from the capsicum filed.
There were five species including the capsicum. Other
four species were considered as weed for thecapsicum.
Figure 1: Step by step procedure
b) Image Preprocessing
The high resolution image was converted to
225x175 pixels in order to minimize the computation
cost. Color segmentation based image-processing has
been done for distinguishing plants from background
objects where objects are one of two classes as plants
andbackground. The plants in the field images mustbe
properly segmented otherwise extraction offeatures will
give improper results. Each and everypixel of rgb (red,
green, blue) image an exhibitorvalue ‘e’ was calculated
by using colorcomponent for enhancing the green plant
incompare to the background:
(1) The rgb color plant images were converted to
grey images after calculation of e value. Binarization
technique with global threshold was performed onthese
images to separate plants form the background.
Composite Laplacian mask was used for further
enhancement of the grey-scale image [3]. As the
sharpening procedure is sensitive to noise, a linear
smoothing method known as median filter was used
which successfully reduce impulse noise [4]. Otsu’s
method [9] an effective technique was used to select the proper binarization threshold value. If the pixel value ‘p’ is smaller than threshold value‘t’ were referred as soil in the binary image. In binary image ‘0’ indicates the background where ‘1’ indicates the plant.
To remove the noise from binary image, at first morphological opening has applied. In this operation, an erosion operation is followed by a dilation operation. It makes smooth the image by eliminating small pixel regions. The erosion and dilation were combined in reverse order for morphological close operation. This close operation fills the small holes in image [5].
c) Features Extraction
Ten features were extracted from the binary images (Fig 2). These features were decomposed as shape, color and moment invariants. The shape features were divided into two categories: size dependent and size independent. Size dependent descriptors are area, perimeter, thickness, convex area and convex perimeter. The size dependent features were combined to present size dependent shape features:
For making the color features consistent with various lighting conditions, each and every color
component was divided by sum of all the three color
components. Here the color features were mean value
and the standard deviation.The scope of an object area
is measured bymoment invariant ( 1 N , 2 N , 3 N , 4 N )
[2] which consists of geometric transformation such as
scaling, translation and rotation. Here in this studyonly
central moments are considered.
d) Classification using Naïve Bayes Classifier
The Naïve Bayes classifier is a simple but
effective classifier has been used here to minimize the
computation cost. Let be a vector we want to
classify and c be a possible class. Using Bayesformula
first we transform the probability
Performance Analysis among Different Classifier Including Naive Bayes, Support Vector Machine and C4.5 for Automatic Weeds Classification
Global Journal of Computer Science and Technology Volume XIII Issue III Version I
2 ( DDDD ) Year 013 2 12 F
b
r
g
e
2
24
perimeter
formfactor
2thickness
area
ess
elongatedn
perimeter
perimeter
convex
convexity
_
area
convex
area
solidity
_
)
(
)
|
(
)
(
)
|
(
a
P
c
a
P
c
P
a
c
P
area
):
|
(
c
a
P
a
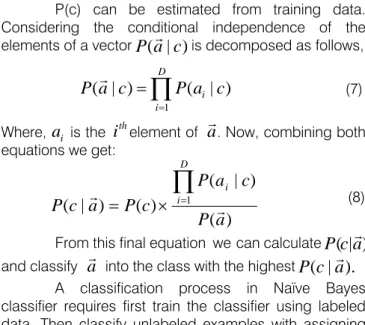
(2) (3) (4) (5) using Naïve Bayes, SVM and C 4.5 classifier and toP(c) can be estimated from training data. Considering the conditional independence of the
elements of a vector is decomposed as follows,
Where, is the element of . Now,combining both
equations we get:
From this final equation we can calculate
and classify into the class with thehighest
A classification process in Naïve Bayes
classifier requires first train the classifier using labeled
data. Then classify unlabeled examples with assigning
probabilistic labels to them. In this paper we consider
binary classification as weed and crops.
Let be the probabilistic label of example
illustrate the probability that it belongs to weedclass. If
the proportion of weed class examples in unlabeled
data is different form labeled data thenthe probabilistic
labels were calibrated. The maintheme of the calibration
is to shift all the probability values of unlabeled data to
the scope that the class distribution of unlabeled data
becomes alike to that of labeled data. In [15] thewhole
calibration process has shown.
e) Classification using C4.5 Classifier
Using the concept of information entropy, [18]
C4.5 builds decision trees from a set of trainingdata, in
the same way as ID3 (IterativeDichotomiser 3). [16] The
training data is a set S = (s1, s2,..., sn) of already
classified samples. Eachsample si= (x1, x2, ..., xn) is a
vector where xi represent attributes or features of the
sample. Thetraining data is augmented with a vector C
= c1,c2,..., cnwhere cirepresent the class to which each
sample belongs. [17] C4.5 algorithm selects the
attribute of the data that most effectively splits itsset of
samples into subsets enriched in one classor the other
at each node of the tree. The splitting criterion is the
normalized information gain(difference in entropy). The
attribute with the highest normalized information gain is
chosen to make the decision. The C4.5 algorithm then
recurses on the smaller sublists. Base case of this algorithm:
• All the samples in the list belong to thesame class.
When this happens, it simply creates aleaf node for
the decision tree saying to choosethat class.
• None of the features provide any information gain.
In this case, C4.5 creates adecision node higher up
the tree using theexpected value of the class.
• Instance of previously-unseen class encountered.
Again, C4.5 creates a decision node higher up the
tree using the expected value.
f) Classification using SVM
First task of SVM classifier requires separating
thedataset into two different parts. First one is used for
training and second one is used for testing. A class
label and the corresponding image features have been
assigned to each instance in the training set. When the
features values are provided, SVM generates a
classification model which is used to predict the class
labels of the testdata depending on training data. Each
instance is represented by an n-dimensional feature
vector, V = (v1, v2, … …, vn ) Here, ‘V’ depicts n
measurements made on an instance of n features. The
dataset is normalized before use because the feature
values for the dataset can have ranges that vary in
scale. The LIBSVM 2.91 [19] library was used to
implement the support vector classification where each
feature value of the dataset was scaled to the range of
[0, 1]. The RBF(Radial-Basis Function) kernel was used
for both SVM training and testing which mapped
samples nonlinearly onto a higher dimensional space.
For this reason, this kernel is able to handle cases
where nonlinear relationship exists between class labels
and features. A commonly used radial basisfunction
[3] is:
Where,
Here, ‘vi’ and ‘vj’ are n-dimensional feature
vectors. Implementation of the RBF kernel in LIBSVM
2.91 requires two parameters: ‘γ’ and a penalization
parameter, ‘C’ [19]. Appropriate values of ‘C’ and ‘γ’
should be specified to achieve a high accuracy rate in classification. By repeated experiments [3], C = 1.00
and γ = 1 / n were chosen.
Figure 2 :Binary image after open-close operation III.
Result and Disscussion
In this paper, each setting is evaluated by using 10-fold validation procedure. 10-fold
cross-validationprocedure needs portioning the wholetraining
set into 10 subgroups. Each and everysubgroup has an
equalnumber of instances. Inthis training process, one
subgroup is tested with the remaining nine subgroups.
Global Journal of Computer Science and Technology Volume XIII Issue III Version I
13 (DDDDDDDD ) Year 013 2 F
D i ic
a
P
c
a
P
1)
|
(
)
|
(
)
|
(
a
c
P
ia
i
tha
)
(
)
|
(
)
(
)
|
(
1a
P
c
a
P
c
P
a
c
P
D i i
)
|
(
c
a
P
a
P
(
c
|
a
).
ik
thi
,
exp(
||
||
2),
0
i j
j iv
v
v
v
K
)
(
)
(
||
||
2 i j t j i j iv
v
v
v
v
v
(7) (9) (10) (8)As a result, over fitting protection is ensured and smooth outcome for the actual computing is achieved.
Three hundred sample image data were trained and one hundred sample image data were tested. The result of 10-fold cross-validation of Naïve Bayes classifier using ten features was found 99.3% accurate. 98.24% and 97.86% accuracy has been achieved using 10-fold cross-validation of SVM and C4.5 classifier consecutively. Table 1 has shown the success rate comparison using all features. The number of features has been reduced to minimize the computational complexity. This study has experimented on fifteen features and by using forward-selection and backward-elimination methods 10 features achieved the optimum accuracy rate. Selected features were convexity, mean value of ‘r’, mean value of ‘b’, standard deviation of ‘r’,
standard deviation of ‘b’, of area, of area,
of area, of area, of perimeter.
In present study the capsicum, cogon grass and marsh herb were successfully classified. Other two species had some misclassifications. Table 2 shows the comparative accuracy rate for each species. Here each and every species has trained with 60 samples and 20 sample images were used for testing whether the classifier can successfully classify or not.
Table 1:Classification result using all features
Table 2:Classification result using set of best features
IV.
C
onclusionOur main goal of this work is to find a solution which will minimize the operating cost as well as maximize the result. In this paper, three different
classifier including Naïve Bayes, SVM and C4.5 have
been evaluated to classify the weeds and crops.
Compare to SVM and C4.5, Naïve Bayes classifier
obtains highest result. The future work will focus on
wavelet transformation in image preprocessing steps.
We will also study the optimization technique for these
classifiers and ensure thatthe large training set will not
causeover fitting problem.
V.
Acknowledgement
With due homage and honor we wish to express
our gratitude to Almighty. We wish to express our love
and gratitude to our beloved families; for their
understanding & endless love, through the duration of
studies. We are grateful for theircontinuous support and
help, which taught us to be more responsible for own
good and for others.
References Références Referencias
1. Irshad Ahmad, Abdul Muhamin Naeem,Muhammad
Islam, Shahid Nawaz, “Weed Classification using
Histogram Maxima with Threshold for Selective
Herbicide Applications”, In the Proceedings of the
19th International Conference on Computer,
Information and Systems Science and Engineering
(CISE 2007), Bangkok (Thailand), 19: 2007,
331-334.
2. Faisal Ahmed, Hawlader Abdullah Al-Mamun, A.S.M
Hossain, Emam Hossain, Paul Kwan,“Classification
of crops and weeds from digital images: A support
vector machine approach”,Crop Protection, Volume
40, ISSN 0261-2194, 10.1016/j.cropro.2012.04.024,
October 2012, Pages98-104.
3. Faisal Ahmed, A.S.M Hossain, Emam Hossain,
Hawlader Abdullah Al-Mamun, Paul Kwan,
“Performance Analysis of Support Vector Machine
and Bayesian Classifier for Crop and Weed
Classification from Digital Images”, World Applied
Sciences Journal, Volume 12 (4), ISSN 1818-4952,
IDOSI Publications, 2011, Pages: 432-440.
4. Fu, J.C., J.W. Chai, S.T.C. Wong, J.J. Deng, J.Y.
Yeh, “De-noising of left ventricular myocardial
borders in magnetic resonance images”, Magnetic
Resonance Imaging, Volume 20(9), 2002, Pages:
649-657.
5. Rafael C. González, Richard Eugene Woods“Digital
Image Processing”, Pearson Education, Singapore,
2nd edition, pp: 528, 2004.
6. “International survey of herbicide tolerant weeds”,
http://www.weedscience.org/in.asp (accessed on 2,
June, 2012).
7. Jiang Zhengrong, Li Zhengxi, “Automatic Weed
Identification Based on Image Processing Technology”, the 3rd International Conference on
Machine Vision, ISBN: C 978-1-4244-8889-6,2011.
Global Journal of Computer Science and Technology Volume XIII Issue III Version I
2 ( DDDD ) Year 013 2 14 F
Performance Analysis among Different Classifier Including Naive Bayes, Support Vector Machine and C4.5 for Automatic Weeds Classification
Method Average Success Rate(%)
Naïve Bayes 95.4
SVM 95
C4.5 91.6
Plants Name Naïve
Bayes (%) SVM (%) C 4.5(%) Capsicum 100 100 100 Burcucumber 98.5 96.2 94.3 Cogongrass 100 100 100 Marsh herb 100 100 99 Pigweed 98 95 96 Average Accuracy Rate 99.3 98.24 97.86
8. E. –C. Oerke, “Crop losses to pests” The Journal of Agricultural Science and Volume 144(1), doi: 10.1017/S0021859605005708, 2006, pp: 31-43.
)
ln(
N
1ln(
N
2)
)
9. Otsu, “A Threshold Selection Method from
Gray-Level Histograms”, IEEE Transactions on Systems,
Man and Cybernetics, SMC-9(1): 62-66, 1979.
10. Shearer, S.A. and P.T. Jones, et al., “Selective
Application of Post-Emergence Herbicides Using
Photoelectric”, ASABE Technical Library,
Trans-actions of the ASAE, Volume 34(4), 1991, pp: 1661-1666.
11. Sogaard, H.T., “Weed Classification by Active
Shape Models”, Biosystems Engineering, Volume
91(3), 2005, pp: 271-281.
12. Weis, M., T. Rumpf, R. Gerhards, L. Plumer,
“Comparison of different classificationalgorithms for
weed detection from images based on shape
parameters”, In the Proceedings of the 1st
International Workshop on Computer Image Analysis in Agriculture, Potsdam, Germany, 2009, Volume 53, pp : 460-463.
13. Weis, M., R. Gerhards, “Feature extraction for the
identification of weed species in digital images for
the purpose of site-specific weed control”, In the
Proceedings of the 6th European Conference on
Precision Agriculture, Skiathos, Greece, Volume 6,
2007, pp: 537-544.
14. Weis, M., C. Gutjahr, V. Rueda, R. Gerhards, C.
Ritter, F. Scholderle, “Precision Crop Protection-the
Challenge and Use of Heterogeneity”, 1st Edition,
Chapter Detection and identification of weeds,
Springer Dordrecht Heidelberg London, New York,
pp: 119-134, 2010.
15. Yoshimasa Tsuruoka and Jun’ichi Tsujii,“Training a
Naive Bayes Classifier via the EM Algorithm with a
Class Distribution Constraint”, www.acl.ldc.upenn.
edu/W/W03/W03-0417.pdf.
16. S. Anupama Kumar, Dr. Vijayalaskshmi,“Implication
of Classification Techniques in Predicting Students
Recital”, International Journal of Data Mining &
Knowledge Management Process (IJDKP) vol.1,
No.5,September 2011.
17. Sonal Athavale, Neelabh Sao, “Classification on
Moving Object Trajectories”,International Journal of
Advanced Technology & Engineering Research
(IJATER), ISSN No: 2250-3536, vol 2, Issue 2,
May 2012.
18. Quinlan, J. R. C4.5: Programs for MachineLearning.
Morgan Kaufmann Publishers, 1993.
19. LIBSVM-A Library for Support Vector Machines,
http://www.csie.ntu.edu.tw/~cjlin/libsvm/ (accessed
on 10 June, 2012). Global Journal of Computer Science and Technology Volume XIII Issue III Version I
15 (DDDDDDDD ) Year 013 2 F
This page is intentionally left blank
Global Journal of Computer Science and Technology Volume XIII Issue III Version I
2
( DDDD
)
© 2013 Global Journals Inc. (US)
Year 013 2 16 F
Performance Analysis among Different Classifier Including Naive Bayes, Support Vector Machine and C4.5 for Automatic Weeds Classification