FUZZY LOGIC BASED IMPROVED SUPPORT VECTOR MACHINE
(F-ISVM) CLASSIFIERFOR HEART DISEASE CLASSIFICATION
S. Nithya1 and C. Suresh Gnana Dhas2
1Development Centre, Bharathiar University, Coimbatore, Tamilnadu, India
2Department of Computer Science Engineering, Vivekanandha College of Engineering for Women, Thiruchengode, Tamil Nadu, India
E-Mail: [email protected]
ABSTRACT
Classification is the major research topic in data mining. Typically classification represents the data to be categorized based on its features or characteristics. This proposed research work aims in developing fuzzy logic based improved support vector machine classifier. Support vector machine is a type of supervised machine learning technique and once when the dataset is given as input it performs the classification task by itself. The proposed classifier aims in improving the classification accuracy of the support vector machine by making use of fuzzy logic. The proposed classifier has been tested on two different datasets namely PIMA Indian diabetes dataset and Z-AlizadehSani dataset in order to classify the occurrence of heart disease among the patients. Performance metrics sensitivity, specificity and classification accuracy are taken for comparison of the proposed fuzzy logic based improved support vector machine classifier (F-ISVM) with several classification algorithms. Results showed that the proposed F-ISVM classifier gives better classification accuracy than that of support vector machine, naive bayes, neural networks, sequential minimal optimization (SMO) and bagging SMO classifiers.
Keywords: fuzzy, classification, naive bayes, neural network, bagging SMO, SMO, SVM, I-SVM, F-ISVM, PIMA, Z-AlizadehSani, sensitivity, specificity, classification accuracy.
1. INTRODUCTION
Data mining is the methodology used for discovering hidden information from the existing data. Knowledge discovery in data (KDD) is the trivial process involved in data mining for extracting the hidden knowledge from the data. Several conventional data mining algorithms are there which performs several tasks such as neighbourhood selection, classification, clustering, pattern matching, and information retrieval and so on. Broadly data mining can be classified as supervised data mining and unsupervised data mining. Supervised mechanisms are the one that has the ability to perform classification and prediction tasks. In recent years, machine learning algorithms are used as a supplement to perform data mining. Healthcare industry has abundant research problems that can be solved using data mining. Data mining using machine learning algorithms are used in order to undertake the research problem of classification in medical dataset which has several inputs. Fuzzy rule-based classification systems (FRBCSs) (Ishibuchi et al., 2004), (Kuncheva, 2000) are useful and well-known tools in the machine learning framework, since they can provide an interpretable model for the end user (Jin et al., 1999; Ho et al., 2004; Wang et al., 2005; Zhang et al., 2011). Support vector machine is one such machine learning algorithm and can be used for classification in data mining. Support vector machine can be trained from the historical / past data with the anticipation that it will determine hidden dependencies and that it will be able to use them for classification. The healthcare industry has volumes data and that need to be mined to discover hidden information for effective decision making. This research work aims to
improve the performance of the support vector machine classifier by making the classical simplex method (SM) to modified simplex method (MSM). This paper is organized as the follows. This section introduces the scope of the research. Section 2 discusses on the related works pertaining to the chosen research problem. Section 3 discusses on the proposed work. Section 4 details on the chosen dataset with the results and discussions. Section 5 describes the concluding remarks.
2. LITERATURE REVIEW
diagnosis of heart disease, automatically obtaining knowledge from the patient’s clinical data. Kai Li and Xiaoxia Lu., (2011), presented a double margin (rough margin) based fuzzy support vector machine (RFSVM) algorithm by introducing rough set into fuzzy support vector machine which combines the notion of rough set with the fuzzy support vector machine to deal with the sensitivity problem of fuzzy support vector machine. Abidin et al., (2009) studied how to evaluate the ability of fuzzy neural network model to predict the likelihood of coronary heart disease for individuals based on knowledge of their biomarkers, risk habits and demographic profiles. Padmakumari K. N. Anooj., (2011) developed a machine learning techniques to gain knowledge automatically from examples or raw data. Weighted fuzzy rule-based clinical decision support system (CDSS) is presented for the diagnosis of heart disease, automatically obtaining the knowledge from the patient’s clinical data. Roohallah Alizadehsania et al., (2013) studied and applied several algorithms ZAlizadehSanidataset (which utilizes several effective features.).
3. PROPOSED WORK
3.1 Fuzzy logic for improved-SVM
It is assumed that the training set
x
x
x
x
N
X
1,
2,
3,...,
contains patient’s health record,and each of them is either normal or prone to heart problems. Each record is represented by a distinct feature vector with positive numeric values. The set of features generated from all data are assumed to be:
f
f
f
f
N
F
1,
2,
3,...,
(1)We denote the set
L
{
l
1,
l
2,...,
l
P}
as P possible data classes. In order to avoid the crisp definition of a row in the dataset belonging to one of the classes, fuzzy technique is involved. Firstly, we will try to divide the Ninto P classes and each class is represented by its centroid, which is an element of C
c1,c2,...,cP
. In addition, a membership partition matrix U of size (N×P) is used to measure each of the class centers. The membership matrix elements are defined by:P q N i u p q q i q i
iq
1 , 1 , || , || || , || 1 2 2 c f c f (2)where
u
iq of a value between 0 and 1 is the membership grade of the input data connection i in the class q, β (β>1) is the weighting exponent representing the degree of thefuzziness for the membership grades, and
||
f
i,
c
q||
represents the Mahalanobis distance between the data feature vectorf
i and the centroidc
qof class q and is defined as:)
(
)
(
||
,
||
1 q i q T q i qi
c
f
c
Σ
f
c
f
(3)
where
Σ
qis the covariance matrix of the centroid vector of class q. Equation (3) becomes the Euclidean distance whenq
Σ
is the unity matrix.The centroid of class q is further defined as:
P q u u N i iq N i i iq
q 1,2, ,
1
1
f c (4)The class centroids are iteratively optimized by minimizing the following dissimilarity function J (U, C):
i
u
u
C
U
J
P q iq N i P q q i iq
,
1
:
Subject to
||
,
||
,
1 1 1 2c
f
(5)With the fuzzy technique we keep on upgrading
q
c
andu
iq iteratively until the dissimilarity functionJ(U,C) is minimized. The optimal class centroids
c
q for the fuzzy classifier are found when the iteration stops with
1)
( )
(,
max
iq iq qi
u
u
, where ε is a pre-selectedthreshold between 0 and 1, and
is the number of iterations. The initial values of the class centroids in (2) are obtained from the labelled training data directly. Therefore, the iterations in (2)-(5) normally can converge quickly. Since the class information of the labelled training data is used in the proposed algorithm, the learning process is considered to be semi-supervised. The next section makes use of the above said fuzzy logic technique.3.2 Improved SVM
dimension space is obtained; this is done by transforming data vectors xin through a function (x). In this transformation, explicit calculation of (x) is not necessary; instead of that, just the inner product between mapped vectors is required. For this inner product, kernel functions fulfilling the Mercer condition are usually used. An example of a kernel function is given in (6).
k
x
i,
x
j
x
i T
x
j
(6)Max
ii1 l
1
2
i
jy
iy
jk
x
i,
x
j
i,j1l
(7),
0
To
Subject
1
l i i iy
(8)l
i
i
1
,
,
0
(9)whereyi, yj are labels for data vectors i, j respectively and
αi are the Lagrange multipliers introduced to transform the original formulation of the problem with linear inequality constraints into the above representation. The ζ parameter controls the misclassification level on the training data and therefore the margin. A large ζ corresponds to assign a higher penalty to the errors, decreasing the margin, while a small ζ tolerates more errors, growing the margin.
Once a solution is obtained, a decision rule used to classify data is defined as in (10):
nsv i ii
y
k
b
sign
x
f
1,
x
x
i
(10)Where nsv defines the number of support vectors, b is the projection xi onto the hyperplane that separates the classes, and only non-zero αi Lagrange multipliers counts for the decision rule. Consequently, just the data vectors associated to these multipliers are called support vectors. As a result, there is a solution to divide the problem in smaller subproblems, which are easier to manage and solve. However, an important disadvantage of this approach is that random selection of data vectors to build subproblems, can affect the performance, giving an inferior learning rate.
To perform kernel functions analysis, an improved performance based approach is developed. This approach includes the common stages of the SVM training process:
a) Reading and Modelling data vectors using a kernel function,
b) Learning (Training), solving QPP obtained with data, and
c) Classification (where a classifier is built with Support Vectors found in the training stage).
This classifier is used to classify new data. In the proposed research the learning stage is achieved using the method derived using the equations (11) to (13):
Mín
f
c
j
j
1
2
jq
ij
i i1m
j1 l
j1 l
(11)
a b i mg l
j ij j i
, , 1 , 0 To Subjec 1
(12)
j lhj
j 0, 1,, (13)Transforming it into the Equivalent Linear Model (14) to (19):
l j jV
1Mín
(14) l j V u a q c mi j j
m
i i ij i ij
j 0, 1, ,
To Subject
1 1
(15)
m
i
b
Y
a
i lj ij j i
,
,
1
,
1
(16) m i l j Vuj j i
j0, 0, 0,
0, 1,, , 1,,
(17)
whereVj are artificial variables and Yi are slack variables which are unrestricted in sign for i=1,…,m. In addition, the complementary slackness conditions (13) and (14) will be fulfilled.
m
i
Y
ii
0
,
1
,
,
(18).
,
,
1
,
0
j
l
u
j
j
(19)
the way that the incoming variable is selected. In any iteration, a variable is a candidate to be the next incoming variable if it is a non-basic variable and it can potentially improve the objective function in the next iteration. In the
λ-Y case, the selection process is as follows: If λi is an incoming variable candidate, it can be selected as the incoming one only if Yi (i.e. the Y variable with the same index) is not in the basis. MSM indicates those columns (or variables) that are active (i.e. the basic variables) and inactive in the problem solution. On the other hand, if Yi is an incoming variable candidate, it can be selected as the incoming one only if λi is not in the basis. Similar conditions must be fulfilled for variables αj and uj. Once when the dataset has been given as the input the classification task is performed and the results are conceived and it is presented in the next section.
4. ABOUT DATASET
A dataset is a collection of data. This research work uses PIMA dataset and Z-AlizadehSani dataset for evaluating and comparing with existing algorithms.
4.1 PIMA dataset
This multivariate data set is used for diabetes detection, and is the result of a research survey carried out in the National Institute of Diabetes and Digestive and Kidney Diseases, United States on the female patients of Pima Indian heritage having age greater than 21. This dataset is commonly used among researchers who used machine learning method for diabetes disease classification, so it provides us to compare the performance of our method with that of others. The class distribution is: Class 1: normal (500), Class 2: Pima Indian diabetes (268) (SantiWulanPurnami, et al., 2010). The dataset contains 768 samples and two classes. All patients in this database are Pima-Indian women at least 21 years old and living near Phoenix, Arizona, USA. It has got 768 tuples and contains 9 numeric-valued attributes including the class. The class attribute has got two values,
namely ‘‘tested negative for diabetes’’ and ‘‘tested positive for diabetes’’ and denoted by values ‘0’ and ‘1’ respectively. Many constraints were added for selecting the tuples from a large database (SoumadipGhosh et al., 2014).
4.2 Z-AlizadehSani dataset
The Z-AlizadehSani dataset contains the records of 303 patients, each of which have 54 features. All features can be considered as indicators of CAD for a patient, according to medical literature (Polat and Gunes, 2007; RoohallahAlizadehsania et al., 2013). However, some of them have never been used in data mining based approaches for CAD diagnosis. The features are arranged in four groups: demographic, symptom and examination, ECG, and laboratory and echo features. Each patient could be in two possible categories CAD or Normal. A patient is categorized as CAD, if his/her diameter narrowing is greater than or equal to 50%, and otherwise as Normal. Some of the features are HTN identifies history of hypertension, DM is history of Diabetes Mellitus, Current Smoker is current consumption of cigarettes, Ex-Smoker is history of previous consumption of cigarettes, and FH is history of heart disease in first-degree relatives.
5. RESULTS AND DISCUSSIONS
The sensitivity, specificity and classification accuracy are the performance metrics used to evaluate the performance of this research work namely F-ISVM. The classification is performed on two datasets namely PIMA Indian diabetes dataset and Z-AlizadehSani dataset. The classification accuracy, sensitivity and specificity can be calculated using the following metrics.
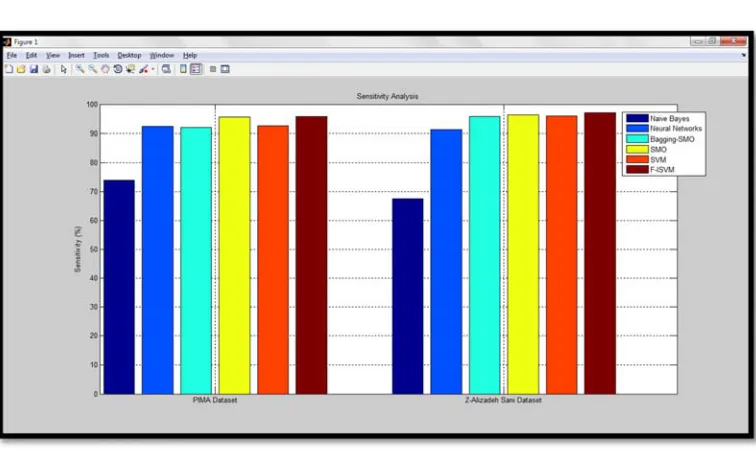
Figure-1. Sensitivity analysis.
[image:5.612.315.541.355.476.2]Figure-1 depicts Sensitivity Analysis of F-ISVM on PIMA Indian diabetes dataset and Z-AlizadehSani dataset. It can be clearly understood that the proposed work F-ISVM provides better results than Naive Bayes, Neural Network, Bagging SMO, SMO and SVM. Corresponding numerical values of the results are provided in Table-1.
Table 1. Sensitivity analysis.
Algorithms PIMA dataset AlizadehSani dataset
Naive Bayes 73.91 67.59
Neural Network 92.42 91.2
Bagging SMO 92.09 95.83
SMO 95.59 96.3 SVM 92.48 95.93
F-ISVM 95.77 97.16
Figure-2. Specificity analysis.
Figure-2 depicts Specificity Analysis of F-ISVMon PIMA Indian diabetes dataset and Z-AlizadehSani dataset. It can be clearly understood that the proposed work F-ISVMprovides better results than Naive Bayes, Neural Network, Bagging SMO, SMO and SVM. Corresponding numerical values of the results are provided in Table-2.
Table-2. Specificity analysis.
Algorithms PIMA dataset AlizadehSani dataset
Naive Bayes 76.92 95.4
Neural Network 86.76 80.46
Bagging SMO 89.15 87.36
SMO 92.42 88.51 SVM 96.3 97.71
F-ISVM 96.83 96.85
Figure-3. Classification accuracy analysis.
Figure-3 depicts Classification Accuracy Analysis of F-ISVM on PIMA Indian diabetes dataset and Z-AlizadehSani dataset. It can be clearly understood that the proposed work F-ISVM provides better results than Naive Bayes, Neural Network, Bagging SMO, SMO and SVM. Corresponding numerical values of the results are provided in Table-3.
Table-3. Classification accuracy analysis.
Algorithms PIMA dataset AlizadehSani dataset
Naive Bayes 75.37 75.51
Neural Network 89.55 88.11
Bagging SMO 90.67 93.4
SMO 94.03 94.08 SVM 94.4 96.37
F-ISVM 96.27 97.03
Table-3 depicts Classification Accuracy Analysis of Naive Bayes, Neural Network, Bagging SMO, SMO, SVM and F-ISVMon PIMA Indian diabetes dataset and Z-AlizadehSani dataset. It can be clearly understood that the proposed work F-ISVM provides better results.
6. CONCLUSIONS AND FUTURE RESEARCH DIMENSIONS
The proposed research work presents fuzzy logic based improved support vector machine (F-ISVM) classifier. F-ISVM classifier considers the conventional simplex method as the modified simplex method. Fuzzy logic is introduced in order to avoid the crisp definition of a row in the dataset belonging to one of the classes, fuzzy
technique is involved.The F-ISVM is evaluated using the performance metrics sensitivity, specificity and classification accuracy. Two datasets were chosen for evaluating the performance of the proposed F-ISVM classifier with naive bayes, neural network, SMO, bagging SMO and support vector machine algorithms. From the results it is evident that the proposed F-ISVMachieves better classification accuracy than rest of the algorithms.
REFERENCES
Abidin Dom, Rahman Bakar. 2009. Use of fuzzy neural network to predict coronary heart disease in a Malaysian sample. 8th WSEAS International Conference on Telecommunications and Informatics, Istanbul, Turkey.
Anooj. 2012. Clinical decision support system: Risk level prediction of heart disease using weighted fuzzy rules. Journal of King Saud University - Computer and Information Sciences. 24, 27-40.
Bo Jin, Y.C. Tang, Yan-Qing Zhang. 2007. Support vector machines with genetic fuzzy feature transformation for biomedical data classification. Information Sciences. 177(2): 476-489.
Ho Chen, Ho Chen. 2004. Design of accurate classifiers with a compact fuzzy-rule base using an evolutionary scatter partition of feature space. IEEE Trans. Syst., Man, Cybern. B, Cybern. 34(2): 1031-1044.
Jin Seelen, Sendhoff. 1999. Generating fc(3) fuzzy rule systems from data using evolution strategies. IEEE Trans. Syst. Man Cybern. B, Cybern. 29(6): 829-845.
Kai Li, Xiaoxia Lu. 2011. A Double Margin Based Fuzzy Support Vector Machine Algorithm, Journal Of Computers, Vol. 6, No. 9, September.
Khatibi Montazer. 2010. A fuzzy-evidential hybrid inference engine for coronary heart disease risk assessment. Expert Systems with Applications. 37(12): 8536-8542.
Kuncheva. 2000. Fuzzy Classifier Design. Berlin, Germany: Springer-Verlag.
Padmakumari K. N. Anooj. 2011. Clinical decision support system: risk level prediction of heart disease using weighted fuzzy rules and decision tree rules. Central European Journal of Computer Science. 1(4): 482-498.
Polat Gunes. 2007. A hybrid approach to medical decision support systems: combining feature selection, fuzzy weighted pre-processing and AIRS. Computer Methods and Programs in Biomedicine. 88: 164-174.
Roohallah Alizadehsania, Jafar Habibia, Mohammad Javad Hosseini, Hoda Mashayekhia, Reihane Boghrati a, Asma Ghandeharioun, Behdad Bahadorian, Zahra Alizadeh Sani. 2013. A data mining approach for diagnosis of coronary artery disease. Computer methods and programs in biomedicine. 111: 52-61.
Santi Wulan Purnami, Jasni Mohamad Zain, Abdullah Embong. 2010. Data Mining Technique for Medical Diagnosis Using a New Smooth Support Vector Machine. Networked Digital Technologies: Second International Conference, NDT 2010, Prague, Czech Republic.
Soumadip Ghosh, Sushanta Biswas, Debasree Sarkar, ParthaPratimSarkar. 2014. A novel Neuro-fuzzy classification technique for data mining. Egyptian Informatics Journal. 15, 129-147.
Tsipouras Exarchos, Fotiadis Kotsia, Vakalis Naka, Michalis. 2008. Automated Diagnosis of Coronary Artery Disease Based on Data Mining and Fuzzy Modeling. Information Technology in Biomedicine, IEEE Transactions on. 12(4): 447, 458.
Wang Kwong, Jin Wei, Man. 2005. Multi-objective hierarchical genetic algorithm for interpretable fuzzy rule-based knowledge extraction. Fuzzy Sets Syst. 149: 149-186.