POUR L'OBTENTION DU GRADE DE DOCTEUR ÈS SCIENCES
acceptée sur proposition du jury: Prof. D. N. A. Van De Ville, président du jury Prof. J. D. R. Millán-Ruiz, directeur de thèse
Prof. C. Michel, rapporteur Prof. B. Blankertz, rapporteur
Prof. D. Ghezzi, rapporteur
A Multifaceted Approach to Covert
Attention Brain-Computer Interfaces
THÈSE N
O9052 (2018)
ÉCOLE POLYTECHNIQUE FÉDÉRALE DE LAUSANNE
PRÉSENTÉE LE 14 DÉCEMBRE 2018À LA FACULTÉ DES SCIENCES ET TECHNIQUES DE L'INGÉNIEUR CHAIRE FONDATION DEFITECH EN INTERFACE DE CERVEAU-MACHINE
PROGRAMME DOCTORAL EN NEUROSCIENCES
Suisse 2018
PAR
Experience is merely the name men gave to their mistakes. — Oscar Wilde, The Picture of Dorian Gray
Acknowledgments
As much as a thesis is usually referred to as the work of one person, nothing could be further from the truth. The journey of my PhD, which is coming to an end with this thesis, would not have been possible without the help of many people, and would have certainly be less enjoyable without many more.
First, I want to thank my supervisor, Professor José del Rocío Millán, who has given me the opportunity to work in this absolutely fascinating field of science. I am also very grateful for the freedom I was granted in my research work which enabled me to pursue my very own scientific interests. This resulted in me being lost at times and failing at others, but in the end it has allowed me to grow into an independent researcher, even if there is still so much more to learn.
Then, I want to thank the proofreaders of this thesis, Anahita, Luca, Marija, Michael and Simis, for all the hours they have put in to read and improve my manuscript.
Further I want to thank all the people in our lab with whom I had the honor to work. Thank you for your open ears and great advice, for making time to discuss with me, and for cheering me up when things were rough. I specifically want to thank you, Simis, for being there for me from the first day of my PhD until the last one, for your guidance, patience and calm words. I want to thank Michael for our long coffees and discussions about the fascinating intricacies of human cognition and science in general. And I want to thank Luca T. for always being there when I had questions and to urge me to put my ideas and results into writing, even when I wasn’t satisfied with what I got. And thank you to the NIRS-heros team, Coralie, Blanca and Ali for the debates and encouragements.
I also want to express my gratitude to the great times I could spend with all my colleagues outside the scope of work. Thank you to Luca R. for being my workout buddy and motivator, Arnaud for teaching me how to correctly pump iron, Tiffany for her steady encouragements and always believing in me, Marija for her never-ending cheerfulness at lunch, Zahra and Sareh for teaching me the beauty of the Persian language and Pierluca for patiently answering all my Italian questions. I will never forget the road trip through the south-western USA with Michael, Sareh and Tiffany, skiing with Kyuwha and Ruslan, ski touring with sleepover in a hut with Michael, Stéphanie and Kyuwha, hiking (and nearly getting lost) with Dong and Ping-Keng, and traveling Austria with Tiffany. Thank you for those precious memories. Finally, I wanted to say an enormous thank you to my parents Walter and Irmtraud, my siblings Martin, Johannes, Cornelia, Franziska, Marianne, Katharina and Michael, my grandmothers Theresia and Hedwig, my close friends, especially Ewald, Philipp and Beat, and my girlfriend
Acknowledgments
Anahita. Thank you for carrying me through the bad times and for enjoying the good times with me. Thank you for your love, your encouragement and your friendship.
Lausanne, 28 September 2018 C. S.
Abstract
Over the last years, brain-computer interfaces (BCIs) have shown their value for assistive technology and neurorehabilitation. Recently, a BCI-approach for the rehabilitation of he-mispatial neglect has been proposed on the basis of covert visuospatial attention (CVSA). CVSA is an internal action which can be described as shifting one’s attention to the visual periphery without moving the actual point of gaze. Such attention shifts induce a laterali-zation in parietooccipital blood flow and oscillations in the so-called alpha band (8-14 Hz), which can be detected via electroencephalography (EEG), magnetoencephalography (MEG) or functional magnetic resonance imaging (fMRI). Previous studies have proven the technical feasibility of using CVSA as a control signal for BCIs, but unfortunately, these BCIs could not provide every subject with sufficient control. The aim of this thesis was to investigate the possibility of amplifying the weak lateralization patterns in the alpha band — the main reason behind insufficient CVSA BCI performance.
To this end, I have explored three different approaches that could lead to better performing and more inclusive CVSA BCI systems. The first approach illuminated the changes in the behavior and brain patterns by closing the loop between subject and system with continuous real-time feedback at the instructed locus of attention. I could observe that even short (20 minutes) stretches of real-time feedback have an effect on behavioral correlates of attention, even when the changes observed in the EEG remained less conclusive. The second approach attempted to complement the information extracted from the EEG signal with another sensing modality that could provide additional information about the state of CVSA. For this reason, I firstly combined functional functional near-infrared spectroscopy (fNIRS) with EEG measurements. The results showed that, while the EEG was able to pick up the expected lateralization in the alpha band, the fNIRS was not able to reliably image changes in blood circulation in the parietooccipital cortex. Secondly, I successfully combined data from the EEG with measures of pupil size changes, induced by a high illumination contrast between the covertly attended target regions, which resulted in an improved BCI decoding performance. The third approach examined the option of using noninvasive electrical brain stimulation to boost the power of the alpha band oscillations and therefore render the lateralization pattern in the alpha band more visible compared to the background activity. However, I could not observe any impact of the stimulation on the ongoing alpha band power, and thus results of the subsequent effect on the lateralization remain inconclusive.
Overall, these studies helped to further understand CVSA and lay out a useful basis for further exploration of the connection between behavior and alpha power oscillations in CVSA tasks,
Acknowledgments
as well as for potential directions to improve CVSA-based BCIs.
Keywords:brain-computer interface, covert visuospatial attention, electroencephalography, functional near-infrared spectroscopy, pupillometry, transcranial alternating current stimula-tion, alpha oscillations
Zusammenfassung
In den letzten Jahren haben Gehirn-Computer Schnittstellen (BCI) mehr und mehr ihren Wert für Unterstützungstechnologie und Neurorehabilitation gezeigt. Erst kürzlich wurde ein BCI-Ansatz auf der Basis von verdeckter visuell-räumlicher Aufmerksamkeit (CVSA) für die Rehabilitation von visuellem Neglect vorgeschlagen. CVSA ist ein rein internes Phänomen und beschreibt die Verschiebung des Aufmerksamkeitszentrums weg vom fixierten Punkt in die visuelle Peripherie ohne dabei die Augen zu bewegen. Solche Aufmerksamkeitsverschiebungen veranlassen eine Lateralisation in der Durchblutung des parietooccipitalen Kortex, als auch in Oszillationen im Frequenzbereich der Alpha-Wellen (8-14 Hz). Dies kann durch Elektro-enzephalografie (EEG), MagnetoElektro-enzephalografie (MEG) oder funktioneller Magnetresonanz-tomografie (fMRT) gemessen werden. Vorangegangene Studien haben die technische Mach-barkeit aufgezeigt, CVSA als Steuersignal for BCIs heranzuziehen, aber leider waren diese Systeme nicht von allen Versuchspersonen beherrschbar. Das Hauptziel dieser Dissertation war es, zu untersuchen, wie schwache Lateralisationsmuster in der Alpha-Frequenz, welche der Hauptgrund für unzureichende Kontrolle über ein CVSA BCI sind, zu verstärken.
Zu diesem Zweck habe ich drei verschiedene Ansätze erforscht, zu besseren und genaueren CVSA BCIs zu gelangen, welche mehr Menschen offen stehen. Der erste Ansatz beleuchtete die Veränderungen im Verhalten und der Gehirnwellen wenn das BCI system "geschlossen"wird, d.h. wenn kontinuierlich eine Echtzeitrückmeldung vom Computer an den Benützer erfolgt. Dabei konnte ich in Erfahrung bringen, dass sogar kurze Perioden (20 Minuten) mit Echtzeit-rückmeldung einen signifikanten Effekt auf die Verhaltensgestützte Messung haben, auch wenn im EEG keine Veränderungen erkennbar sind. Im zweiten Ansatz habe ich versucht, das EEG um eine weitere Aufnahmemodalität zu ergänzen, um mehr, und vor allem komplementäre Information über den Zustand der CVSA zu erhalten. Aus diesem Grund habe ich zuerst funktionelle Nahinfrarotspektroskopie (fNIRS) mit dem EEG kombiniert, aber die Resultate zeigten, dass während das EEG die erwartete Lateralisation in der Alpha-Frequenz aufzeichnen konnte, das fNIRS keine aussagekräftigen Daten lieferte. Danach habe ich das EEG mit Pupillometrie kombiniert. Zwei verschieden helle Seiten am Versuchsbildschirm lösten dabei eine Verengung oder Erweiterung der Pupille aus, je nachdem welcher Seite mehr Aufmerk-samkeit geschenkt wurde. Die Fusion beider Methoden konnte dabei die einzeln erreichte Leistung übertreffen. Der dritte Ansatz untersuchte die Option, nichtinvasive elektrische Gehirnstimulation zur Verstärkung der Körpereigenen Signale einzusetzen. Eine Erhöhung der Frequenzstärke im Alpha-Bereich könnte nämlich helfen, die Lateralisation, welche die Verschiebungen in der CVSA begleitet, besser von der restlichen Gehirnaktivität zu abzuheben.
Acknowledgments
Allerdings konnte ich keinen Effekt der elektrischen Hirnstimulation erkennen, und dadurch die Frage, ob eine Verstärkung der Alpha-Frequenz auch eine bessere Erkennbarkeit von CVSA im EEG mit sich bringt, nicht ausreiched beantworten.
Im Großen und Ganzen haben diese Studien dazu beigetragen CVSA etwas besser zu verstehen. Weiters haben sie eine brauchbare Basis für die fortschreitende Erforschung der Beziehung zwischen Verhalten und den Verteilung der Alpha-Wellen im Gehirn während andauernder CVSA gelegt. Und schlussendlich, haben sie auch mögliche Richtungen aufgezeigt, wie das ursprünglich angestrebte Ziel — die Erkennungsrate von CVSA Signalen zu verbessern — erreichbar wäre.
Schlagwörter:Gehirn-Computer Schnittstelle (BCI), verdeckte visuell-räumliche Aufmerk-samkeit (CVSA), Elektroenzephalogramm (EEG), funktionelle Nahinfrarotspektroskopie (fNIRS), Pupillometrie, transkranielle Wechselstromstimulation (tACS), Alpha-Wellen
Contents
Acknowledgments v
Abstract (English/Français/Deutsch) vii
List of figures xiii
List of tables xvi
1 Introduction 1
1.1 Brain-computer interfaces . . . 2
1.2 Brain imaging technologies for BCI . . . 2
1.3 Mental commands for EEG-based BCIs . . . 5
1.3.1 Evoked signals . . . 6
1.3.2 Endogenous signals . . . 7
1.4 Covert visuospatial attention . . . 8
1.5 Covert visuospatial attention BCIs . . . 11
1.6 Choice of BCI and limitations . . . 13
1.7 Thesis aims and outline . . . 14
2 Real-time feedback 17 2.1 Introduction . . . 18
2.2 Materials and Methods . . . 19
2.2.1 Participants . . . 19
2.2.2 Experimental protocol . . . 19
Offline paradigm . . . 20
Real-time feedback paradigm . . . 20
2.2.3 Data acquisition and processing . . . 20
Behavior . . . 22 Preprocessing . . . 22 Alpha lateralization . . . 23 Closed-loop feedback . . . 23 Post-hoc classification . . . 24 2.2.4 Reporting . . . 25 2.3 Results . . . 25
Contents
2.3.1 Behavioral correlates of attention . . . 25
2.3.2 Neurophysiological correlates of attention . . . 26
2.3.3 Single trial classification . . . 30
2.4 Discussion . . . 30
2.4.1 Closed-loop feedback for CVSA . . . 31
2.4.2 Alpha-band lateralization . . . 32
2.4.3 Single trial classification . . . 33
2.5 Conclusion . . . 34
3 Multimodal sensing 35 3.1 Introduction . . . 36
3.2 Functional near-infrared spectroscopy . . . 38
3.2.1 Introduction . . . 38
3.2.2 Materials and Methods . . . 41
Participants . . . 41 Material . . . 42 Experimental protocols . . . 43 Data processing . . . 45 3.2.3 Results . . . 49 Experiment 1 . . . 49 Experiment 2 . . . 54 Experiment 3 . . . 57 3.2.4 Discussion . . . 57 3.3 Pupillometry . . . 59 3.3.1 Introduction . . . 59
3.3.2 Materials and Methods . . . 60
Visual display . . . 60 Data analysis . . . 60 Classifier fusion . . . 61 3.3.3 Results . . . 62 3.3.4 Discussion . . . 64 3.4 Conclusion . . . 65 4 Brain stimulation 69 4.1 Introduction . . . 70
4.2 Materials and Methods . . . 71
4.2.1 Participants . . . 71
4.2.2 Experimental setup . . . 71
4.2.3 Session structure . . . 71
Resting state . . . 72
CVSA task . . . 72
Transcranial alternating current stimulation . . . 74
4.2.4 Questionnaire . . . 75 xii
Contents
4.2.5 Data processing . . . 75
EEG preprocessing . . . 75
Individual alpha frequency . . . 75
Alpha lateralization index . . . 76
Discriminative analysis . . . 76
4.3 Results . . . 76
4.3.1 Effect of tACS on alpha power . . . 76
4.3.2 Effect of tACS on alpha-power lateralization during CVSA . . . 77
4.3.3 Changes in classification accuracy . . . 78
4.3.4 Behavioral effect . . . 78
4.3.5 Comparison with no-stimulation condition . . . 79
4.4 Discussion . . . 79
4.4.1 tACS parameter choices . . . 80
4.4.2 Simulation of the electric field . . . 84
4.4.3 Choice of control condition . . . 86
4.4.4 Role of enhanced alpha power in CVSA . . . 86
4.5 Conclusion . . . 86
5 Discussion and conclusion 87 5.0.1 Contributions . . . 87
5.0.2 Proposed future work . . . 88
5.0.3 Conclusion . . . 90
Bibliography 91
List of Figures
1.1 Components of a BCI system . . . 3
1.2 Temporal and spatial resolution of different brain imaging modalities . . . 6
1.3 Visual scanning patterns of neglect patients . . . 10
1.4 Retinotopic organization ofα-power during CVSA . . . 11
1.5 Thesis outline . . . 14
2.1 Experimental design and visual feedback . . . 21
2.2 Behavioral results . . . 27
2.3 Electrophysiological results . . . 28
2.4 Correlation of electrophysiological and behavioral results . . . 29
2.5 Correlation with theα-LI and classification results . . . 31
3.1 Basics of functional near-infrared spectroscopy (fNIRS) . . . 39
3.2 Coverage of existing literature . . . 41
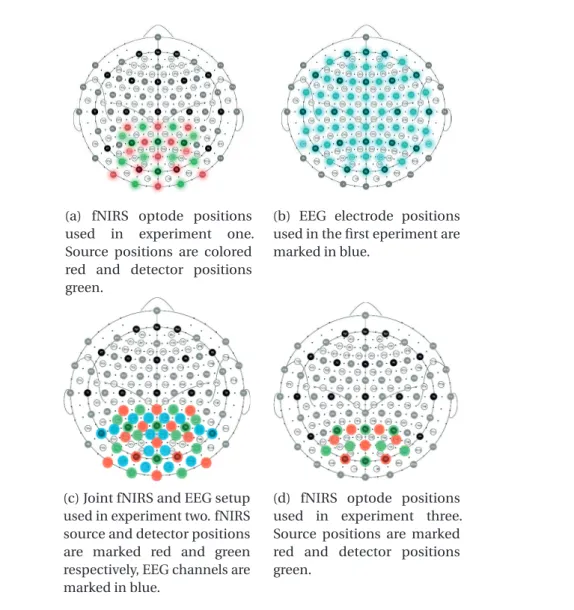
3.3 Cap setups for EEG and fNIRS . . . 44
3.4 Experimental setup and subject placement . . . 45
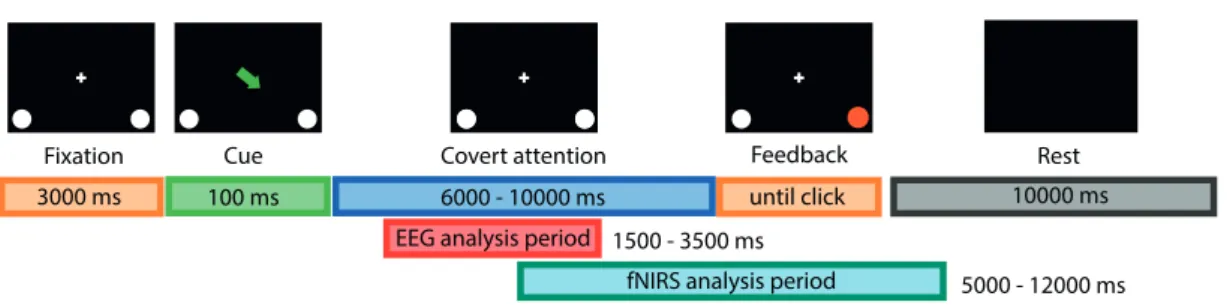
3.5 Visual protocol with temporal scheme for CVSA task. . . 45
3.6 Visual protocol with temporal scheme for rotating checkerboard pinwheel. . . 46
3.7 Distribution of reaction time in dependence of the trial duration. . . 49
3.8 Topoplot correlation EOG with EEG . . . 50
3.9 Time seriesR2-value topoplots, left minus right trials, for EEG . . . 51
3.10 EEG lateralization topoplots with respect to slow and fast reaction times . . . . 51
3.11 Sensitivity map of the used fNIRS setup . . . 52
3.12 Grand average topoplot of HbO activation in experiment 1 . . . 53
3.13 Time seriesR2-value topoplots, left minus right trials, for fNIRS . . . 54
3.14 EEG lateralization topoplots for 16-channel montage . . . 55
3.15 Grand average topoplot of HbO activation difference in experiment 2 . . . 56
3.16 Evoked response in fNIRS signal to passive visual stimulation. . . 57
3.17 Experimental setup for multimodal EEG and pupillometry BCI . . . 61
3.18 Pupil size during CVSA — pilot data . . . 62
3.19 Grand average pupil size during CVSA . . . 63
3.20 Unimodal and multimodal classification accuracies . . . 63
List of Figures
4.1 Experimental design, visual protocol, stimulation setup . . . 73
4.2 Alpha power changes as a result of tACS in theα- orβ-band . . . 77
4.3 PSDs pre and post stimulation for single subjects . . . 78
4.4 Meanα-lateralization index span pre and post tACS . . . 79
4.5 Individualα-power lateralization index over time and topographical lateraliza-tion patterns . . . 80
4.6 Classification accuracy pre and post tACS . . . 83
4.7 Behavioral changes due to tACS . . . 83
4.8 Comparison of tACS-induced effects forα,βand no stimulation. . . 84
4.9 Simulations of the tACS-generated electric field (literature comparison) . . . . 85
List of Tables
2.1 Subject pairings . . . 19
3.1 Classification accuracies experiment 1 . . . 55
3.2 Classification accuracies experiment 2 . . . 56
Acronyms
α-LI α-power lateralization index.
ADL activities of daily living.
ANOVA analysis of variances.
BCI brain-computer interface.
BOLD blood oxygen level dependent.
CVA canonical variate analysis.
CVSA covert visuospatial attention.
DPF differential pathlength factor.
ECoG electrocorticography.
EEG electroencephalography.
EOG electrooculogram.
ERD event-related desynchronization.
ERP event related potential.
ErrP error-related potential.
ET eye tracker.
fMRI functional magnetic resonance imaging.
fNIRS functional near-infrared spectroscopy.
FPR false positive rate.
HbO oxygenated hemoglobin.
HbR reduced hemoglobin.
Acronyms
HD high definition.
IAB individual alpha band.
IAF individual alpha frequency.
IE interaction effect.
ITR information transfer rate.
LDA linear discriminant analysis.
LED light emitting diode.
LFP local field potential.
MEA micro-electrode array.
MEG magnetoencephalography.
MI motor imagery.
MRCP motor-related cortical potential.
PET positron emission tomography.
PLR pupillary light response.
PSD power spectral density.
RF random forest.
RT reaction time.
SEM standard error of the mean.
SSVEP steady state visually evoked potential.
tACS transcranial alternating current stimulation.
TMS transcranial magnetic stimulation.
VE validity effect.
VEP visually evoked potential.
1
Introduction
“Want to play hangman? asks Theophile, and I ache to tell him that I have enough on my plate playing quadriplegic. But my communication system disqualifies repartee: the keenest rapier grows dull and falls flat when it takes several minutes to thrust it home. By the time you strike, even you no longer understand what had seemed so witty before you started to dictate it, letter by letter. So the rule is to avoid impulsive sallies. It deprives conversation of its sparkle, all those gems you bat back and forth like a ball — and I count this forced lack of humor one of the great drawbacks of my condition.” — Jean-Dominique Bauby, The Diving Bell and the Butterfly
This quote above is from a book that Jean-Dominique Bauby has written while being in a locked-in state after a massive stroke and it showcases his frustration with the slow means of communication — depriving it of many of its most pleasant forms. His medical condition left him only in control of one of his eyelids and communication was bound to a caregiver spelling the letters of the alphabet and him twitching his eyelid at the letter of choice.
Locked-in patients, whose mind and memories are fully intact but their body completely paralyzed, are the archetype of people for whom we research and develop brain-computer interfaces (BCIs). These systems provide a direct link from brain activity to a computer, that could serve in a variety of actions: communication, controlling light, entertainment and positioning in the bed or wheelchair. Growing from this use as a replacement for lost body functions, BCIs have also proved their merits in neurological rehabilitation by coupling standard rehabilitation with the brain activity.
Even though the current state of the art is remarkably advanced to the technology Jean-Dominique Bauby had at his disposal, this technology does not work for everybody and is often — if it works — not accurate enough. For this reason, my thesis revolves around improving the decoding of one of the mental commands that can be used to build such BCIs: shifts in visual attention to one or the other side of the visual field, called covert visuospatial attention (CVSA).
Chapter 1. Introduction
to which brain imaging technologies have been used for BCI and discuss their individual advantages and disadvantages. Then, I will speak about the different electroencephalo-graphy (EEG)-based brain signals that have been exploited for BCIs. Further, I introduce covert visuospatial attention (CVSA) and its use in BCI before explaining my choice of BCI components. In the end I motivate the work in this thesis and give a brief overview of the conducted experiments.
1.1 Brain-computer interfaces
A BCI is a system designed to allow interaction between the brain — the seat of our conscious-ness and intentions — with the outside world, bypassing the motor pathways we usually rely on when communicating with our environment; be it in speech, writing, or with gestures and mimics (Wolpaw et al., 2002).
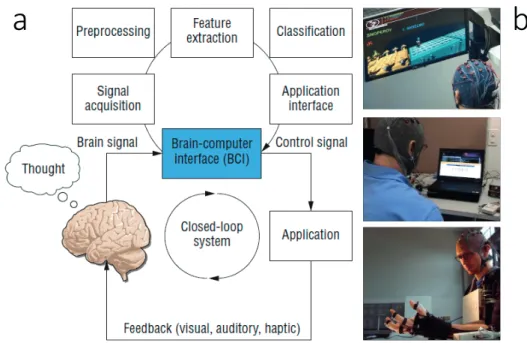
A BCI system needs multiple components to work hand in hand, some of which are user-dependent and some machine user-dependent (see Figure 1.1 for a graphical representation). First, we need the human to produce a mental command, i.e. a clearly defined thought, by engaging in a mental task, e.g. thinking of a specific movement (Curran and Stokes, 2003). As a next step, these brain signals must be acquired with a suitable brain imaging technology. In this thesis I mainly used the EEG, but there exist many more options (Min et al., 2010). Further, the acquired signal has to be preprocessed, i.e. cleaned from artifacts and noise to ensure the highest possible quality. Then we have to extract the specific features (or patterns) that are modulated by the mental command (Nicolas-Alonso and Gomez-Gil, 2012). These could be for example the amplitude in the EEG signal or the voxels that show increased blood flow in the functional magnetic resonance imaging (fMRI). Thereafter the extracted features need to be classified (matched) to one of the mental commands, e.g. imaginary left vs. right hand movement (Lotte et al., 2007). Once the mental command is decoded, it can be sent to the application interface, which transforms it into a pre-coded action. In the applications depicted in Figure 1.1 (b) this would mean that the computer game avatar jumps, or a letter is selected, or that the hand closes and grasps an object. With the application changing its state based on the decoded commands, the user gets feedback of how his mental command has been interpreted by the BCI. Given enough time, this allows the user to learn how to use the BCI, not unlike learning how to use a new tool (Perdikis et al., 2018).
1.2 Brain imaging technologies for BCI
In theory, every brain imaging modality which is able to pick up signals that can be voluntarily modulated by a person is a possible candidate for building a BCI. With this in mind, it is not surprising that many different modalities have been explored for the use of BCI, everyone with its own set of advantages and disadvantages.
In fact, the different methods can be divided into two distinct groups, based on the physiological 2
1.2. Brain imaging technologies for BCI
a
b
Figure 1.1 – Components and applications of BCIs. (a) Main components for a closed-loop BCI. The upper loop depicts the steps taken on the machine side of the BCI whereas the lower loop shows the implication of the user. (b) Three different applications for a BCI: a computer game (top), a spelling device (middle) and an exoskeleton for restoring grasp (bottom). Figure adapted from (Nijholt and Tan, 2008)
mechanism they are exploiting. The first group of brain imaging devices is based on cerebral hemodynamics: the more active a certain brain region is, the more need for oxygen and nutrients, and thus the higher the blood volume, as controlled by vasoconstriction and -dilation down to the capillary level (Jespersen and Østergaard, 2012). A common limitation of hemodynamics-based brain imaging devices is therefore a poor temporal resolution, resulting from the long delay (5-10 s) between the neuronal activity and the corresponding peak blood flow (Lindquist et al., 2009).
Positron emission tomography (PET) images blood flow via the concentration of a radioactive marker that has to be injected into the bloodstream before the measurement. This already rules the PET out for the continued use in a BCI, since regular radioactive injections would pose a serious health risk.
The fMRI, on the other hand, does not suffer from this disadvantage, since it measures blood oxygenation levels with magnetic fields. fMRI scanners offer noninvasive whole-brain imaging (cortical and subcortical structures) with an ever increasing spatial resolution (less than
1 mm3) thanks to the development of more and more powerful scanners (e.g. 7 Tesla). On the
downside, they are expensive, large and non-portable, and require the subject to lie still inside a constrained tube. Additionally, fMRI-scanners also have a high cost of maintenance due to their requirement of liquid helium cooling. Over the years, fMRI has proven to be a viable
Chapter 1. Introduction
modality for BCI (Weiskopf et al., 2004a; Yoo et al., 2004; Weiskopf et al., 2007) but it continues to be used more in the realm of basic neurofeedback studies (Weiskopf et al., 2004b; Shibata et al., 2011; Sitaram et al., 2017). This makes sense when considering that the therapeutic effect of neurofeedback should carry on after a session, while being enclosed in an fMRI-tube is quite bothersome for assistive BCI applications as compared to a cap that has to be worn. The third wide-spread device for monitoring blood circulation is the functional near-infrared spectroscopy (fNIRS), which uses the absorption properties of hemoglobin for near-infrared light to extract relative changes in blood oxygenation (see Chapter 3.2 for details). fNIRS devices are comparably cheap, mobile (can be integrated into a cap with wireless data link) and robust to body motion, as long as the light emitters and detectors do not move in place. On the downside, the fNIRS allows only to image the outer layer of the cortex, and has a more crude spatial resolution of approximately one cm, even though new multiprobe systems try to remedy this by combining information from multiple light paths. Another factor is that hair absorbs a large amount of the near-infrared light, and so, recording brain activity below thick hair requires a long and very careful setup. fNIRS enjoyed a surge in experimental BCIs from the 2010’s on (Tai and Chau, 2009; Bauernfeind et al., 2011; Naseer et al., 2014; Weyand et al., 2015; Shin et al., 2016).
The second group of brain imaging technologies is based on the electric and electromagnetic fields generated by the activity of single neurons or whole populations of them. Single-cell spiking (axonal firing) and local field potentials (LFPs) can be recorded with implanted micro-electrode arrays (MEAs), the best known representative being the Utah-array (Maynard et al., 1997). These electrode arrays have a very high temporal resolution and signal-to-noise ratio and allow to map very complex commands to the recorded firing rates, e.g. freely moving a robot arm (Hochberg et al., 2012), typing on a virtual keyboard (Jarosiewicz et al., 2015) or restoring reaching and grasping functions with electrical muscle stimulation (Ajiboye et al., 2017). The downsides of this technology are ethical and medical concerns, since the electrode array has to be placed via open brain surgery which comes with an infection risk. Further, the pins are placed directly into the upper cortical layer, and thus are hurting the neuronal tissue and provoke scar formation (Polikov et al., 2005; McConnell et al., 2009). Finally, they also only allow a limited brain coverage.
A slightly less invasive recording technique is electrocorticography (ECoG), where arrays of flat metal electrodes embedded in a polymer layer, are placed either directly on the cortical surface (subdural ECoG) or on top of the dura mater (epidural ECoG). Historically, ECoG was developed to exactly localize epileptogenic zones (the starting point of seizures) prior to surgical removal (Reif et al., 2016). But many studies have shown the merits of ECoG as a sensing modality for BCI (Leuthardt et al., 2004; Leuthardt et al., 2006; Schalk et al., 2008). The recorded oscillatory activity of neuron populations is hardly attenuated by the tissue in between, which allows a high signal-to-noise ratio while the surgical placement of the electrodes is already done minimally invasive. Intense efforts have been undertaken in the last years to push for the implantation of ECoG solely for the purpose of BCI and current systems
1.3. Mental commands for EEG-based BCIs
are designed to remain inside the skull for life (Mestais et al., 2015; Romanelli et al., 2018). The noninvasive pendant to the ECoG, and the father of all BCI modalities, has been the EEG (Farwell and Donchin, 1988; Wolpaw et al., 1991). The technology behind the EEG is rather simple and the first human EEG recordings of Hans Berger had taken place already more than 90 years ago (Collura, 1993). But the simple amplification of the potential difference between two metal electrodes has been improved up to today’s standards, where we are able to record up to 256 channels simultaneously, with less noise due to active preamplification inside the electrodes themselves and can receive the signals wirelessly, making the subject truly mobile. Thus the EEG remains one of the most affordable brain imaging technologies, and offers a very good temporal resolution while at the same time being noninvasive. Being a noninvasive technique, it also can be used without ethical and medical concerns. The downsides of the EEG are the limitation to image mainly cortical structures, the low spatial resolution and low signal-to-noise ratio, as well as the high susceptibility for electrical artifacts generated by eye movements or muscle activation of e.g. the tongue or neck (Muthukumaraswamy, 2013). Lastly, also magnetoencephalography (MEG) can be used for BCI applications (Mellinger et al., 2007; Bahramisharif et al., 2010; Horschig et al., 2015). The MEG measures the magnetic fields generated by neuronal activity noninvasively. The big advantage over the EEG is the high spatial resolution (2-3 mm) and the opportunity to image deeper brain regions, both possible because, differently than the electric fields, the magnetic fields are not attenuated by the tissue they are passing through. On the downside, traditional MEG devices were expensive, immobile, required liquid helium cooling and a magnetically shielded room. Very recently though, Boto et al. (2018) developed a new technology that allows for a head-mounted (and thus mobile) MEG, albeit some magnetic shielding is still necessary at this point.
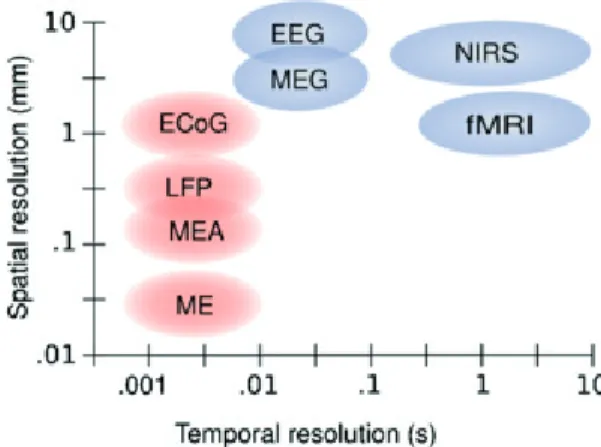
Figure 1.2 shows an overview over the temporal and spatial resolution of each of the discussed brain-imaging modalities. For the research presented in this thesis I decided to use the EEG as my main recording device. The noninvasiveness allows for the inclusion of healthy subjects and larger patient populations, it allows a high temporal precision and enough spatial resolution to pick up the desired signals (see Section 1.4), and all that for a relatively low cost.
1.3 Mental commands for EEG-based BCIs
As mentioned before, a BCI is a system that uses a brain imaging modality — here the EEG — to decode voluntary changes in brain activity. Over time, multiple different mechanisms have been found that lead to stable and reproducible modulations, large enough to be picked up by the EEG. Such modulations can be either a voluntary response to an external stimulus (evoked signals) or the result of a self-initiated mental task (endogenous signals).
Chapter 1. Introduction
Figure 1.2 – Temporal and spatial resolution of different brain imaging modalities. Micro-electrodes (ME) are not described independently from microelectrode arrays (MEA) in the text, but operate under the same principles. Both can record single-neuron spiking activity as well as LFPs. While the spatial resolution of the PET is on the same range as the one of the fNIRS, the temporal resolution on the scale of tens of seconds, would place it to the right of the graph. Invasive methods are depicted in red, noninvasive methods in blue. Picture taken from (Van Gerven et al., 2009)
1.3.1 Evoked signals
Sensory, perceptual or cognitive processes produce specific wave forms in the EEG in response to different external stimuli. Such neuronal correlates to external events are subsumed under the title of event related potentials (ERPs) and are defined as a well defined amplitude change in the cortical electrical signal which is generated in response to sensory, cognitive or motor events (Woodman, 2010). Different external events lead thereby to ERPs in different brain areas.
Visually evoked potentials (VEPs) are waveforms in the occipital cortex (over the visual areas) that comes as a response to a visual stimulus, mostly rapid luminosity changes (Curtis, 1940). Since this response is involuntary and cannot be modulated, an extension of that phenomenon is used for BCI, the steady state visually evoked potential (SSVEP). For recording SSVEPs, a flickering light of a stable frequency is attended to by the subject, which induces a rhythmic train of VEPs at this exact frequency (Müller-Putz et al., 2005; Wang et al., 2006). When placing multiple flickering lights — each with its own, unique flicker frequency — in the visual field, the VEP-frequency recorded in the EEG will be the one of the attended target. This means, that attention (covert or overt) to the target stimulus can be decoded and used for controlling a BCI (Kelly et al., 2004; Ordikhani-Seyedlar et al., 2014). The SSVEP is a very robust and large signal, and allows high information transfer rates (ITRs) (Chen et al., 2015). However, the flickering lights are very arduous for the eyes and are thus usually not suitable for long continuous applications.
Error-related potentials (ErrPs) are observed after self-generated or observed errors over 6
1.3. Mental commands for EEG-based BCIs
frontocentral brain areas (Falkenstein et al., 2000). BCIs based only on ErrPs have been presented by Ferrez and del R. Millán (2008), Chavarriaga et al. (2014) and Iturrate et al. (2015). A more natural inclusion of ErrPs into the BCI framework is to use the generated potential as a correction mechanism, e.g undoing the last choice taken by the BCI classifier (Schalk et al., 2000; Schmidt et al., 2012; Spüler et al., 2012)
A third type of ERP is the so-called P300 signal, named after the prominent positive peak forming around 300 ms after the external stimulus (Donchin and Smith, 1970). This potential is the largest over centroparietal areas and is elicited by the occurrence of a wanted, but rare
event — theoddball(Fabiani et al., 1987; Farwell and Donchin, 1988; Polich and Kok, 1995).
Such oddball paradigms have been widely used in BCI, for example for spellers (Cuntai et al., 2004; Krusienski et al., 2008), robotic arms (Palankar et al., 2009) and telepresence robots (Escolano et al., 2010). P300-based BCI are the one of the most successful ones to date with a high ITR and very reliable detection of the intended command (Müller-Putz et al., 2005; Müller-Putz and Pfurtscheller, 2008; Guger et al., 2009).
A common downside of evoked potentials as input signal for a BCI is the dependency on external stimulation: either flickering lights, oddball stimuli or generated errors. The con-tinuous sensory input necessary to use such type of BCIs can grow tiring very quickly — independent of the sensory pathways used — and thus decrease concentration. A further disadvantage is the high variability in amplitude of the evoked potential, so that current implementations always average over several occurrences to get a stable classification. And finally, it is hard to design a self-paced BCI paradigm with evoked signals, since they are elicited automatically as a response to the stimulus, and as such, the user cannot decide freely when to start or stop sending a command.
1.3.2 Endogenous signals
Endogenous signals, on the other hand, theoretically allow a completely self-paced use of the BCI since the patterns are generated by engaging in a mental task. Arguably the best explored and most widely used mental task is motor imagery (MI), the kinesthetic imagination of a movement (Decety and Ingvar, 1990). The usual MI tasks are the imagination of opening and closing the hand, lifting or wiggling the feet and swallowing or moving the tongue (Pfurtscheller
et al., 2006). The imagined movement leads to a decrease in oscillatoryα- andβ-band power
over the corresponding areas in the motor cortex, called an event-related desynchronization (ERD) (Pfurtscheller and Lopes Da Silva, 1999). MI has been widely used in a vast collection of BCI applications like spellers (Perdikis et al., 2014), wheelchairs (Carlson and Millán, 2013), drones (LaFleur et al., 2013) exoskeletons (Randazzo et al., 2018) and computer games (Perdikis et al., 2018). Further, MI BCIs enable successes in neurorehabilitation when coupled with robotic devices or functional electrical stimulation (Ang et al., 2011; Ang et al., 2015; Biasiucci et al., 2018).
Chapter 1. Introduction
(MRCPs) are negative potential changes related to a voluntary movement onset, hence their
other name Bereitschaftspotential(readiness potential in English), as it appears when a
participant is prepared to execute a movement (Kornhuber and Deecke, 1965). This allows the conscious act of preparing (to execute) a movement to function as a command for BCI control (Gu et al., 2009; Garipelli et al., 2013; Xu et al., 2014; Jiang et al., 2015).
An interesting research field concerns music (Schaefer et al., 2011a; Schaefer et al., 2011b) or speech imagery (DaSalla et al., 2009; Brigham and Kumar, 2010; Wang et al., 2013), which generates signals mostly over the temporal cortices. Specifically speech imagery would be the perfect match for a BCI speller, if thought words could be directly decoded and communicated by the computer. Even though promising steps have been taken in the right direction, it is still a long way until reaching this overarching goal (Leuthardt et al., 2011; Martin et al., 2016). Finally, also the visual cortices can generate endogenous signals by shifting visuospatial attention, as described in detail in the next section. A comprehensive review of the different BCI systems published can be found in Hwang et al. (2013).
1.4 Covert visuospatial attention
As humans, we are mainly visual animals, relying heavily on our eyesight for movements and spatial orientation. CVSA is defined as the direction of attention to a locus in the visual field that is different from the point of gaze. In laymen terms, this is often referred to as looking at something "out of the corner of one’s eyes". We naturally rely on this function — even though most of the time unconsciously — for deciding on the locus of the next visual fixation (Posner, 1980; Findlay, 1997; Eimer et al., 2006; Van der Stigchel and Theeuwes, 2007), planning arm movement trajectories (Baldauf and Deubel, 2010; Hesse and Deubel, 2011) and keeping track of more than one object of interest in the visual field (Mangun and Buck, 1998).
Posner (1980) was the first one to show that shifting the visual attention covertly to a target area decreases the reaction time to events in this region, while simultaneously increasing the reaction time for events in other, non-attended areas. This showed that attention is a limited resource that cannot cover the entire visual field equally. Thereby it is still debated if CVSA is an independent cognitive mechanism or closely related to the planning of motor actions, like eye saccades or hand reaching. The latter reasoning is denominated the "premotor theory of attention" and was publicized by Rizzolatti et al. (1987). It quickly gained a large following due to its simplicity, the fact that CVSA experiments indeed required a motor response after the attention shift, and lastly it also provides an explanation to the natural role of CVSA. Nevertheless, also this theory has been challenged, especially with the rise of neuroimaging technologies that found — all shared networks aside — differences between the structures activated in attention shifts and saccades (Crawford and Muller, 1992; Corbetta et al., 1998). Covert shifts of attention can be either elicited by external stimuli or by a voluntary internal process. This has been studied with two types of visual cues, preceding the appearance of 8
1.4. Covert visuospatial attention
a target stimulus: direct and symbolic cues. Direct cues appear at the same location as the target stimulus, and involuntarily draw attention to this area (Corbetta and Shulman, 2002). They have the greatest effect on reaction times if the time difference between the cue and the target appearance is around 100 ms (Müller and Findlay, 1988; Adam et al., 2000). Shorter time intervals do not allow for a sufficient shift in CVSA while for longer intervals (above 200 ms) the directed attention is again withdrawn from the cued location(Müller and Rabbitt, 1989). Symbolic cues, on the other hand, are usually presented centrally (or even in another sensory modality, like sound) and hold information about the location of the upcoming target in a
form that needs cognitive decoding, e.g. an arrow, a shape, a color or the spoken wordsleft
orright. The attention shifts after symbolic cues appear significantly later than with direct cues and they reach their maximum effectiveness from around 300 ms onwards (Müller and Findlay, 1988; Müller and Rabbitt, 1989). This can be contributed to the fact that symbolic cues first need to be interpreted before the attention shift can be initiated (Corbetta and Shulman, 2002). Additionally, these voluntary covert shifts of attention can last for a much longer time (Posner et al., 1987; Thut et al., 2006).
Lesion studies on people who displayed symptoms of inability to covertly direct their attention after trauma or stroke allowed first insights of the implication of specific brain areas in an
visual attention network(Posner et al., 1987; Mesulam, 1999; Corbetta et al., 2005). A lead symptom in many of the affected patients is the so-called hemispatial neglect syndrome, a condition in which awareness of stimuli is reduced on one side of the visual field (Parton et al., 2004). In extreme cases, this can lead to a complete disregard of anything on that side, may it be visual information, sound or their own body (Marshall and Halligan, 1988; Corbetta et al., 2005; Corbetta and Shulman, 2011; Schindler and Bartels, 2013). Even though the remaining visual field is comparable to patients with hemianopsia, visual neglect is a more devastating condition as patients are in most cases not aware of their deficit, and thus do not move their head to bring things into their visual field. Affected individuals therefore often need continuous care because they are susceptible to falls, wheelchair collisions, and do not groom or dress their neglected body half (Appelros et al., 2002). Karnath and Rorden (2012) point out the connection of certain stroke-affected brain areas with different cardinal symptoms of spatial neglect: the perisylvian network (superior/middle temporal, inferior parietal, ventrolateral frontal cortices) with egocentric spatial neglect, the posterior (and potentially inferior) parietal cortex with allocentric spatial neglect and the temporo-parietal junction with symptoms of extinction (see also De Schotten et al. (2011)). Schindler and Bartels (2013) showed that the brain regions correlating with covert visual attention are also the ones active in egocentric spatial representation tasks. This demonstrates the complexity
of thevisual attention network(Corbetta and Shulman, 2011), and foreshadows the problems
encountered when rehabilitation is attempted. At the moment, a variety of therapy methods
are in use. Behavioral therapies, likescanning, target mostly building helpful habits for reading,
eating and other activities of daily living (ADL), whileprism adaptationandsmooth pursuit
eye movementtry to shift the center of optical representation in the brain (Kerkhoff et al., 2013; Kerkhoff et al., 2014; Rossetti et al., 1998). For an extensive review of current therapies for
Chapter 1. Introduction
hemispatial neglect see Yang et al. (2013) or Klinke et al. (2015). Unfortunately, the results of current therapies are not consistent and the need to find new methodological interventions is urgent.
Figure 1.3 – Visual scanning patterns of neglect patient. Exemplary visual scanning path (in red) of a patient with hemispatial neglect syndrome, when instructed to attentively study the picture in detail. It is obvious that the left half of the picture was neglected. Figure adapted from (Karnath, 2015)
Based on these lesion studies, noninvasive brain imaging advanced our understanding of the
components of thevisual attention network, be it using PET (Corbetta et al., 1993; Nobre et al.,
1997) or fMRI (Kastner et al., 1999; Beauchamp et al., 2001). But shifts in attention, either overt or covert, do not only produce hemodynamic correlates. Worden et al. (2000) were the
first to report an increase in the power ofα-oscillations in the hemisphere opposite to the
attended side. Further, they already reported anα-power distribution that fits the retinotopic
organization of the visual cortex, with lowest powers observed over the cortical area which corresponded to the locus of attention (Figure 1.4). This discovery was corroborated and refined in many studies to come (Sauseng et al., 2005; Kelly et al., 2006; Thut et al., 2006; Rihs
et al., 2007; Bahramisharif et al., 2010). Sinceα-oscillations are believed to play a crucial
role in the suppression of sensory input to many different cortical areas (Kerlin et al., 2010; Romei et al., 2010; Banerjee et al., 2011; Ciavarro et al., 2013), the observed shift in occipital
α-power during CVSA is less the product of increased sensitivity of neurons corresponding to
the attended area but rather the active suppression of stimuli from other areas (Jensen and Mazaheri, 2010; Foxe and Snyder, 2011).
The retinotopic layout of the CVSA-inducedα-patterns allows — at least in theory — the
decoding of the exact attended point in the visual field. This, of course, made CVSA an interesting mental task to explore for the use in BCIs, especially since the internal attention shifts do not depend on any motor functionality and thus could also be deployed by completely locked-in patients. In the following section I give a brief overview of CVSA BCIs based on the EEG.
1.5. Covert visuospatial attention BCIs
Figure 1.4 – Retinotopic organization ofα-power during CVSA. The center head shows that
the overall average distribution ofα-band power is concentrated over the parietooccipital
areas. The small heads show theα-power distribution during spatial attention to targets at 16
different locations on a 2D screen. The head location with respect to the center reflects the location of the target with respect to the central fixation point. The inversion of the
parieto-occipitalα-pattern between left and right side covert attention is clearly visible (increases in
red, decreases in blue). Figure adapted from (Bahramisharif et al., 2010)
1.5 Covert visuospatial attention BCIs
The first uses of CVSA in the realm of BCI was the discovery that SSVEP BCIs also work if the flickering stimulus is only attended covertly, which opened up this type of systems for people with gaze fixation problems (Kelly et al., 2005), albeit the decoding accuracy dropped about 20% compared with overt attention to the flicker stimuli (Kelly et al., 2004). Later, Brunner et al. (2010) and Treder and Blankertz (2010) have shown that the widely-used P300 spellers depend heavily on the eye fixation on the target letter. This finding entailed further research on how to optimize spellers that work when the target letters are attended covertly only. They showed that covert attention to the tharget creates a sufficiently large P300 potential when the letters are regrouped the center in a circular or hexagonal fashion (Liu et al., 2011; Treder et al., 2011b; Aloise et al., 2012; Schaeff et al., 2012). Liparas et al. (2014) have ultimately also
Chapter 1. Introduction
created a BCI that could decode the side of a covertly attended stimulus from the shape of the resulting VEP.
Even though BCIs based on evoked potentials display very high classification accuracies, they are still inherently limited by their dependence on external stimuli. This downside might be outweighed by the good performance for short tasks like spelling a text message, but it does not allow for the same effortless and natural integration as do endogenous control signals. For this reason, decoding the locus of covert attention from the topographical pattern of the occipital
α-power was a logical step forward. The first ones to report decoding of covert attention from
α-power were Van Gerven and Jensen (2009) using MEG. Following, proof-of-principle BCIs
have been developed also with EEG signals (Treder et al., 2011a; Tonin et al., 2012; Roijendijk et al., 2013). Usually, the time of continuous covert attention to the target was chosen on the scale of a couple of seconds, but Gunduz et al. (2012) and Belyusar et al. (2013) showed that it
is possible to decodeα-power lateralization on a timescale of a few hundred milliseconds in
ECoG and EEG respectively. Shortly thereafter, online BCIs had been developed using fMRI (Andersson et al., 2012; Andersson et al., 2013a), EEG (Treder et al., 2011b; Tonin et al., 2013) and MEG (Horschig et al., 2015; Okazaki et al., 2015).
The dominant visual protocol in these studies used a central fixation and two target areas to the left and the right. A symbolic cue in the center indicates the side that the target will appear on, and for the most part, the actual target appearance is linked to either a reaction time or visual discrimination task. Nevertheless, there were protocols operating with four (Van Gerven and Jensen, 2009; Andersson et al., 2012) and six different target positions (Treder et al., 2011b; Treder et al., 2011a). A good review covering visual attention based BCIs in further detail can be found in Astrand et al. (2014).
Aside from the use as an assistive technology (e.g. spellers, exoskeletons, electric stimulation), there have been first attempts made explore the effect of real-time feedback of an CVSA-based BCI for rehabilitation in spatial neglect. While for post-stroke motor rehabilitation the role of BCIs is fairly well defined as the facilitation of motor learning through direct feedback on cortical activity, the matter is distinctly more difficult for hemineglect. Kinsbourne (1987) established the model of spatial attention as a balance of constant hemispheric rivalry which can be disrupted in the event of a stroke. Further evidence for this theory came from observed correlation between spatial orientation bias and an imbalance in the activation of the dorsal
parietal cortex (Corbetta et al., 2005) as well as inα-power in the anatomically unaffected
occipital cortex (Newman et al., 2013). For that reason, this interhemispheric imbalance stands in the focus of current rehabilitation research. Transcranial magnetic stimulation (TMS) of parietal and occipital areas has proven to affect visuospatial attention (Thut, 2014) and to alleviate symptoms of unilateral neglect (Cazzoli et al., 2012). Further, Robineau et al. (2014) recently reported successful hemispheric rebalancing through fMRI neurofeedback
on occipital (α-) activity while Tonin et al. (2017) showed similar results after EEG-based
closed-loop BCI training.
1.6. Choice of BCI and limitations
1.6 Choice of BCI and limitations
MI-based BCIs have already demonstrated their value in motor rehabilitation after cerebral lesions (Ang et al., 2015; Pichiorri et al., 2015; Biasiucci et al., 2018). Since, as mentioned before, the current state of rehabilitation for patients with hemispatial neglect syndrome is not satisfactory, there is the hope that BCI-aided rehabilitation can alleviate this condition. This was my main motivation for the research work in this thesis. Taking into account the advantages and disadvantages of the different possibilities for the BCI components, I decided to concentrate my efforts on EEG-based CVSA BCI. In the following I want to explain my choices by distilling the important points of the previous sections that covered the state of the art.
Starting with the brain imaging modality, I decided to mainly use the EEG, complemented by the fNIRS (see Section 3.2). Even though the EEG does not present the same spatial resolution as implanted electrodes or the newest generations of fMRI scanners, it has the large advantage of being lightweight, wireless and mobile. Although patients with restraining disabilities would (and do) agree to the implantation of electrodes, a noninvasive brain imaging modality is more versatile, practically risk-free and can thus be also perfectly integrating in hospital- or home-based rehabiliation, where the goal is to reach functional independence (i.e. getting rid of technologies such as the BCI).
Also my decision to not rely on evoked potentials of any kind, can be justified from both, an assistive and rehabilitative use case. As already mentioned, protocols for evoked potentials need to constantly present stimuli in a sensory modality, mostly in the visual domain, and this gets exhausting very soon. Further, endogenous signals can be trained and thus the use of the BCI becomes a more natural interaction. When considering rehabilitation, the role of a BCI is to restore the action-feedback loop that is disrupted in these patients. For motor rehabilitation this means that motor-related commands are linked to functional electrical stimulation that contracts the muscles and therefore produced sensory feedback to the motor areas. In the case of hemispatial neglect, the idea is to present visual stimulation at times when
the covert attention is (relatively) good. Also for this, the endogenous shift inα-oscillations is
the preferred candidate.
A major drawback of using CVSA as a mental command for BCIs is that the decoding accuracy does not reach the levels that can be obtained with evoked potentials, or even other endogenous signals like MI (Ahn and Jun, 2015). Especially in rehabilitation, we want to make sure that the brain patterns get decoded correctly, not to erroneously enforce undesired neuronal activity. Further, BCI users get discouraged if the system error rate is too high, i.e. when they feel that the BCI chooses commands randomly and not based on their input. From a purely statistical viewpoint, a performance above the 95% confidence interval of a random classifier can be interpreted as information transfer. While this boundary lies at around 60% in a two-class BCI (dependent on the number of trials), participants usually only report the feeling of being in control when they achieve accuracies of around 70% in a binary task (Kübler et al., 2004;
Chapter 1. Introduction
Fard and Grosse-Wentrup, 2014). The fact that the reported mean accuracies in two-class BCIs using covert attention lie around 70% (Van Gerven and Jensen, 2009; Tonin et al., 2012; Tonin et al., 2013; Horschig et al., 2015) means that about half of the BCI users did or would not feel in control. So, before we can dedicate our time and energy to explore the most beneficial BCI paradigms and setups for the rehabilitation of spatial neglect, we first need to improve on the current decoding accuracies.
1.7 Thesis aims and outline
The main aim of this thesis was to raise the binary classification performance in CVSA BCIs to achieve a more reliable command interpretation and to enable people who are not in control with the current systems to use such a BCI. Since the state of the literature did not favor a specific direction to achieve this goal, I decided to investigate three complementary approaches: (i) giving real-time feedback to allow the subjects to adapt and improve the patterns generated by their mental commands, (ii) combining the EEG with a complementary sensing modality to get richer information about the brain state and (iii) using noninvasive
brain stimulation to increase theα-lateralization patterns during CVSA (Figure 1.5).
How can we improve the performance of a CVSA BCI? Multimodal sensing Brain stimulation Real-time feedback
Figure 1.5 – Thesis chapters outline. The question of how to improve classification perfor-mance for CVSA BCIs was approached in three different ways, each described in a chapter of this thesis.
Chapter 2 (Real-time feedback) The goal of this study was to investigate the impact of continuous real-time feedback on the behavioral and BCI performance. I hypothesized that closing the loop between user and machine will allow for an adaptation of the user-generated brain activity to maximize the outcome, as presented with the feedback. To this end I designed and conducted the first blinded crossover EEG study which compared real-time feedback
on the occipitalα-power lateralization with sham feedback. I report on this process and on
the subsequent behavioral, electrophysiological and BCI results, which showed significant 14
1.7. Thesis aims and outline
positive effects of the real-time feedback on the behavior but not on theα-power lateralization.
Chapter 3 (Multimodal sensing) Compared to Chapter 2, where the increase in classification performance is an effect on the user side, in this chapter we illuminate the addition of other sensing modalities to the EEG in order to allow for better decoding accuracies. This puts the weight of enhanced performance on the machine side of the system. In the first part I assess the combination of EEG with fNIRS, report the challenges in the integration of the two modalities and the final negative outcomes which led to cease this approach. The second part discusses the fusion of EEG and pupillometry data into a hybrid BCI, the necessary adaptations in the visual protocol and the promising results that showed an increase in mean and maximal classification accuracy as well as in the number of subjects above chance level.
Chapter 4 (Brain stimulation) The idea of this chapter was to use noninvasive brain stimu-lation to enhance the neural substrate that is modulated by CVSA, and thus allow for better classification. I developed and conducted a double-blinded crossover study testing the effects
of transcranial alternating current stimulation (tACS) in the individualα- orβ-band on the
baselineα-oscillations and the subsequent modulations during CVSA. I describe the design
and implementation of this study and discuss possible reasons why the stimulation did not
lead to substantial differences between the two groups, nor compared with ano stimulation
condition that was added in an additional experiment.
Chapter 5 (Discussion and conclusion) In the end, I summarize the findings of this thesis, highlight their contribution to the current state-of-the-art and discuss ideas to expand the presented research in the future.
Partial results of this chapter have been submitted inSchneider, C., Pereira, M., Tonin, L., Millán, JdR., 2018. Real-time EEG feedback on alpha power lateralization leads to behavioral improvements in a covert attention task. NeuroImage
2
Real-time feedback
Visual attention can be spatially oriented, even in the absence of saccadic eye-movements, to facilitate the processing of incoming visual information. One behavioral proxy for this so-called covert visuospatial attention (CVSA) mechanism is the validity effect (VE): the reduction in reaction time (RT) to visual stimuli after valid spatial cues, compared to the increase in RT to stimuli after invalid cues. At the electrophysiological level, one correlate of CVSA is the lateralization in the occipitalα-band oscillations, resulting fromα-power increases ipsilateral and decreases contralateral to the attended hemifield. While thisα-band lateralization has been considerably studied using electroencephalography (EEG) or magnetoencephalography (MEG), little is known about whether it can be trained to improve CVSA behaviorally. In this cross-over sham-controlled study we used continuous real-time feedback of the occipitalα-lateralization to modulate behavioral and electrophysiological markers of covert attention. Fourteen subjects performed a cued CVSA task, involving fast responses to covertly attended stimuli. During real-time feedback runs, trials extended in real-time if subjects reached states of highα-lateralization. Crucially, the ongoingα-lateralization was fed back to the subject by changing the color of the attended stimulus. We hypothesized that this ability to self-monitor lapses in CVSA and thus being able to refocus attention accordingly would lead to improved CVSA performance during subsequent testing. We probed the effect of the intervention by evaluating the pre-post changes in the VE and theα-lateralization. Behaviorally, results showed a significant interaction between feedback (experimental – sham) and time (pre – post) for the validity effect, with an increase in performance only for the experimental condition. We did not observe significant pre-post changes in theα-lateralization, but a negative correlation between the feedback-driven changes in behavior and electrophysiology. Our findings suggest that real-time feedback on the α-lateralization is a promising tool to enhance the level of covert visuospatial attention. This opens up the exploration of applications of the proposed training method for the rehabilitation of hemispatial neglect and other attentional disorders.
Chapter 2. Real-time feedback
2.1 Introduction
We can enhance our sensitivity to an upcoming visual stimulus by paying attention to its location in our visual field, even when the location is not foveated (Posner, 1980; Desimone and Duncan, 1995; Thut et al., 2006). This state, when the focus of visual attention is different from the point of gaze, is referred to as CVSA (Posner, 1980). Such shifts of attention are accompanied by modulations in the power of occipital cortical oscillations, primarily in
theα-band between 8 and 14 Hz (Sauseng et al., 2005). The spatial pattern ofα-oscillations
produced by the visual attention follows the retinotopic organization of the visual cortex (Engel
et al., 1997; Kelly et al., 2006; Rihs et al., 2007). During CVSAα-oscillations desynchronize
in the hemisphere contralateral to the attended hemifield and synchronize in the opposite hemisphere (Sauseng et al., 2005; Thut et al., 2006; Foxe and Snyder, 2011). These modulations have been used to command a brain-computer interface (BCI) by attending to one or the other hemifield (Treder et al., 2011b; Tonin et al., 2013; Horschig et al., 2015).
At the behavioral level, researchers showed thatα-power lateralization is indicative of the
perception of faint visual stimuli (Van Dijk et al., 2008) and that it varies in accordance with the RT (Thut et al., 2006). However, increased sensitivity at the attended location means in turn a decreased sensitivity for other areas. This can be studied with invalid cueing, where a stimulus appears at a location different from what was indicated by a spatial cue (Posner, 1980; Vossel et al., 2006). In such invalid trials, subjects react slower and are less accurate on discrimination tasks, not only compared with valid cues, but also compared to no cue at all (Rizzolatti et al., 1987; Gitelman et al., 1999; Sauseng et al., 2005). This so-called VE is also referred to as the cost of reorienting attention (Rizzolatti et al., 1987; Corbetta et al., 2000),
supporting the theory thatα-oscillations are a suppression mechanism, reducing the weight
of stimuli in unattended areas (Jensen and Mazaheri, 2010; Foxe and Snyder, 2011).
There is evidence that neurophysiological processes of visual attention can be experimentally modulated with noninvasive brain stimulation (Bestmann et al., 2007; Thut and Miniussi, 2009; Romei et al., 2010). Alternatively, neurofeedback has shown its potential for endogenous mo-dulation of brain correlates of covert attention: Scharnowski et al. (2012) and De Bettencourt et al. (2015) have modulated visual discrimination performance and stimulus perception by training with real-time functional magnetic resonance imaging (fMRI) feedback, while Okazaki et al. (2015) used feedback based on MEG. However, to the best of our knowledge, no study has yet attempted to modulate RT using real-time feedback.
Therefore, we set out to study whether continuous closed-loop feedback based on the occipital
α-power lateralization in a CVSA task has the potential to (i) modulate CVSA – as indexed
by the VE based on the RTs – and (ii) amplify the lateralization in theα-band. Additionally,
since an amplifiedα-power lateralization means that attention shifts to the left and right
hemifield produce more contrasting brain patterns, we also expect to (iii) see improvement in the single-trial classification accuracy.
2.2. Materials and Methods
2.2 Materials and Methods
2.2.1 Participants
Fourteen healthy subjects, age 23±1.52 years, with normal or corrected to normal vision
took part in the study. All gave informed written consent and received course credits for
their participation. The study was covered by the ethical protocol No PB_2017-00295 of the
ethical commissions of the cantons of Vaud and Geneva, Switzerland and confirmed with the standards of the Declaration of Helsinki (World Medical Association, 2013).
2.2.2 Experimental protocol
The study involved recordings on three different days — 51.5±17.7 (minimum 16) and 12.7±6.5
(minimum 7) days apart, to limit carry-over effects to following sessions. One recording session lasted approximately 90 minutes, including the technical setup. Time on task was less than 40 minutes per session, with breaks after each run (every 9-10 minutes).
On the first recording day subjects practiced for one run to familiarize with the task. Then they performed four offline runs (no feedback) to calibrate their individual decoder for the
real-time feedback (Figure 2.1A). On day two and three theα-power lateralization index (α-LI)
feedback was administered in a single-blinded crossover design. Subjects were paired based
on their meanα-LI and their mean RT during day one while keeping the resulting groups
balanced (Table 2.1). Then one member of each pair was randomly assigned to either receive
real or shamα-LI feedback on day two and then switched the feedback group on day three.
Therefore, both days had the same run structure: they started and ended with one offline run, while the real-time feedback was given during two middle runs.
reaction times α-LI span
Group A Group B Group A Group B
Pair 1 463 ms 392 ms 0.090 0.108 Pair 2 440 ms 410 ms 2.590 0.988 Pair 3 468 ms 423 ms 0.359 1.380 Pair 4 403 ms 452 ms 0.176 0.248 Pair 5 378 ms 428 ms 0.076 0.294 Pair 6 342 ms 425 ms 0.009 0.284 Pair 7 398 ms 374 ms -0.054 0.061 Average 413 ms 415 ms 0.464 0.480
Table 2.1 – Table of subject pairs and groups. Subjects were paired with respect to reaction
times and their α-power lateralization index, with each partner receiving the real-time
feedback (RT FB) either on day two or three. Both groups are well balanced in terms of both variables. The gray entries indicate the subject which was removed from all post-hoc analysis due to excess artifacts.
Chapter 2. Real-time feedback
Offline paradigm
Each trial started with the presentation of a gray central fixation point at 0.5° visual angle and subjects were instructed to neither move nor blink until the trial was over. After one to two seconds (random duration), a cue – corresponding to the task to perform – was presented for 100 ms: half a circle (line width 0.1°, radius 2°) to the left or to the right indicated the side to attend to, a full circle around the fixation point indicated a central fixation trial (no covert attention shift). This was followed by the sustained attention phase – one to five seconds – where subjects were instructed to covertly attend to the target placeholder indicated by the cue. Target placeholders were circles with an inscribed cross (line width 0.2°, radius 2°, centered at 12° extremity from the center point and at a downward angle of 30° from the horizontal midline; Figure 2.1B). To be consistent with the real-time feedback runs where
color represented the decodedα-LI (see below), the color of both target placeholders varied
randomly between isoluminant red and green (L*a*bcolor space (CIELAB),Landbconstant,
avaried between -80 and 80). A trial ended when the inscribed cross disappeared in the
to-attend target (valid cue) or on the opposite side (invalid cue). Subjects were instructed to react to the trial end as fast as possible with a button press using the right index finger. The inter-trial interval was 2-3 seconds long.
Real-time feedback paradigm
The feedback runs differed from the offline runs in the following:
To engage subjects more in the task, the online protocol was presented in the framework
of a game which rewarded longer trials (dependent on their real-timeα-LI performance)
and fast reaction times with points. Every second of the achieved trial duration gave one point; the result was counted full for a RT of 200 ms, decreased linearly, and reached zero points for a RT of 500 ms and above. The min. and max. duration of the sustained attention period was between 2 and 20 seconds. For subjects in the experimental condition, the color
of the cued target placeholder reflected their instantaneousα-LI (see Section 2.2.3) with red
indicating incorrect lateralization, gray no lateralization and green correct lateralization. The trial ending times were determined from a real-time stochastic process which allowed (on
average) longer trials for a correctα-LI and shorter trials for an incorrectα-LI. In the case of
the sham condition, subjects were presented with the replay of the feedback session of their
match regarding theα-LI and RTs from day one. In both feedback conditions, the inter-trial
interval was stretched to 4-5 seconds to allow for more rest due to the longer trial times.
2.2.3 Data acquisition and processing
Subjects sat in a dark, shielded room, with their head in a headrest that was fixed 50 cm in front
of a 24LCD monitor. The EEG was recorded with an active 64 channel HIamp EEG amplifier
(g.tec, Schiedlberg, Austria) at 512 Hz and referenced to the linked ears. The electrodes were
2.2. Materials and Methods
BCI eye tracker EEG cap Feedback
screen