Swiss Finance Institute
Research Paper Series N°15-10
Central Bank Collateral Frameworks
Kjell G. NYBORG
Central Bank Collateral Frameworks
1
Kjell G. Nyborg
University of Zurich,
Swiss Finance Institute,
and CEPR
February 2015
1
This paper has been written in parallel with a larger (book) manuscript, cited as Nyborg (2015), and provides a summary of some of the ideas and findings in that larger manuscript. Thus, the majority of the text in this paper is shared verbatim with that of the larger manuscript, though the order of passages may be different. The research sampled here has been a large undertaking and I would like to thank Lilia Mukhlynina, Cornelia R¨osler, and Jiri Woschitz for research assistance. The responsibility for any errors is mine. I have also benefited from comments from participants at the ECB Workshop on “Structural changes in money markets: Implications for monetary pol-icy implementation” (September 2013) and a seminar at the Central Bank of Ireland (April 2014). Address: Department of Banking and Finance, University of Zurich, Plattenstrasse 14, 8032 Zurich, Switzerland. E-mail: [email protected].
c
Abstract
Central Bank Collateral Frameworks
This paper seeks to inform about a feature of monetary policy that is largely overlooked, yet occupies a central role in modern monetary and financial systems, namely central bank collateral frameworks. Their importance can be understood by the observation that the money at the core of these systems, central bank money, is injected into the economy on terms, not defined in a market, but by the collateral frameworks and interest rate policies of central banks. Using the collateral framework of the Eurosystem as a basis of illustration and case study, the paper brings to light the functioning, reach, and impact of collateral frame-works. A theme that emerges is that collateral frameworks may have distortive effects on financial markets and the wider economy. They can, for example, bias the private provision ofreal liquidity and thereby also the allocation of resources in the economy as well as contribute to financial instability. Evidence is pre-sented that the collateral framework in the euro area promotes risky and illiquid collateral and, more generally, impairs market forces and discipline. The paper also emphasizes the important role of ratings and government guarantees in the Eurosystem’s collateral framework.
Keywords: central bank, banks, collateral, money, liquidity, monetary system, fi-nancial system, monetary policy, ratings, guarantees, haircuts, Eurosystem, ECB JEL: E58, E42, E52, E44, G10, G01, G21
Money is economical power. – Walter Bagehot (1873)
1
Introduction
If money is economic power and money is issued against collateral, it follows that it is important to understand the nature of the collateral and the terms of the exchange. The money at the core of modern economies is central bank money, what bankers call liquidity. This is injected into the economy, through banks as intermediaries, on terms not defined in a market, but by the collateral frameworks and interest rate policies of central banks. In some jurisdictions, or currency ar-eas, central bank independence means that collateral frameworks are not subject to formal supervision, review, or even much by way of discussion. Public focus has instead been directed towards interest rates or monetary aggregates. There is also a dearth of academic focus on central bank collateral policies. Collateral frameworks are largely shrouded in opacity. This paper therefore aims to bring to light the functioning, reach, and impact of collateral frameworks.
A central bank’s collateral framework is a part of its monetary policy. It is commonly accepted that monetary policy affects the wider economy. There is also emerging evidence that there are monetary effects in financial markets. However, most work on these topics look at broad brush policy variables such as short term interest rates or the quantity of money. There is little work that studies the micro-foundation of the monetary system and its impact on markets and the economy. Learning more about collateral frameworks contributes towards filling that gap. This is important in light of the ongoing challenges in the global economy, where central banks are engaged in quantitative easing and other forms of unconventional monetary policy in an effort to stabilize and support the economy, banks, and the financial markets. In the euro area, monetary policy is even in the vanguard in the fight to save the euro and European project itself.
The collateral framework of the Eurosystem is an integral part of that effort.1
1
See Nyborg (2015) for further discussion on this point. The Eurosystem is the collective structure of national central banks in the euro area spearheaded by the European Central Bank (ECB).
Banking and finance are central to the broader economy because money flows through the banking sector and the financial system. A better understanding of how this works requires in the first instance a deeper and more detailed knowledge of monetary system architecture. While central bank working groups have issued reports on collateral frameworks (e.g., Cheun, von K¨oppen-Mertes, and Weller, 2009; BCBS, 2013b), these are overviews that do not go into depth with respect to how these frameworks actually function or what their broader consequences may be. A theme that will emerge in this paper is that collateral frameworks may have distortive effects on financial markets and the wider economy.
Different central banks have different collateral frameworks. There are com-mon features, but details can vary a great deal. The focus in this paper is on the framework of the Eurosystem, which the ECB is authorized to design and update (ECB, 2000/7). This is an especially interesting case to study because of the richness and complexity that arise from a single currency across multiple countries and the very wide range of collateral banks can use to obtain central bank money directly from the Eurosystem. The euro area also represents one of the largest economies in the world. Its well publicized financial, economic, and political problems have significant impact on global markets and the world economy. Concerns about the euro itself are intermingled with, and, arguably, at the core of these problems. Gaining a more sound understanding of the euro area’s monetary system at the most fundamental level is therefore of great value. The rest of this paper is organized as follows. Section 2 provides background on the market for liquidity and its influence on, and relation to, the broader financial markets. This includes a brief discussion of the severe problems in these markets during the financial crisis and the expansion in central bank balance sheets that resulted from the unconventional monetary policies pursued to deal with the crisis. Since larger balance sheets means more money being created against more collateral of potentially questionable quality, this illustrates the growing importance of collateral and central bank collateral frameworks. But the significance of collateral frameworks is not limited to the crisis.
The general importance of collateral frameworks is discussed in Section 3, with an emphasis on the potential costs that can arise from collateral framework design. I argue that collateral frameworks can influence and distort financial mar-kets and the real economy. Section 3 also sheds light on how collateral frameworks
work in practice by describing central features of the framework used in the euro area. I provide evidence that the Eurosystem’s collateral framework promotes lower quality (more risky and illiquid) collateral and also touch on the important role of ratings and guarantees. Further details, both in terms of the legal rules of the Eurosystem’s collateral framework and empirical facts shedding light on how it works in practice, is provided by Nyborg (2015).
One of the implications of the findings presented in Section 3 is that the Eurosystem’s collateral framework undermines market discipline. This is the topic of Section 4. Section 5 concludes.
2
Background
There is an enormous amount of work on monetary policy transmission channels. This paper complements and contributes to that literature, but does not emanate from it. Instead, it can be characterized as the product of the literatures on the market for liquidity, monetary effects in financial markets, collateral, and finan-cial intermediation. With respect to the first of these, what is espefinan-cially relevant for this paper is the literature that studies open market operations and the in-teraction of banks and the central bank. I will touch on this in subsection 2.2. Collateral is discussed towards the end of this section and the most relevant lit-erature on financial intermediation is touched on in the next section. I start here by briefly discussing the evidence on monetary effects in financial markets from a rather “selfish” perspective.
2.1
Money matters in financial markets
Work I have done with Per ¨Ostberg on the details of the interaction between
the market for liquidity and the broader financial markets shows that money matters in financial markets in part because frictions in interbank markets spill over into the broader markets through what we call liquidity pull-back (Nyborg
and ¨Ostberg, 2014). There is also evidence that asset prices and measures of
liquidity in financial markets are affected by monetary shocks (see, e.g., Fleming and Remolona, 1997; Fair, 2002; Flannery and Protopapadekis, 2002; Bernanke and Kuttner, 2005; Chordia, Sarkar, and Subrahmanyam, 2005). Liquidity
pull-back is a monetary phenomenon acted out in financial markets. It is based on the important role played by central bank money in modern banking and financial systems. Central bank money is the currency, or liquidity, banks need to satisfy reserve requirements, allow for depositor withdrawals, settle interbank transactions, etc. It is injected into the banking system through central bank operations and then reallocated among banks. For many transactions, there is no substitute for central bank money. Thus, for any bank, having sufficient central bank money at any point in time is a binding constraint.
However, conditions in the interbank market may fluctuate. At times it may be “tight,” in the sense that the price of liquidity is high and some banks may have exhausted interbank credit limits. If so, banks may seek alternative sources of central bank money. But as observed by Friedman (1970): “One man can reduce his nominal money balances only by persuading someone else to increase his.” The same holds true for banks. Friedman’s observation is echoed by Tobin (1980): “The nominal supply of money is something to which the economy must adapt, not a variable that adapts itself to the economy – unless the policy authorities want it to.” These restriction can be overcome by borrowing from the central bank’s lending facility (discount window), but this is expensive. A bank can also attempt to attract new, or retain old, deposits, but this is a slow process. Liquidity pull-back offers an alternative approach, namely to obtain liquidity through interacting with financial markets; by pulling liquidity back from them. This can be done several ways, most obviously by selling financial assets di-rectly.2
The mechanism within a bank through which this may happen is that the bank’s internal liquidity management system feeds into trading desks’ limits, reducing them. Alternatively, liquidity pull-back can be achieved by increasing margins to levered investors or haircuts in repos (repurchase agreements). Liquid-ity pull-back does not increase the quantLiquid-ity of central bank money in the system. However, the actions I have described can increase the selling (or acting) bank’s liquidity balances, as long as the (ultimate) buyer banks with another bank.
¨
Ostberg and I emphasize that a feature of the theoretical idea we sketch in our paper is that financial assets serve as a storage facility for liquidity that a bank can tap into if it should face a shortfall. We draw out the implications of this idea with respect to effect of interbank tightness on volume, order flow,
2
and returns in the broader financial markets. The empirical evidence is strongly supportive.
Nyborg and ¨Ostberg (2014) thus show that the way banks obtain central bank
money affects financial markets. This supports the perspective in the current pa-per that collateral frameworks matter, since they determine the terms at which banks can obtain liquidity directly from the central bank. The process of allo-cating central bank money in the economy starts with the interaction of central banks vis-`a-vis banks and this interaction needs to obey the rules and constraints imposed by the central bank’s collateral framework.
2.2
The market for liquidity
Before the crisis, money markets were viewed by many academics and policy makers alike as unimportant for the broader financial markets and the economy. This is not because they were thought of as not serving an important function, but because they were regarded as functioning extremely well. They were considered to be highly competitive and liquid – in a word, “boring” – with no significant impact on the broader financial markets. Yet, the money markets literature shows that this view was never quite correct.
Hamilton’s (1996) seminal study finds that the Fed funds rate (US overnight rate) reacts to calendar effects relating to the reserve maintenance period. There is also evidence that the overnight rate reacts to the supply of reserves (Hamilton, 1997; Carpenter and Demiralp, 2006). Similar effects can be found in the euro area (e.g., Nautz and Offermanns, 2007; Angelini, 2008; and Beirne, 2012). Fecht, Nyborg, and Rocholl (2008) and R¨osler (2015) also document calendar effects with respect to volume. These findings are indications of a less than perfect market for liquidity. Furthermore, using primary market data from ECB main refinancing operations (repo auctions) well before the crisis, Bindseil, Nyborg, and Strebulaev (2009) find evidence that the market for liquidity in the euro area is informationally efficient, but at the same time allocationally inefficient.
The existence of inefficiencies in the market for liquidity explains the positive support in the data for the liquidity pull-back idea. Indeed, that work was mo-tivated by the empirical evidence that interbank markets are not efficient, even during times of normalcy. An earlier ECB working paper by Nyborg, Bindseil, and Strebulaev (2002) also finds evidence consistent with the idea that the
collat-eral framework affects banks’ willingness to pay for liquidity. In particular, these authors conclude that eurozone banks are not indifferent as to what collateral they use in transactions with the Eurosystem. After the onset of the financial crisis in August 2007, the significance of the market for liquidity and collateral has become greatly magnified, as will be explained below.
2.3
The financial crisis and unconventional monetary
pol-icy
A central (and much studied) aspect of the financial crisis is the emergence of severe frictions in the interbank market for liquidity. Interestingly, therefore,
Nyborg and ¨Ostberg (2014) find that the liquidity pull-back effect as a
day-to-day phenomenon became weaker, or harder to identify. A potential explanation for this is that the financial crisis represented a massive liquidity pull-back event, where money and securities as close as possible to money (e.g., treasury bills) were sought by investors and banks and the day-today liquidity pull-back effect was dwarfed by the much larger pattern of the crisis (think fractals). In addition, the large injections by central banks of liquidity in response to the crisis eventually made it less necessary for banks to engage in liquidity pull-back. Instead, they could post collateral to the central bank and receive liquidity directly that way.
While the market for liquidity did not stop functioning during the crisis, it functioned less well than before (see, e.g., Cassola, Holthausen, and Lo Duca, 2010, for the euro area and Afonso, Kovner, and Schoar, 2011, for the US.) Dysfunction in the market for liquidity was a central feature of the crisis. The price of liquidity shot up (Figure 1) while volume shifted in from longer to shorter maturities and fell overall (Abbassi, Br¨auning, Fecht, and Peydr´o, 2014; Gabrieli and Georg, 2015; and R¨osler, 2015). The turmoil in the interbank market for liquidity was accompanied by a massive loss of value in asset prices. This is illustrated in Figure 1, using equities as an example. While Figure 1 uses euro area data, graphs using corresponding data from other markets (e.g., the US) would look the same.
Insert Figure 1 here.
swap rates (Euribor-Eonia spread), with values on the right-axis, and a broad euro area stock market index (Euro Stoxx), with values on the left axis. As explained
by Nyborg and ¨Ostberg (2014), while the Euribor-Eonia spread may reflect credit
risk, it represents more directly the price of liquidity (here, over three months). A high spread is tantamount to the interbank market for liquidity not working well. The sharp increase in the spread in August 2007 represents the beginning of the financial crisis. The spread is seen to peak just after the time of the Lehman bankruptcy, which occurred on September 15, 2008. That the bankruptcy of a US institution should trigger a severe tightening in the market for liquidity in the euro area illustrates the interconnectedness of global markets. Since then, the spread has come substantially down, though not quite to pre-crisis levels.
The pattern for the stock market is analogous. As the interbank market for liquidity saw severe tightening, the stock market almost collapsed, losing around 50% of its value from August 2007 to the bottom in March 2009. Since then the euro area stock market has reversed, gaining back much of the lost ground. Stock markets around the world reacted similarly.
In response to the stressed conditions that ensued after Lehman Brothers’ bankruptcy, the ECB made significant changes to its monetary operations. On October 8, 2008, the ECB announced that it would switch from auctioning a limited quantity of liquidity in its operations to running fixed rate tenders at the policy rate with full allotment. It would do this for both the main and longer term refinancing operations (MROs and LTROs, respectively). This represents one of the most significant actions taken by the ECB in response to the crisis. Under full allotment, central bank money is not rationed in the refinancing operations,
as it used to be under the old liquidity neutral policy.3
Instead, banks receive everything they ask for. The only restriction is that they have to pledge sufficient collateral to cover these amounts. What sufficient means is governed by the Eurosystem’s collateral framework.
Until October 2008, LTRO money was available with three-month maturities. After the introduction of the full allotment policy, further problems in the euro area led to a lengthening of LTRO maturities to one and three years. In total, in the two three-year LTROs, held in December 2011 and February 2012, banks asked for, and received, more than EUR 1 trillion.
3
Unlimited amounts of three year money was not enough to calm the markets. The threat to the euro was real enough to move Mario Draghi, President of the European Central Bank, to make his famous declaration in July 2012 that “Within our mandate, the ECB is ready to do whatever it takes to preserve the euro.”4
On September 6, 2012, this was followed up by the launch of the Outright
Monetary Transactions programme (OMT).5
The OMT allows for unlimited, ster-ilized purchases of sovereign bonds of countries under a European Financial Sta-bility Facility/European StaSta-bility Mechanism program, but has as of January 2015 yet to be employed. Even so, it is often viewed as representing the “what-ever it takes” in Draghi’s famous statement quoted above.
But the problems in the eurozone did not go away after the OMT, as evi-denced, for example, by the continued use of the full allotment policy in open market operations and ongoing considerations of further unconventional mea-sures.6
The mere promise of unlimited purchases of troubled sovereigns’ paper (the OMT) was not enough. Real action was required. Thus, on September 4, 2014, the ECB announced asset backed security (ABS) and covered bond pur-chase programs that, at the time, were said to possibly add as much as one trillion to the balance sheet of the Eurosystem. The exact quantity was subject to much speculation, but reconfirmed in December 2014 and then again in January 2015, when Draghi finally announced that the Eurosystem would go the extra mile and start buying sovereign bonds, though not under the OMT but as a part of the broader ca. one trillion asset purchase program announced in September 2014. Asset purchases also relate to the collateral framework because it governs, among other things, what the set of eligible assets are.
4
See “Speech by Mario Draghi at the Global Investment Conference in London 26 July 2012,” http://www.ecb.europa.eu/press/key/date/2012/html/sp120726.en.html.
5
See ECB Press Release on 6 September 2012 – Technical features of Outright Monetary Transactions, http://www.ecb.europa.eu/press/pr/date/2012/html/pr120906 1.en.html.
6
See, e.g., “Monetary policy communication in turbulent times,” Speech by Mario
Draghi, President of the ECB, at the Conference De Nederlandsche Bank 200
years: Central banking in the next two decades, Amsterdam, 24 April 2014,
2.4
Central bank balance sheets and the increasing
im-portance of collateral
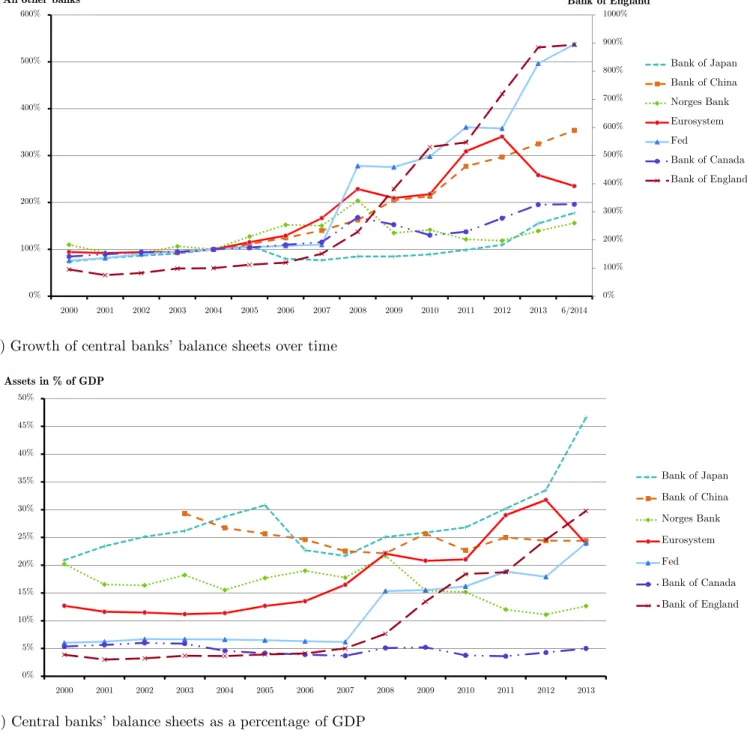
The accommodative monetary policies of central banks in response to the finan-cial crisis have substantially increased their balance sheets. This is illustrated in Figure 2.
Insert Figure 2 here.
Figure 2a shows the growth in the consolidated balance sheet of the Eurosys-tem and, by way of comparison, six other central banks, the Federal Reserve System, Bank of Japan, Bank of China, Bank of Canada, Bank of England, and
Norges Bank (Norway),7
over the period 2000 to 2014. The data are for the end of each calendar year, except 2014 when the sizes of the balance sheets are taken at the end of June. For each central bank, each year is benchmarked against its 2004 balance sheet, which represents 100%. The variation in balance sheet growth across these countries is quite large. For example, over the 2004 to 6/2014 period, it ranges from less than 100% for the Banks of Japan, Canada, and Nor-way to approximately 800% for the Bank of England (which, because of this very large increase, gets its own axis in the plot). The Eurosystem is in the middle, with an increase of 115%.
Figure 2b plots the size of the balance sheets as a percentage of the respective countries’ (or currency area’s) GDP, from 2000 to 2013. The Eurosystem’s bal-ance sheet has increased from around 12% of euro area GDP in 2002 to around 24% in 2013. This is approximately the same percentage in 2013 as for the Bank of China and the Fed, but less than Banks of England (30%) and Japan (47%). A balance sheet to GDP ratio of more than 20% is unprecedented before the crisis over the period sampled here for these countries, with the exception of the Banks of Japan and China. This illustrates the rising importance of central banks and, by implication, the assets they hold.
Central bankers are concerned that the growth in central bank balance sheets over the crisis is associated with these getting weaker as a result of ever worse collateral being taken on. For example, Thomas Jordan, President of the Swiss
7
For the Norges Bank figures, the contribution of the “petroleum fund” to the balance sheet is excluded.
National Bank, is on record as saying that “[a]s a result of the measures imple-mented during the crisis, central banks took much more risk onto their balance sheets, which could potentially lead to substantial losses” and “[t]here is no doubt that central banks have to play a role in an economic crisis at the market level as well as at the level of individual systemically important banks. In order to act appropriately, they need room to maneuver, which implies a sound central bank balance sheet with sufficient equity” (Jordan, 2012). These sentiments are echoed by Klaas Knot (2013), Governor of the Dutch Central Bank,
The unprecedented expansion of central banks’ balance sheet since the start of the crisis is certainly revealing. It shows that central banks’ balance sheets are becoming more and more exposed to eco-nomic risk and political pressure. Eventually, this may result in a sub-stantial amount of negative capital in a central bank’s balance sheet. This is undesirable, because it could undermine a central bank’s cred-ibility and independence...An additional concern for central banks is that unconventional monetary policy increasingly comes with some sense of ‘public unease’ about the role central banks play...The fact that criticism of central banks is creeping more and more into the mainstream debate – whether or not this is justified – implies that the public is looking increasingly critically at central banks. While this may not put central bank independence or central banks’ room for maneuver immediately at risk, it does signify that central banks may need to step up their efforts on transparency and accountability. The assets, or collateral, these central bankers are speaking of – that they have absorbed into their balance sheets over the course of the crisis – and that they are justly concerned about, is a consequence of the functioning of the collateral frameworks that central banks themselves have designed and the unconventional monetary policies they have pursued. The quotes above are therefore testament to the importance of collateral frameworks. It is also suggestive of something being not quite right about them. The central bankers seem to imply that their collateral frameworks could be a source of risk that could create problems down the road.
2.5
Collateral
The discussion above points to the centrality of collateral with respect to mon-etary policy and the market for liquidity. Because conditions in the market for liquidity spill over to the broader financial markets, collateral and collateral frameworks also matter for financial markets. Furthermore, collateral is now more important than ever, in part because of the growth in central bank balance sheets and in part because there is a regulatory/central bank push to collateral-ize interbank transactions. This may create further tension between the usage of collateral in transactions with the central bank versus other counterparties.
During the financial crisis, the ECB broadened the Eurosystem collateral framework considerably, allowing a broader range of securities of the same credit quality and allowing securities of lower ratings. A strand of the literature ad-dresses the question as to what role the balance sheet of a central bank plays (Hawkins, 2003; Bindseil, Manzanares, and Weller 2004; Caruana, 2011; and Miles and Schanz, 2014) as well as asking whether a central bank can default or impinge its credibility by weakening its balance sheet (Stella, 1997; Ernhagen, Vesterlund, and Viotti, 2002; and Buiter, 2008). The recent revisiting of these questions is a result of a concern in some quarters that central banks could be at risk, at least from being able to implement effective policies. By allowing riskier securities as collateral, the ECB has increased its risk, both in financial and political terms, as emphasized by Klaas Knot.
Collateral also plays a direct role in the secondary market for liquidity, notably in repos, and much research is devoted to this topic. As predicted by Duffie (1996), the evidence shows that collateral that trades special in the repo market also trades at a premium in the cash market (Jordan and Jordan, 1997, and Buraschi and Menini, 2002). Not surprisingly, the risk of the underlying collateral adversely affects the repo rate (Bartolini, Hilton, Sundaresan, and Tonetti, 2011). Researchers have also asked the question as to whether the collateralization of transactions in the market for liquidity affects financial stability. Intuitively, collateral can be expected to have a stabilizing effect (Ewerhart and Tapking, 2008; Heider and Hoerova, 2009). However, theoretically, collateral can also turn out to be destabilizing (Kiyotaki and Moore, 1997; Brunnermeier and Pedersen, 2009) when it is combined with credit limits and shocks to asset values. Gorton and Metrick (2012) argue that the financial crisis in the US was characterized
by a run on bilateral repos with securitized assets as collateral. A run in this case means an extreme increase in haircuts. Their main argument is that the underlying securities became more risky and therefore more information sensitive (Gorton and Metrick, 2010). Krishnamurty, Nagel, and Orlov (2014) disagree with this view, arguing instead that the evidence is more consistent with a credit crunch than with a run. However, these authors study different segments of the repo market. Whatever the case, the evidence shows that repo markets were not unaffected by the crisis and may well have played an integral part in it.
The evidence also shows that an increase in market risk is associated with a shift towards safer collateral (Mancini, Ranaldo, and Wrampelmeyer, 2014). Thus, default risk appears to be a consideration in the repo market. Furthermore, a shift towards higher quality collateral in secondary market repos may leave lower quality collateral to be used in repos with the central bank. Safety concerns and regulatory innovations such as the Liquidity Coverage Ratio (BCBS, 2013a) are likely to further increase banks’ demand for high quality assets. Thus, the efficient use and potential re-use of collateral emerge as important considerations (Singh and Stella, 2012; CGFS, 2013; Singh, 2013).
Collateral also plays an important role in real transactions (Bernanke and Gertler, 1989 and 1990; Calomiris and Hubbard, 1990; Kiyotaki and Moore, 1997). This literature establishes a link between collateralized borrowing and asset prices and investments. Notably, the net worth of collateral impacts the investment capability of a firm. This is analogous to a repo transaction, where the form of collateral is not an asset or real estate but a security.
While there is a substantial literature on collateral, as sketched above, little of this research looks directly at the design and consequences of a central bank’s collateral framework. Nyborg and Strebulaev (2001) show theoretically that al-locational inefficiencies in the market for liquidity may depend on the size of the set of eligible collateral, but do not consider collateral heterogeneity, which is a crucial issue handled by collateral frameworks in practice. In another theoretical contribution, Chapman, Chiu, and Molico (2011) show that haircuts in central bank collateral frameworks can influence investment decisions; when haircuts on illiquid assets are “too low,” an overinvestment in these may take place, leaving the central bank at risk and reducing welfare. Related to this, Buiter and Sib-ert (2005) and Ashcraft, Gˆarleanu, and Pedersen (2010) argue that there may
be an inverse relation between haircuts in repos with the central bank and the secondary market prices of the underlying collateral. The latter paper provides empirical evidence to back up this theoretical claim.
3
Collateral Frameworks
Central bank collateral frameworks are fundamental institutional features of the monetary and financial system that have gone largely unstudied by researchers, perhaps because they are simply taken for granted and seem of little consequence in times of normalcy. They are also often complex and opaque, requiring the studying of numerous legal documents to be accurately understood. Their basic function is to define the set of eligible collateral financial institutions can use in operations with central banks to obtain central bank money (liquidity). They also determine the quantity of liquidity that a central bank will supply for each eligible collateral, by, for example, setting haircuts in repos with eligible counterparties (“banks”). This places collateral frameworks at the core of the monetary system and the financial system that extends (from) it.
This section provides an overview of the role played by collateral frameworks, with an emphasis on potential biases and distortions that may arise from their design. I sketch out some theoretical issues and use the important case of the Eurosystem’s collateral framework to shed light on how that particular frame-work functions in practice. Further details are provided in Nyborg (2015), which unpacks the legal rules of the Eurosystem’s collateral framework and brings to light the practical implications of these rules through a forensic style empirical investigation. The current section reviews some of the key findings of that in-vestigation. A central characteristic of the Eurosystem’s collateral framework is its broad eligibility criteria. Thus, the findings summarized in this paper are especially relevant with respect to understanding potential issues that arise in collateral frameworks sharing this characteristic. My general point is that col-lateral frameworks have potentially far-reaching effects on financial markets and the real economy. They are at the core of the monetary system and, as observed by Bagehot (1873), “[m]oney is economical power.”
3.1
Potential impact
There are several dimensions to the potential impact of collateral frameworks. Because eligibility means that a security can be refinanced through, or bought by, the central bank, this can affect its repo rate, liquidity, and price in the secondary market. The haircuts applied by the central bank to different collateral may be set so that the impact of eligibility differs across asset classes and individual securities, possibly by design or even inadvertently.
For instance, in order to make banks’ balance sheets more liquid, the central bank can favor especially illiquid collateral by giving these relatively low haircuts. While this may help channel liquidity “where it is needed,” a side effect is that it may cause distortions in money and asset markets by reducing the role of market discipline. In addition, an impairment in the efficiency of the market for liquidity
can spill over into the broader financial markets as shown by Nyborg and ¨Ostberg
(2014) and, from there, to the real economy.
Collateral frameworks that favor illiquid collateral may also stimulate the endogenous production of it. In turn, this may lead to a misallocation of funds in the real economy towards assets that are fundamentally less liquid in a real sense, that is, assets that have very long-dated returns in terms of goods and services.8
To follow the logic, it is important to understand that central banks control central bank money, that is, nominal balances. If there is a low level of current goods and services, there is little a central bank can do about it in the short run. When we speak of collateral being illiquid, we typically mean this in a nominal sense; selling it may involve accepting a discount in the price and the more so the more one wishes to sell. While a policy of favoring illiquid collateral may serve a useful purpose in some situations, it can also give rise to problems if this collateral is also illiquid in a real sense, as seems plausible. Favoring illiquid collateral in the collateral framework may then lead to an overproduction of illiquid real assets.
8
This relates to Chapman, Chiu, and Molico’s (2011) result that low haircuts on illiquid assets may tilt portfolios in that direction and also to the arguments of Buiter and Sibert (2005) and Ashcraft, Gˆarleanu, and Pedersen (2010) that haircuts affect prices. In turn, these can be seen as special versions of Amihud and Mendelson’s (1986) general point that portfolios may be optimally tilted away from illiquid assets by agents that have more immediate liquidity needs. However, these papers do not discuss nominal versus real liquidity or collateral frameworks as such.
Tilting the economy towards an overproduction of illiquid real assets is likely to be inefficient and may exacerbate business cycles. A policy of favoring illiquid collateral in a depressed economy may make it harder for the economy to recover. Housing, especially second homes, is an example of illiquid real assets. The real returns are long dated. Countries such as Spain and Ireland are still grappling with the aftermath of a prolonged boom in house building. In the case of Spain, much of this was touristic housing, including second-home villas and apartments that stand empty much of the time. Below, I will address whether the collateral framework in the Eurosystem favors illiquid collateral.
The banking literature has raised the issue that banks may be underincen-tivized to channel funds to assets that are liquid in a real sense because of a free-rider problem among them. In particular, as emphasized by Bhattacharya and Gale (1987), the provisioning of liquidity is a public good. Thus, if liquid investments have lower returns than less liquid ones, banks have an incentive to free-ride on other banks. When each bank relies on other banks to promote liquid, low return investments, the end result is an underprovisioning of “real
liquidity” in the system as a whole.9
A central bank that attempts to offset the problem of an underprovisioning of real liquidity by providing nominal balances on favorable terms to illiquid real assets does not solve the free-rider problem, but exacerbates it. Thus, a collateral framework that favors illiquid collateral may ultimately promote a misallocation of funds in the real economy because it affects individual banks’ incentives seen in isolation, as discussed above, and also enhances the free-rider problem among banks with respect to the private provisioning of liquidity.
Collateral frameworks can also impinge on market discipline and bank’s in-centives to monitor creditors by accepting collateral that does not trade at all. They can support the influence of politics on banks and the financial system by
9
The distinction between “liquid” and “illiquid” assets in Bhattacharya and Gale’s (1987) is based on the timing of returns in terms of goods or services. “Liquid” assets are ones with a relatively low duration. In other words, “liquidity” in their analysis refers to assets that are liquid in a real sense. For the most part, the theoretical banking literature has not considered the real-world distinction between nominal and real assets. Most of the literature is written in terms of real assets, ignoring money and the vital function of banks in the money creation process. Some exceptions are Champ, Smith, and Williamson (1996), Allen and Gale (1998), Diamond and Rajan (2006), Skeie (2008), and Allen, Carletti, and Gale (2014).
extending favorable terms to collateral with local, regional, or central government guarantees. Haircut rules and guarantee policies can interact to increase market segmentation. Collateral framework can facilitate indirect bailouts, propping up poorly performing banks that should optimally be resolved instead.
What a central bank accepts in exchange for central bank money also affects its own balance sheet. Perceived weaknesses in a central bank’s balance sheet can ultimately affect agents’ trust in it, its money, and even the political body or bodies, that created and support the central bank. Witness the “end the Fed” and “back to gold” movements in the US and the numerous calls to break up the euro.10
The threat to the euro has been real enough to lead the ECB to engage in a prolonged battle to save it. Many commentators have expressed the view that a break-up of the euro will also mean a break-up of the European Union. This underscores the importance of sound monetary policies, including sound collateral frameworks.
3.2
Collateral eligibility and usage in the euro area
In most currency areas, central bank money is provided to banks against a wide set of eligible collateral with potentially different liquidity and risk character-istics (ECB, 2013; BIS, 2013). The set of eligible collateral in the euro area is especially large. At times, more than 40,000 ISINs have been on the public list of eligible “marketable” collateral, with the number over time being around 30–40,000 ISINs.11
The set of eligible collateral ranges from sovereign bonds to unsecured bank bonds and asset backed securities, with a large span of ratings within all asset classes. At the end of 2013, these had a value of around EUR 14 trillion, having grown from approximately EUR 7.7 billion at the end of 2004 (see, e.g., Nyborg, 2015). Banks can also pledge non-marketable assets such as credit claims. Guarantees by governments, corporations, and other entities can be, and are, used to provide eligibility to otherwise non-eligible collateral.
“Mar-10
See, e.g., Paul (2009) and a Bloomberg National Poll in 2010 in which 16% of the respon-dents said the Federal Reserve should be abolished (http://www.bloomberg.com/news/2010-12-09/more-than-half-of-americans-want-fed-reined-in-or-abolished.html), or “House Republi-cans Resume Efforts to Reduce Fed’s Power,” by Binyamin Appelbaum, New York Times,
July 10, 2014 (http://www.nytimes.com/2014/07/11/business/house-republicans-restart-their-waron-the-fed.html?).
11
ketable” collateral without such guarantees or external ratings can be made pri-vately eligible through the use of approved in-house ratings. The same collateral is eligible across all operations, main and long term refinancing operations and the marginal lending facility (discount window) alike. The Eurosystem therefore offers an ideal setting for gaining insight into collateral frameworks with broad eligibility criteria, in addition to being important in its own right.12
Insert Figure 3 here.
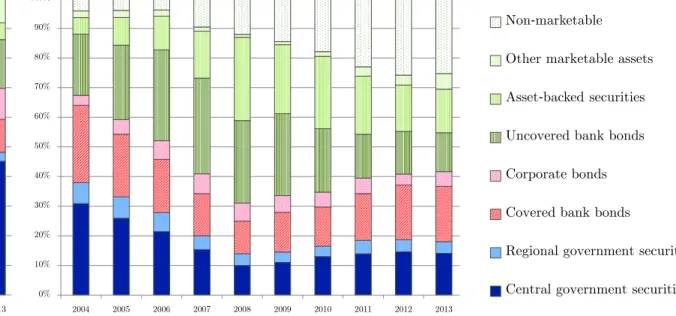
Figure 3 provides evidence on the production and usage of eligible collateral in repos with the Eurosystem from 2004 to 2013. The data underlying the graphs is taken from the ECB’s webpage. Over this time period, the outstanding amount of central bank money injected in repos grew from EUR 345.1 to 717.1 billion, having peaked in 2012 at EUR 1.1 trillion. Over the same time, Eurosystem holdings of euro denominated securities issued by euro area entities grew from
EUR 70.2 to 586.1 billion.13
The ECB provides the data broken down into seven asset classes. These are, from bottom to top in the figure: central government securities, regional government securities, covered bank bonds, corporate bonds, uncovered bank bonds, asset backed securities, and “other marketable assets.” As will be seen in Table 1, collateral haircuts in the Eurosystem are increasing in these asset classes in the order just cited. Thus, we can think of them as representing collateral of decreasing “quality” in terms of risk and liquidity, as reflected by haircuts.14
The figure contains two graphs, one for nominal values of eligible marketable collateral (3a) and one for usage of marketable and non-marketable assets (3b). The different asset classes are color coordinated, to lump them into three broad categories. The “higher quality” collateral is indicated by blue colors. This is
comprised of central and regional government securities.15
The “medium quality” 12
The Federal Reserve System also has wide eligibility criteria, but restricts the securities it accepts at its open market operations to Treasury, agency, and agency mortgaged-backed securities (Board of Governors of the Federal Reserve System, 2012; BIS, 2013). For further details on Eurosystem eligibility criteria, see Eberl and Weber (2014) and Nyborg (2015).
13
This is as tabulated in Nyborg (2015), Table 3, which also provides further details. The original data can be found on the ECB’s webpage.
14
A caveat: it is unclear what securities the category “other marketable assets” represents, although I bundle them with “lower quality” collateral.
15
collateral is indicated by red colors, this is comprised of covered bank bonds and corporate bonds. Third, the “lower quality” collateral is indicated by green colors and is composed of uncovered bank bonds, asset backed securities, and other marketable assets. When looking at usage, the “green” category of lower quality collateral is augmented by non-marketable assets.
Figure 3 shows that the Eurosystem’s collateral framework promotes lower quality collateral. Over time, asset backed securities, uncovered bank bonds, and other “lower quality” marketable assets have become an increasingly larger proportion of the eligible marketable collateral. The increased production of such “low-end” collateral is a logical response to another trend, namely that these collateral classes have become increasingly attractive to use in repos with the Eurosystem, as revealed by the large increase in their usage. From 2004 to 2013, the proportion of these low-end asset classes and non-marketable assets used in repos with the Eurosystem has grown from around 35% to close to 60% by value.16
That banks use a relatively high proportion of lower quality collateral in Eurosystem liquidity injecting operations might be seen as the natural result of the efficient use of collateral by banks. Nyborg, Bindseil, and Strebulaev (2002) argue that there is heterogeneity in the opportunity costs among the collateral that is eligible to be used in Eurosystem repos which is not eliminated by haircuts. This may arise, for example, as a result of Eurosystem haircuts not reflecting market conditions. Consistent with this view, Nyborg (2015) documents that months and years pass between each time Eurosystem haircuts are updated. That banks use relatively worse collateral in ECB operations suggests that lower quality collateral have relatively low haircuts (adjusted for risk and illiquidity).
Lower quality collateral may also have lower opportunity costs because of their limited use outside of Eurosystem operations. In addition to the approximately EUR 14 trillion (end of 2013) of eligible collateral that is marketable, banks can also use non-marketable collateral, with unknown aggregate value. In compar-ison, at the end of 2013, the refinancing operations soaked up collateral with a government debt is of high quality. Here, this is not taken into account.
16
An ECB working paper by Bindseil and Papadia (2006) notes a similar trend in the 1999 to 2005 period as does an IMF working paper by Chailloux, Gray, and McCaughrin (2008) for the 2004 to 2007 period. The latter paper also shows a similar phenomenon occurring in the US with the onset of the financial crisis in the third quarter of 2007.
collateral value of less than one trillion. Thus, there is a large excess quantity of eligible collateral, some of which is locked out of other markets. For example, the popular Eurex GC Pooling ECB basket contracts include only around 7–8,000
ISINs of the roughly 35,000 ISINs that can be used in Eurosystem repos.17
In addition, banks may have a preference for using higher quality collateral in bilateral repos as this saves on default costs. In particular, Ewerhart and Tapking (2008) argue that two-way default risk is an important consideration in bilateral repos. While larger haircuts have the advantage of protecting cash providers against defaults by cash takers (collateral providers), they have the drawback of leading to larger losses to collateral providers in the event that cash providers fail to return the underlying collateral at maturity. This gives rise to a preference for using higher quality collateral in bilateral repos, since such collateral requires lower haircuts to protect the cash provider from cash taker credit risk (assuming default costs are positively related to losses in default). In short, higher quality collateral reduces the total costs of two-way credit risk. The flip side of this is a preference for using lower quality collateral in repos with the central bank. Doing so is possible, of course, only in a system where the central bank does not require the highest quality collateral, as is the case in the euro area.
3.3
Determinants of collateral values
Banks’ preference for particular types of collateral in repos with the central banks is affected by the terms offered by the central bank. In the euro area, the repo rate is independent of the counterparty and the collateral that is being used. However, haircuts vary across eligible collateral. Haircuts therefore play a key role in the collateral framework.
Haircuts are applied, in principle, to the market value of eligible collateral to
yield a collateral’s collateral value. The collateral value is the amount that an
eligible institution (which I refer to as a bank, for short) can borrow from the
central bank with the specified collateral. For a specific eligible collateral i at
time t, the collateral value,Vc
i,t, is given by
Vi,tc = (1−hi,t)Vi,tm, (1)
17
See http://www.eurexrepo.com/repo-en/products/gcpooling/. Eurex acts as a central clearing party (CCP) in these contracts.
wherehi,tis the haircut andVi,tm is, in principle, the market price of the collateral.
I say “in principle” because not all eligible collateral have market prices. Where a market price does not exist or is not sufficiently reliable, the central bank applies
the haircut to a theoretical, or model, price instead. Thus, we can think of Vm
equally as a model or market price.
Questions that naturally arise from these observations include: What are haircuts for different eligible collateral and how are they determined? What determines whether a market or a theoretical price is used? What does a market price actually mean, for example, how recent must it be to count or what kind of volume must it be good for? What fraction of all eligible collateral has a theoretical “market” price for the purpose of calculating collateral values?
Nyborg (2015) addresses these questions and documents, among other things, that around 77% by count and around 17% by value, of all eligible collateral have prices that are theoretically determined, rather than taken from the market (estimated, using the official collateral framework pricing rules and Bloomberg as a data source). By way of comparison, banks use well below 10%, by value, of the eligible collateral in repos with the Eurosystem. The percentage of collateral with theoretical prices is higher for lower quality collateral, which may help explain the heavy usage of such collateral, as seen in Figure 3.
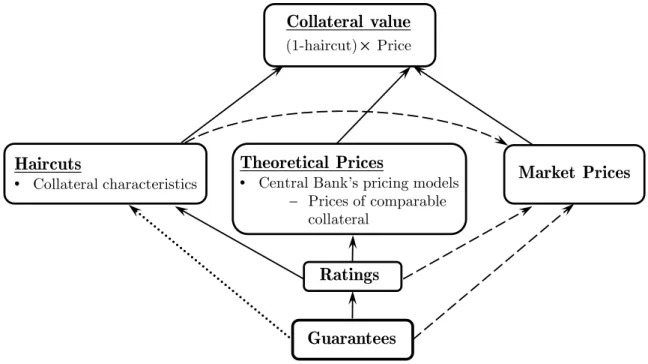
Figure 4 unpacks (1) to highlight the elements that determine collateral values in the Eurosystem’s collateral framework. Markets affect collateral values directly when a market price of the underlying collateral exists, but non-market factors are also very important.
Insert Figure 4 here.
First, haircuts are not determined in a market but directly by the ECB. As seen in (1), haircuts have a direct effect on collateral values. They potentially also have an indirect effect because a collateral’s haircut in Eurosystem operations may impact on its market value, for example as argued by Ashcraft, Gˆarleanu, and Pedersen (2010). Nyborg (2015) provides an empirical example that supports this view.
Second, ratings affect every aspect of the collateral value calculation. Haircuts are directly affected by them. Market prices also tend to respond to ratings. They are also likely to be an input to the model used to calculate theoretical prices,
when that is necessary (but the theoretical models used by the Eurosystem are not publicly available). This gives rating agencies substantial influence. Unfor-tunately, there is evidence that competition for business among rating agencies often leads to a “race to the bottom,” i.e., the rating agency most likely to give the highest rating wins the business (see, e.g., White, 2010, for an overview). But ratings may also be derived from internal models (approved by individual countries’ national central banks).
Third, ratings may be affected by guarantees provided to specific collateral or issuers by sovereigns and other players. This opens the door for politics to influence collateral values, since government guarantees may involve politics in some form or another. Guarantees can also influence haircuts directly. Nyborg (2015) provides further details on the role of ratings and guarantees.
In addition to these points, the influence of markets in determining collateral values is reduced by the fact that the ECB accepts a large number of securities that are trading on non-regulated markets as well as non-marketable collateral, for which market prices by definition do not exist. In short, markets play a potentially limited role when it comes to determining collateral values.
3.4
Euroystem haircuts
As stated above, Eurosystem haircuts are not drawn from the market, but set by the ECB. Although they reflect risk and liquidity, they do not reflect day-to-day, or even month-to-month, changes in market conditions, because they are so rarely revised. Nyborg (2015) documents that, historically, the average time between revisions is more than three years.
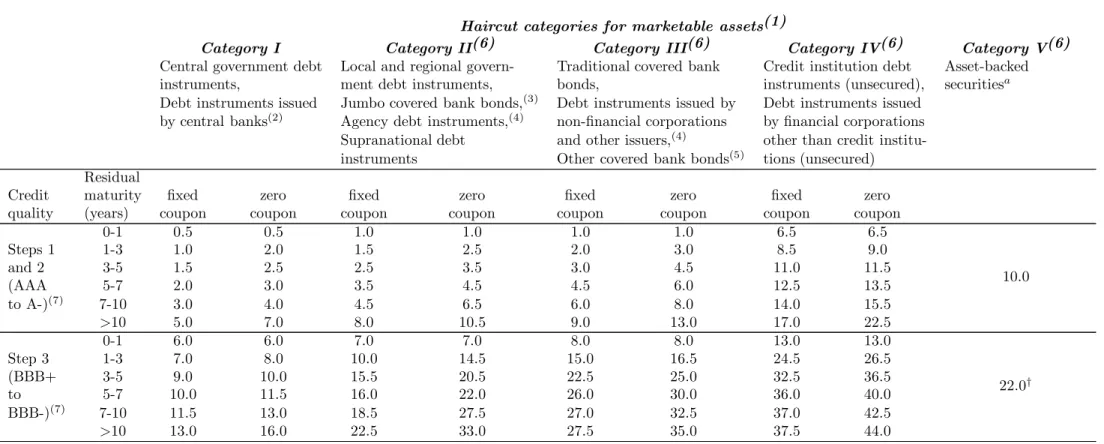
Insert Table 1 here.
By way of example, Table 1 summarizes the haircut rules for marketable eligible collateral that have been in effect since October 1, 2013. As seen, the ECB’s haircut policy (and collateral framework) is built around five liquidity
categories, namely:18
I. Central government and central bank debt; II. Local and regional government debt, jumbo covered bonds (pfandbrief), agency and supranational debt instruments; III. Traditional pfandbrief and corporate debt;
18
As of October 1, 2013, the ECB refers to the liquidity categories as “haircut categories.” Here, I continue to use the older “liquidity category” terminology.
IV. Unsecured bank bonds; and V. Asset-backed securities. For the same residual maturity and coupon policy (zero, fixed, or floating), haircuts are increasing in the liquidity category, with the exception of inverse floaters for which haircuts are the same across liquidity categories. The table also shows that there are two rating categories for eligible collateral, namely, above A- and BBB- to BBB+ (on the S&P scale), with the lower rating category resulting in a higher haircut.19
The haircut policy of the ECB can be summarized as follows:
ECB haircut policy: General features
1. Haircuts are rarely revised over time. Thus, they do not depend on market conditions at particular points in time.
2. Haircuts increase in asset class illiquidity, as measured by the liquidity cat-egory.
3. Haircuts increase in risk, as captured by the duration.20
4. Haircuts increase in risk, as captured by the rating. There are two rating categories.21
5. Within asset classes (liquidity categories), controlling for duration and the two rating categories, there is little differentiation in haircuts between dif-ferent eligible collateral.
6. Haircuts do not depend on the counterparty.22
While the liquidity categories are intended to reflect different liquidity levels, they might also reflect different risk levels. For example, the least liquid category, asset backed securities (V), arguably consists of riskier securities than the most liquid group (I), central government bonds and central bank debt instruments.
19
Nyborg (2015) provides further details on the haircuts on non-marketable collateral, which tend to be larger than those of marketable collateral.
20
Specifically, they increase in the residual maturity of the collateral and are higher for zero coupon bonds than comparable bonds with fixed coupons.
21
Prior to October 25, 2008, eligible collateral needed a rating of at least A-, (on the S&P scale).
22
There is one exception to this, namely the additional haircuts introduced as of October 1, 2013 for “own-use” collateral. “Own use” refers to collateral issued by a counterparty with which the bank that uses it has “close links.” Details on this are provided by Nyborg (2015).
For example, as noted by Calomiris (2009), ratings across asset classes are not comparable with respect to default probabilities.23
Of course, developments in the euro area have shown that, in many cases, risk and illiquidity can be substantial for central government bonds as well.
The low level of market input in determining haircuts and the large number of collateral without market prices can help explain why preferences for using particular asset classes arise and how this can persist and even strengthen over time.
Although Eurosystem haircuts are not much affected by the markets, the reverse is not true. Haircuts in the secondary repo market are often taken directly from the Eurosystem’s collateral framework. In Nyborg (2015), I examine Eurex’ important GC Pooling contracts. These repos are based on a subset of the eligible collateral in Eurosystem operations. According to Eurex officials, they set the haircuts in this contract based on those of the Eurosystem, but may increase them for particular collateral that is perceived to be especially risky. I find that Eurex uses the same haircuts as the ECB in around 93% of cases. This is a simple piece of evidence that shows that the Eurosystem’s collateral framework affects markets.
3.5
Ratings, guarantees, and further issues
In Nyborg (2015), I use official European Union/ECB documentation on the Eu-rosystem’s collateral framework to provide a comprehensive summary of haircuts over time, including the haircuts of different types of non-marketable collateral. The role of ratings and guarantees in determining eligibility and haircuts is also examined in detail. The rules give rise to a set of natural questions that are ex-amined through various pieces of data in what can be characterized as a forensic style analysis.
Issues that are examined include the distribution of eligible collateral and their ratings across different asset classes, the relation between primary market and secondary market haircuts, the impact of haircuts on secondary market yields, cross-collateral haircut inconsistencies, the role of rating agencies, the usage and
23
Calomiris reports that according to Moody’s, in 2005 five year default probabilities were 10 times larger for Baa rated CDOs than for Baa rated corporate bonds, the numbers being 20% and 2%, respectively.
timing of government guarantees, and the incidence of eligible “marketable” col-lateral without market prices. The broad-theme conclusions that emerge are that the collateral framework of the Eurosystem is biased towards low quality collat-eral, does not actively use markets but instead impinges on market discipline, and, in conjunction with the full allotment policy, has been used to facilitate indirect bailouts over the course of the crisis. Some of the more specific findings are as follows.
First, by way of background: as of October 2008, eligible collateral is put into two ratings categories, (i) A- or higher (using Standard & Poor’s scale), and (ii) BBB+ to BBB-, with haircuts in the lower category being higher. The vast majority (around 85% by count, 90% by value) of eligible collateral is rated A-or higher, thus receiving the lower haircuts.
Second, by way of background: Until 2009, the accepted external rating agen-cies were Standard & Poor’s (S&P), Fitch, and Moody’s. In 2009, Dominion Bond Rating Services (DBRS) was added to that list. Only the highest rating counts in Eurosystem operations. I document that DBRS has been pivotal in providing an A- rating for Italy, Ireland, and Spain, and a BBB- rating for Portugal. I estimate that the lower haircuts on government bond from these countries as a result of the pivotal ratings by DBRS is worth around EUR 200-300 billion in increased collateral value. This is especially notable as it is under the full allotment policy, meaning that the full increase in collateral value is available as funding from the Eurosystem. This underscores the important role of DBRS in the Eurosystem’s indirect bailout of the weaker sovereigns.
Third, government guarantees are widely used, with the majority of credit institutions with such guarantees being Italian. The usage of government guar-antees is unfortunate as it strengthens the nexus between governments and banks and may contribute to market fragmentation. The total value of the guaranteed collateral (from the Italian government to Italian credit institutions) amounts to more than EUR 80 billion and the marginal effect is to increase their total collateral value by around EUR 30 billion. Approximately 50% of this is due to the A- rating given to Italy by DBRS.
Figure 5 traces out the number of Italian and non-Italian credit institutions with government guaranteed eligible collateral (on the public list). The vertical dotted lines mark the dates of the two three-year LTROs that, as discussed in
Section 2, provided a total of 1.1 trillion in funding to banks.
Insert Figure 5 here.
Figure 5 illustrates four points. (i) The number of Italian credit institutions with government guarantees increased rapidly from close to zero to more than 250 over a few days prior to the second three-year LTRO. (ii) The number of Italian credit institutions with government guarantees remained stable until spring/early summer of 2014, when it fell to just below 200. This is still a large number. (iii) The number of non-Italian credit institutions with government guaranteed eligible collateral has decreased steadily from before the first three-year LTRO to the spring of 2014. (iv) Since shortly before the second three-year LTRO, there have been substantially more Italian credit institutions with government guarantees than non-Italian ones. This speaks to a severe worsening of the credit worthiness of the banking sector in Italy over the period covered here. It suggests that the three-year LTROs, and the indirect bailout these represented, were especially important for the Italian banking sector.
Fourth, in the run-up to the second three-year LTRO, the ECB weakened col-lateral eligibility criteria by admitting 10,516 securities trading on non-regulated markets to the public list of eligible collateral. This increased the number of French and Italian eligible collateral by 198.5% and 70.8%, respectively. Practi-cally all of this newly admitted collateral were unsecured bank bonds. Spanish, Italian, and French banks had by far the largest uptake in the three-year LTROs, in that order.
Fifth, the announcement on September 4, 2014 that the ECB would purchase asset backed securities and covered bonds, with an aggregate size that was be-lieved at the time to be around EUR 1 trillion, was accompanied by abnormally large stock returns in the euro area. But these were not spread equally across countries. The largest stock returns were seen in the same countries that have benefited from high ratings from DBRS – Portugal, Italy, Ireland, and Spain – as well as Greece. These countries’ bank stocks reacted especially positively. The event study findings are consistent with the purchase program being a part of an indirect bailout especially targeting the financially weaker sovereigns and their banks. Nyborg (2015) discusses at length the hypothesis that the ECB’s unconventional monetary policies over the course of the crisis have served this role.
4
Market Discipline
Market forces and discipline are important notions in the context of collateral frameworks for several reasons. As illustrated by equation (1) and Figure 4, collateral values are determined by applying haircuts to, in principle, market prices. Furthermore, market discipline is typically viewed as an important com-plement to financial regulation. It is one of the three pillars in both the Basel II and III bank regulation frameworks (BCBS, 2011). The idea is that banks, like other enterprises, should be regulated not only through formal regulatory rules, but through the competitive forces of the market. More generally, market and competitive forces are central to the efficient allocation of capital and resources. We would expect this principle to be relevant also in the case of the market for liquidity.
An issue raised in this article, however, is that markets are utilized to a rela-tively small degree by the Eurosystem’s collateral framework. Indeed, it appears that many features of the framework are designed to circumvent market disci-pline. Nyborg (2015) and the findings reviewed in Section 3 offer much by way of detail that speaks to this. The current section distills these findings and discusses some of the consequences of the relative lack of market discipline allowed for by the Euroystem’s collateral framework.
4.1
Market discipline impairment
Several features of the Eurosystem’s collateral framework impinge on market discipline.
First, non-marketable assets are included in the set of eligible collateral. Thus, banks can obtain liquidity without having themselves or their assets assessed in the market. The evidence shows that the usage of non-marketable collateral has increased in the euro area over time, reaching approximately 10% in 2007 and more than 20% in 2011 where it has remained (Figure 3).
Second, a substantial fraction of marketable collateral on the public list of eligible collateral trades on non-regulated markets. The evidence shows that the incidence of theoretical prices is much higher for collateral trading on non-regulated markets than for other collateral.
eligible collateral do not have market prices. By value, the fraction with missing
market prices is around 17%.24
These estimates come from feeding all ISINs on the public list of eligible collateral on selected dates into Bloomberg. This platform is perhaps the most important source of current market data in the financial industry. The large incidence of collateral on the public list without market prices in Bloomberg is strong support for the thesis that market forces and discipline are not central pillars of the Eurosystem’s collateral framework.
Fourth, stale market prices are also a part of the collateral framework for the purpose of determining collateral values. In particular, market prices can be up to five days old. Collateral without a price movement over five days have their prices and therefore collateral values determined theoretically.
Fifth, with respect to determining market prices of eligible collateral, there is no official rule that addresses depth, that is, the volume observed prices are good for. This opens up the possibility of manipulating the prices of thinly traded eligible collateral. This can also affect theoretical prices, since these must necessarily be based on prices of comparable securities. The lack of market depth is especially a concern for illiquid collateral that, by definition, have low volumes. Sixth, in Eurosystem operations, a bank is allowed to use collateral issued by an entity with which it has close links. The rules with respect to such “own-use” have become increasingly lenient over the course of the crisis.
Seventh, Eurosystem haircuts are set by the ECB rather than determined in the market. Indeed, influence appears to flow in the reverse direction, with the fixed haircuts set by the ECB being adopted by some segments of the mar-ket. Nyborg (2015) also provides an example that Eurosystem haircuts influence
market prices of eligible collateral, with larger haircuts reducing prices, ceteris
paribus.
Eighth, revisions to Eurosystem haircuts are rare. The average time between new overall haircut rules is more than three years, but some classes of collateral have not had their haircuts changed over the almost eleven year period, March 2014 to January 2015.
Ninth, the only market, or near-market, based information that affects hair-cuts is ratings by external rating agencies (since October 2008). However, there
24
This may be an underestimate because many ISINs have an outstanding value of zero in the Bloomberg system.
is no aggregation of ratings by different agencies. Instead, except for ABSs, only the highest rating matters (“highest-rating rule”), which invites ratings shopping and catering.25
There are four accepted rating agencies, S&P, Fitch, Moody’s, and DBRS. The inclusion of DBRS to this list in 2009 has contributed to higher ratings. A purely statistical effect is that the distribution of the highest rating shifts to the right as one adds agencies (unless rating agencies become more conservative as one adds competitors to their business). In addition, as evidenced from sovereign ratings, DBRS also gives higher ratings than the other agencies. It has been pivotal in giving Italy, Spain, and Ireland A- ratings and Portugal a BBB- rating over several years. No other agency has been pivotal for a country rated by DBRS.
Tenth, there are only two ratings categories for the purpose of setting haircuts for eligible collateral, above A- and BBB+ to BBB-. The ineffectiveness of ratings as a tool by which to differentiate haircuts can be seen from the finding that the vast majority of marketable eligible collateral on the public list are rated A- or higher, the percentage being approximately 85% by count and 90% by value. This is surprising, but may be the result of the highest-rating rule.
Eleventh, collateral with ratings below BBB- are in principle not eligible, but
exemptions from this rule for sovereign bonds with lower ratings are standard.26
Twelfth, while a rating from an approved external rating agency, either for the issue, the issuer, or the guarantor, is necessary to be on the public list, collateral can also be made eligible privately through the use of a national central bank (NCB) or approved in-house or third party rating. It is not clear how much such “privately eligible” collateral exists or is used, but one could venture a guess that the “other marketable collateral” category in Figure 3 represents such collateral. Figure 3 shows that this category has increased over the course of the crisis, but was also used in the pre-crisis years. The collateral framework recognizes that banks have an incentive to shop around for the most favorable model or tweak their own model, by not allowing banks to use more than one model per year (ECB, 2006/12). This is implicit recognition that private ratings models pose a
25
For ABSs, the most recent rule is that the second highest rating is what matters. 26
Greece and Cyprus have received exemptions. No other euro area country has been rated below BBB-. However, the lowering of the ratings floor to BBB- took place as sovereign ratings started to come under pressure following Lehman’s bankruptcy.
potential problem. Given the abundance of eligible collateral on the public list, it is an open question as to why privately eligible collateral is allowed.
Thirteenth, guarantees can be used to boost ratings. This reduces the role of markets and potentially enhances the role of politics. Government guarantees increased greatly in advance of the second three-year LTRO in February 2012, especially in Italy (Figure 5). The run up to this LTRO also saw the inclusion of more than 10,000 securities trading on non-regulated markets into the set of eligible collateral.
The full allotment policy introduced in October 2008 enhances these potential sources of market discipline impairment. This is so because, under this policy, banks can obtain all the liquidity and funding they wish directly from the central bank. Banks are only constrained by the value of their collateral within the Eurosystem, as determined by equation (1). The quantity of central bank money has increased substantially after the introduction of the full allotment policy, thus placing more demands on collateral and magnifying the distortions that arise from the impairment of market forces.
4.2
Biases and systemic arbitrage
As discussed in above, the collateral framework in the euro area is biased towards what we can think of as lower quality collateral. There appears to be a preference, or bias, towards the usage of more illiquid and risky collateral that has increased over time. The production of lower quality collateral has increased as well.
These findings are consistent with the anecdotal evidence that there is a peck-ing order for the use of collateral as follows:
• Lowest quality collateral used with central bank.
• Intermediate quality collateral used in CCP repos.
• Best quality collateral used in bilateral repos.
This pecking order must reflect the efficient use of collateral by banks. That the lowest quality collateral is used in repos with the Eurosystem may, in part, result from CCPs not accepting the very worst collateral and, in part, that two-sided credit risk in bilateral repos tend to favor higher quality collateral, as discussed in Section 3. But it is also likely a reflection of collateral values in Eurosystem