2014 Issue 1
1
The enterprise data lake: Better integration and deeper analytics
19
Microservices: The resurgence of SOA principles and an alternative to the monolith 33 Containers are redefining application-infrastructure integration
Rethinking integration:
Emerging patterns from
cloud computing leaders
48
Zero-integration technologies and their role in transformation
Contents
33
Microservices architecture (MSA)
Microservices: The resurgence of SOA principles and an alternative to the monolith
19
Data lake
The enterprise data lake: Better integration and deeper analytics
1
Features
Linux containers and Docker
Containers are redefining application-infrastructure integration
48
Zero integration
Zero-integration technologies and their role in transformation
2014
Issue 1
Related interviews
Mike Lang
CEO of Revelytix on how companies are using data lakes
John Pritchard
Director of platform services at Adobe on agile coding in the software industry
Ben Golub
CEO of Docker on the outlook for Linux containers Dale Sanders SVP at Health Catalyst on agile data warehousing in healthcare Richard Rodger CTO of nearForm on the advantages of microservices architecture Sam Ramji VP of Strategy at Apigee on integration trends and the bigger picture
9
26
39
13
29
44
Technology Forecast: Rethinking integration
Issue 1, 2014
The enterprise data lake:
Better integration and
deeper analytics
By Brian Stein andAlan Morrison
Data lakes that can scale at the pace of the cloud remove
integration barriers and clear a path for more timely and
informed business decisions.
2 PwC Technology Forecast The enterprise data lake: Better integration and deeper analytics
Data lakes: An emerging
approach to cloud-based big data
UC Irvine Medical Center maintains millions of records for more than a million patients, including radiology images and other semi-structured reports, unsemi-structured physicians’ notes, plus volumes of spreadsheet data. To solve the challenge the hospital faced with data storage, integration, and accessibility, the hospital created a data lake based on a Hadoop architecture, which enables distributed big data processing by using broadly accepted open software standards and massively parallel commodity hardware. Hadoop allows the hospital’s disparate records to be stored in their native formats for later parsing, rather than forcing all-or-nothing integration up front as in a data warehousing scenario. Preserving the native format also helps maintain data provenance and fidelity,so different analyses can be performed using different contexts. The data lake has made possible several data analysis projects, including the ability to predict the likelihood of readmissions and take preventive measures to reduce the number of readmissions.1
Like the hospital, enterprises across industries are starting to extract and place data for analytics into a single Hadoop-based repository without first transforming the data the way they would need to for a relational data warehouse.2 The basic concepts
behind Hadoop3 were devised by Google to
meet its need for a flexible, cost-effective data processing model that could scale as data volumes grew faster than ever. Yahoo, Facebook, Netflix, and others whose business models also are based on managing enormous data volumes quickly adopted similar methods. Costs were certainly a factor, as Hadoop can be
1 “UC Irvine Health does Hadoop,” Hortonworks, http://hortonworks.com/customer/uc-irvine-health/.
2 See Oliver Halter, “The end of data standardization,” March 20, 2014, http://usblogs.pwc.com/emerging-technology/the-end-of-data-standardization/, accessed April 17, 2014.
3 Apache Hadoop is a collection of open standard technologies that enable users to store and process petabyte-sized data volumes via commodity computer clusters in the cloud. For more information on Hadoop and related NoSQL technologies, see “Making sense of Big Data,” PwC Technology Forecast 2010, Issue 3 at http://www.pwc.com/us/en/technology-forecast/2010/issue3/index.jhtml.
Enterprises across
industries are
starting to extract
and place data
for analytics into
a single,
Hadoop-based repository.
A basic Hadoop architecture for scalable data lake infrastructure
Source: Electronic Design, 2012, and Hortonworks, 2014
Hadoop Distributed File System (HDFS)
Input file
Map task
Reduce task Output file
Hadoop stores and preserves data in any format across a commodity server cluster. Input Region 1 Region 2 Region 3 Split 1 Split 2 Split 3 Split 4 Split 5 Job tracker map( ) partition( ) combine( ) The system splits
up the jobs and distributes, processes, and recombines them via a cluster that can scale to thousands of server nodes. With YARN, Hadoop now supports various programming models and near-real-time outputs in addition to batch. Input Output sort( ) reduce( )
10 to 100 times less expensive to deploy than conventional data warehousing. Another driver of adoption has been the opportunity to defer labor-intensive schema development and data cleanup until an organization has identified a clear business need. And data lakes are more suitable for the less-structured data these companies needed to process.
Today, companies in all industries find themselves at a similar point of necessity.
Enterprises that must use enormous volumes and myriad varieties of data to respond to regulatory and competitive pressures are adopting data lakes. Data lakes are an emerging and powerful approach to the challenges of data integration as enterprises increase their exposure to mobile and cloud-based applications, the sensor-driven Internet of Things, and other aspects of what PwC calls the New IT Platform.
Hadoop can be 10
to 100 times less
expensive to deploy
than conventional
data warehousing.
Issue overview: Integration fabric
The microservices topic is the second of three topics as part of the integration fabric research covered in this issue of the PwC Technology Forecast. The integration fabric is a central component for PwC’s New IT Platform.*
Enterprises are starting to embrace more practical integration.** A range of these new approaches is now emerging, and during the next few months we’ll ponder what the new cloud-inspired enterprise integration fabric looks like. The main areas we plan to explore include these:
Integration
fabric layers Integration challenges Emerging technology solutions Data Data silos, data proliferation,
rigid schemas, and high data warehousing cost; new and heterogeneous data types
Hadoop data lakes, late binding, and metadata provenance tools
Enterprises are beginning to place extracts of their data for analytics and business intelligence (BI) purposes into a single, massive repository and structuring only what’s necessary. Instead of imposing schemas beforehand, enterprises are allowing data science groups to derive their own views of the data and structure it only lightly, late in the process. Applications
and services
Rigid, monolithic systems that are difficult to update in response to business needs
Microservices
Fine-grained microservices, each associated with a single business function and accessible via an application programming interface (API), can be easily added to the mix or replaced. This method helps developer teams create highly responsive, flexible applications.
Infrastructure Multiple clouds and operating systems that lack standardization
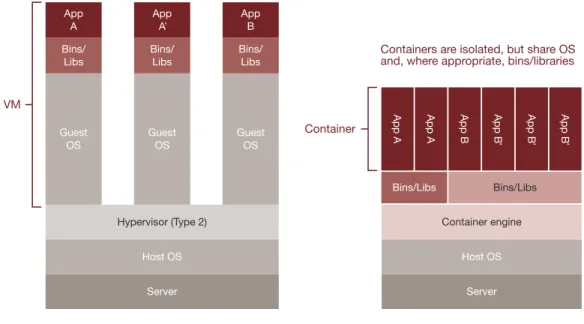
Software containers for resource isolation and abstraction
New software containers such as Docker extend and improve
virtualization, making applications portable across clouds. Simplifying application deployment decreases time to value.
* See http://www.pwc.com/us/en/increasing-it-effectiveness/new-it-platform.jhtml for more information. **Integration as PwC defines it means making diverse components work together so they work as a single entity.
4 PwC Technology Forecast The enterprise data lake: Better integration and deeper analytics
Why a data lake?
Data lakes can help resolve the nagging problem of accessibility and data integration. Using big data infrastructures, enterprises are starting to pull together increasing data volumes for analytics or simply to store for undetermined future use. (See the sidebar “Data lakes defined.”) Mike Lang, CEO of Revelytix, a provider of data management tools for Hadoop, notes that “Business owners at the C level are saying, ‘Hey guys, look. It’s no longer inordinately expensive for us to store all of our data. I want all of you to make copies. OK, your systems are busy. Find the time, get an extract, and dump it in Hadoop.’”
Previous approaches to broad-based data integration have forced all users into a common predetermined schema, or data model. Unlike this monolithic view of a single enterprise-wide data model, the data lake relaxes
standardization and defers modeling, resulting in a nearly unlimited potential for operational insight and data discovery. As data volumes, data variety, and metadata richness grow, so does the benefit.
Recent innovation is helping companies to collaboratively create models—or views— of the data and then manage incremental improvements to the metadata. Data scientists and business analysts using the newest lineage tracking tools such as Revelytix Loom or Apache Falcon can follow each other’s purpose-built data schemas. The lineage tracking metadata also is placed in the Hadoop Distributed File System (HDFS)—which stores pieces of files across a distributed cluster of servers in the cloud—where the metadata is accessible and can be collaboratively refined. Analytics drawn from the lake become increasingly valuable as the metadata describing different views of the data accumulates.
Every industry has a potential data lake use case. A data lake can be a way to gain more visibility or put an end to data silos. Many companies see data lakes as an opportunity to capture a 360-degree view of their customers or to analyze social media trends.
What is a data lake?
The lake can serve as a staging area for the data warehouse, the location of more carefully “treated” data for reporting and analysis in batch mode. Data generalists/
programmers can tap the stream data for real-time analytics.
Data scientists use the lake for discovery and
ideation. Data lakes take advantage of commodity cluster computing techniques for massively scalable, low-cost storage of data files in any format. The data lake accepts
input from various sources and can preserve both the original data fidelity and
the lineage of data transformations. Data models emerge with usage
over time rather than being imposed up front.
A data lake is a repository for large quantities and varieties of data, both structured and unstructured..
In the financial services industry, where Dodd-Frank regulation is one impetus, an institution has begun centralizing multiple data warehouses into a repository comparable to a data lake, but one that standardizes on XML. The institution is moving reconciliation, settlement, and Dodd-Frank reporting to the new platform. In this case, the approach reduces integration overhead because data is communicated and stored in a standard yet
flexible format suitable for less-structured data. The system also provides a consistent view of a customer across operational functions, business functions, and products.
Some companies have built big data sandboxes for analysis by data scientists. Such sandboxes are somewhat similar to data lakes, albeit narrower in scope and purpose. PwC, for example, built a social media data sandbox to help clients monitor their brand health by using its SocialMind application.4
Motivating factors behind the
move to data lakes
Relational data warehouses and their big price tags have long dominated complex analytics, reporting, and operations. (The hospital described earlier, for example, first tried a relational data warehouse.) However, their slow-changing data models and rigid field-to-field integration mappings are too brittle to support big data volume and variety. The vast majority of these systems also leave business users dependent on IT for even the smallest enhancements, due mostly to inelastic design, unmanageable system complexity, and low system tolerance for human error. The data lake approach circumvents these problems.
Freedom from the shackles of one big data model
Job number one in a data lake project is to pull all data together into one repository while giving minimal attention to creating schemas that define integration points between disparate data sets. This approach facilitates access, but the work required to turn that data into actionable insights is a substantial challenge. While integrating the data takes place at the Hadoop layer, contextualizing the metadata takes place at schema creation time. Integrating data involves fewer steps because data lakes don’t enforce a rigid metadata schema as do relational data warehouses. Instead, data lakes support a concept known as
late binding, or schema on read, in which users
build custom schema into their queries. Data is bound to a dynamic schema created upon query execution. The late-binding principle shifts the data modeling from centralized
4 For more information on SocialMind and other analytics applications PwC offers, see
http://www.pwc.com/us/en/analytics/analytics-applications.jhtml.
Data lakes defined
Many people have heard of data lakes, but like the term big data, definitions vary. Four criteria are central to a good definition: • Size and low cost: Data lakes are big. They can be an order of
magnitude less expensive on a per-terabyte basis to set up and maintain than data warehouses. With Hadoop, petabyte-scale data volumes are neither expensive nor complicated to build and maintain. Some vendors that advocate the use of Hadoop claim that the cost per terabyte for data warehousing can be as much as $250,000, versus $2,500 per terabyte (or even less than $1,000 per terabyte) for a Hadoop cluster. Other vendors advocating traditional data warehousing and storage infrastructure dispute these claims and make a distinction between the cost of storing terabytes and the cost of writing or written terabytes.*
• Fidelity: Hadoop data lakes preserve data in its original form and capture changes to data and contextual semantics throughout the data lifecycle. This approach is especially useful for compliance and internal audit. If the data has undergone transformations, aggregations, and updates, most organizations typically struggle to piece data together when the need arises and have little hope of determining clear provenance.
• Ease of accessibility: Accessibility is easy in the data lake, which is one benefit of preserving the data in its original form. Whether structured, unstructured, or semi-structured, data is loaded and stored as is to be transformed later. Customer, supplier, and operations data are consolidated with little or no effort from data owners, which eliminates internal political or technical barriers to increased data sharing. Neither detailed business requirements nor painstaking data modeling are prerequisites.
• Late binding: Hadoop lends itself to flexible, task-oriented structuring and does not require up-front data models.
*For more on data accessibility, data lake cost, and collective metadata refinement including lineage tracking technology, see the interview with Mike Lang, “Making Hadoop suitable for enterprise data science,” at http://www.pwc.com/us/en/technology-forecast/2014/issue1/interviews/interview-revelytix.jhtml. For more on cost estimate considerations, see Loraine Lawson, “What’s the Cost of a Terabyte?” ITBusinessEdge, May 17, 2013, at http://www.itbusinessedge.com/blogs/integration/whats-the-cost-of-a-terabyte.html.
6 PwC Technology Forecast The enterprise data lake: Better integration and deeper analytics
“We see customers
creating big
data graveyards,
dumping
everything into
HDFS and hoping
to do something
with it down the
road. But then
they just lose track
of what’s there.”
—Sean Martin,Cambridge Semantics
data warehousing teams and database
administrators, who are often remote from data sources, to localized teams of business analysts and data scientists, who can help create flexible, domain-specific context. For those accustomed to SQL, this shift opens a whole new world.
In this approach, the more that is known about the metadata, the easier it is to query. Pre-tagged data, such as Extensible Markup Language (XML), JavaScript Object Notation (JSON), or Resource Description Framework (RDF), offers a starting point and is highly useful in implementations with limited data variety. In most cases, however, pre-tagged data is a small portion of incoming data formats.
Early lessons and pitfalls to avoid
Some data lake initiatives have not succeeded, producing instead more silos or empty sandboxes. Given the risk, everyone is
proceeding cautiously. “We see customers creating big data graveyards, dumping everything into HDFS and hoping to do something with it down the road. But then they just lose track of what’s there,” says Sean Martin, CTO of Cambridge Semantics, a data management tools provider.
Companies avoid creating big data graveyards by developing and executing a solid strategic plan that applies the right technology and methods to the problem. Few technologies in recent memory have as much change potential as Hadoop and the NoSQL (Not only SQL) category of databases, especially when they can enable a single enterprise-wide repository and provide access to data previously trapped in silos. The main challenge is not creating a data lake, but taking advantage of the opportunities it presents. A means of creating, enriching, and managing semantic metadata incrementally is essential.
Data flow in the data lake
XML .xls etc.
The data lake loads data extracts, irrespective of format, into a big data store. Metadata is decoupled from its underlying data and stored independently, enabling flexibility for multiple end-user perspectives and incrementally maturing semantics.
A big data repository stores data as is, loading existing data and accepting new feeds regularly. Metadata grows and matures over time via user interaction.
Data scientists and app developers
prepare and analyze attribute-level data.
Machines help discover patterns and create data views.
Users collaborate to identify, organize, and make sense of the data in the data lake.
The data lake offers a unique opportunity for flexible,
evolving, and maturing big data insights. Business and dataanalysts select and report on domain-specific data.
New data comes into the lake Cross-domain data analysis
Metadata tagging and linking Tagging, synonyms, linking
Upstream data extracts
New actions (such as customer campaigns) based on insights from the data
How a data lake matures
Sourcing new data into the lake can occur gradually and will not impact existing models. The lake starts with raw data, and it matures as more data flows in, as users and machines build up metadata, and as user adoption broadens. Ambiguous and competing terms eventually converge into a shared understanding (that is, semantics) within and across business domains. Data maturity results as a natural outgrowth of the ongoing user interaction and feedback at the metadata managementlayer—interaction that continually refines the lake and enhances discovery. (See the sidebar “Maturity and governance.”) With the data lake, users can take what is relevant and leave the rest. Individual business domains can mature independently and gradually. Perfect data classification is not required. Users throughout the enterprise can see across all disciplines, not limited by organizational silos or rigid schema.
Data lake maturity
The data lake foundation includes a big data repository, metadata management, and an application framework to capture and contextualize end-user feedback. The increasing value of analytics is then directly correlated to increases in user adoption across the enterprise.
With the data lake,
users can take
what is relevant
and leave the
rest. Individual
business domains
can mature
independently
and gradually.
Increasing value of analytics
Increasing usage across the enterprise
1. Consolidated and categorized raw data 2. Attribute-level metadata tagging and linking (i.e., joins) 3. Data set extraction and analysis 4. Business-specific tagging, synonym identification, and links 5. Convergence of meaning within contextDa
ta
matur
ity increases
8 PwC Technology Forecast The enterprise data lake: Better integration and deeper analytics
Maturity and governance
Many who hear the term data lake might associate the concept with a big data sandbox, but the range of potential use cases for data lakes is much broader. Enterprises envision lake-style repositories as staging areas, as alternatives to data warehouses, or even as operational data hubs, assuming the appropriate technologies and use cases. A key enabler is Hadoop and many of the big data analytics technologies associated with it. What began as a means of ad hoc batch analytics in Hadoop and MapReduce is evolving rapidly with the help of YARN and Storm to offer more general-purpose distributed analytics and real-time capabilities. At least one retailer has been running a Hadoop cluster of more than 2,000 nodes to support eight customer behavior analysis applications.* Despite these advances, enterprises will remain concerned about the risks surrounding data lake deployments, especially at this still-early stage of development. How can enterprises effectively mitigate the risk and manage a Hadoop-based lake for broad-ranging exploration? Lakes can provide unique benefits over traditional data management methods at a substantially lower cost, but they require many practical considerations and a thoughtful approach to governance, particularly in more heavily regulated industries. Areas to consider include: • Complexity of legacy data: Many legacy
systems contain a hodgepodge of software patches, workarounds, and poor design. As a result, the raw data may provide limited value outside its legacy context. The data lake performs optimally when supplied with unadulterated data from source systems, and rich metadata built on top.
• Metadata management: Data lakes require advanced metadata management methods, including machine-assisted scans, characterizations of the data files, and lineage tracking for each transformation. Should schema on read be the rule and predefined schema the exception? It depends on the sources. The former is ideal for working with rapidly changing data structures, while the latter is best for sub second query response on highly structured data.
• Lake maturity: Data scientists will take the lead in the use and maturation of the data lake. Organizations will need to place the needs of others who will benefit within the context of existing organizational processes, systems, and controls.
• Staging area or buffer zone: The lake can serve as a cost-effective place to land, stage, and conduct preliminary analysis of data that may have been prohibitively expensive to analyze in data warehouses or other systems.
To adopt a data lake approach, enterprises should take a full step toward multipurpose (rather than single purpose) commodity cluster computing for enterprise-wide analysis of less-structured data. To take that full step, they first must acknowledge that a data lake is a separate discipline of endeavor that requires separate treatment. Enterprises that set up data lakes must simultaneously make a long-term commitment to hone the techniques that provide this new analytic potential. Half measures won’t suffice.
* Timothy Prickett Morgan, “Cluster Sizes Reveal Hadoop Maturity Curve,” Enterprise Tech: Systems Edition, November 8, 2013, http://www.enterprisetech.com/2013/11/08/cluster-sizes-reveal-hadoop-maturity-curve/, accessed March 20, 2014.
Mike Lang
Mike Lang is CEO of Revelytix.
PwC: You’re in touch with a number of customers who are in the process of setting up Hadoop data lakes. Why are they doing this?
ML: There has been resistance on the part of business owners to share data, and a big part of the justification for not sharing data has been the cost of making that data available. The data owners complain they must write in some special way to get the data extracted, the system doesn’t have time to process queries for building extracts, and so forth. But a lot of the resistance has been political. Owning data has power associated with it. Hadoop is changing that, because C-level executives are saying, “It’s no longer inordinately expensive for us to store all of
our data. I want all of you to make copies. OK, your systems are busy. Find the time, get an extract, and dump it in Hadoop.” But they haven’t integrated anything. They’re just getting an extract. The benefit is that to add value to the integration process, business owners don’t have nearly the same hill to climb that they had in the past. C-level executives are not asking the business owner to add value. They’re just saying, “Dump it,” and I think that’s under way right now. With a Hadoop-based data lake, the enterprise has provided a capability to store vast
amounts of data, and the user doesn’t need to worry about restructuring the data to begin. The data owners just need to do the dump, and they can go on their merry way.
Technology Forecast: Rethinking integration
Issue 1, 2014
Making Hadoop suitable
for enterprise data science
Creating data lakes enables enterprises to expand
discovery and predictive analytics.
Interview conducted by Alan Morrison, Bo Parker, and Brian Stein10 PwC Technology Forecast Making Hadoop suitable for enterprise data science
“If I want to add a terabyte node to my current
analytics infrastructure, the cost could be
$250,000. But if I want to add a terabyte
node to my Hadoop data lake, the cost is
more like $25,000.”
PwC: So one major obstacle was just the ability to share data cost-effectively?
ML: Yes, and that was a huge obstacle. Huge. It is difficult to overstate how big that obstacle has been to nimble analytics and data integration projects during my career. For the longest time, there was no such thing as nimble when talking about data integration projects. Once that data is in Hadoop, nimble is the order of the day. All of a sudden, the ETL [extract, transform, load] process is totally turned on its head—from
contemplating the integration of eight data sets, for example, to figuring out which of a company’s policyholders should receive which kinds of offers at what price in which geographic regions. Before Hadoop, that might have been a two-year project.
PwC: What are the main use cases for Hadoop data lakes?
ML: There are two main use cases for the data lake. One is as a staging area to support some specific application. A company might want to analyze three streams of data to reduce customer churn by 10 percent. They plan to build an app to do that using three known streams of data, and the data lake is just part of that workflow of receiving, processing, and then dumping data off to generate the churn analytics. The last time we talked [in 2013], that was the main use case of the data lake. The second use case is supporting data science groups all around the enterprise. Now, that’s probably 70 percent of the companies we’ve worked with.
PwC: Why use Hadoop?
ML: Data lakes are driven by three factors. The first one is cost. Everybody we talk to really believes data lakes will cost much less than current alternatives. The cost of data processing and data storage could be 90 percent lower. If I want to add a terabyte node to my current analytics infrastructure, the cost could be $250,000. But if I want to add a terabyte node to my Hadoop data lake, the cost is more like $25,000.
The second factor is flexibility. The flexibility comes from the late-binding principle. When I have all this data in the lake and want to analyze it, I’ll basically build whatever schema I want on the fly and I’ll conduct my analysis the way data scientists do. Hadoop lends itself to late binding. The third factor relates to scale. Hadoop data lakes will have a lot more scale than the data warehouse, because they’re designed to scale and process any type of data.
PwC: What’s the first step in creating such a data lake?
ML: We’re working with a number of big companies that are implementing some version of the data lake. The first step is to create a place that stores any data that the business units want to dump in it. Once that’s done, the business units make that place available to their stakeholders. The first step is not as easy as it sounds. The companies we’ve been in touch with spend an awful lot of time building security apparatuses. They also spend a fair amount of time performing quality checks on the data as it comes in, so at least they can say something about the quality of the data that’s available in the cluster.
But after they have that framework in place, they just make the data available for data science. They don’t know what it’s going to be used for, but they do know it’s going to be used.
PwC: So then there’s the data preparation process, which is where the metadata reuse potential comes in. How does the dynamic ELT [extract, load, transform] approach to preparing the data in the data science use case compare with the static ETL [extract, transform, load] approach traditionally used by business analysts?
ML: In the data lake, the files land in Hadoop in whatever form they’re in. They’re extracted from some system and literally dumped into Hadoop, and that is one of the great attractions of the data lake—data professionals don’t need to do any expensive ETL work beforehand. They can just dump the data in there, and it’s available to be processed in a relatively inexpensive storage and processing framework. The challenge, then, is when data scientists need to use the data. How do they get it into the shape that’s required for their R frame or their Python code for their advanced analytics? The answer is that the process is very iterative. This iterative process is the distinguishing difference between business analysts and data warehousing and data scientists and Hadoop. Traditional ETL is not iterative at all. It takes a long time to transform the different data into one schema, and then the business analysts perform their analysis using that schema. Data scientists don’t like the ETL paradigm used by business analysts. Data scientists have no idea at the beginning of their job what the schema should be, and so
they go through this process of looking at the data that’s available to them. Let’s say a telecom company has set-top box data and finance systems that contain customer information. Let’s say the data scientists for the company have four different types of data. They’ll start looking into each file and determine whether the data is unstructured or structured this way or that way. They need to extract some pieces of it. They don’t want the whole file. They want some pieces of each file, and they want to get those pieces into a shape so they can pull them into an R server. So they look into Hadoop and find the file. Maybe they use Apache Hive to transform selected pieces of that file into some structured format. Then they pull that out into R and use some R code to start splitting columns and performing other kinds of operations. The process takes a long time, but that is the paradigm they use. These data scientists actually bind their schema at the very last step of running the analytics. Let’s say that in one of these Hadoop files from the set-top box, there are 30 tables. They might choose one table and spend quite a bit of time understanding and cleaning up that table and getting the data into a shape that can be used in their tool. They might do that across three different files in HDFS [Hadoop Distributed File System]. But, they clean it as they’re developing their model, they shape it, and at the very end both the model and the schema come together to produce the analytics.
PwC: How can the schema become dynamic and enable greater reuse?
ML: That’s why you need lineage. As data scientists assemble their intermediate data sets, if they look at a lineage graph in our Loom
“Data scientists don’t like the ETL paradigm used
by business analysts. Data scientists have no idea
at the beginning of their job what the schema
should be, and so they go through this process of
looking at the data that’s available to them.”
12 PwC Technology Forecast Making Hadoop suitable for enterprise data science product, they might see 20 or 30 different
sets of data that have been created. Of course some of those sets will be useful to other data scientists. Dozens of hours of work have been invested there. The problem is how to find those intermediate data sets. In Hadoop, they are actually realized persisted data sets. So, how do you find them and know what their structure is so you can use them? You need to know that this data set originally contained data from this stream or that stream, this application and that application. If you don’t know that, then the data set is useless. At this point, we’re able to preserve the input sets—the person who did it, when they did it, and the actual transformation code that produced this output set. It is pretty straightforward for users to go backward or forward to find the data set, and then find something downstream or upstream that they might be able to use by combining it, for example, with two other files. Right now, we provide the bare-bones capability for them to do that kind of navigation. From my point of view, that capability is still in its infancy.
PwC: And there’s also more freedom and flexibility on the querying side?
ML: Predictive analytics and statistical analysis are easier with a large-scale data lake. That’s another sea change that’s happening with the advent of big data. Everyone we talk to says SQL worked great. They look at the past through SQL. They know their current financial state, but they really need to know the characteristics of the customer in a particular zip code that they should target with a particular product.
When you can run statistical models on enormous data sets, you get better predictive capability. The bigger the set, the better your predictions. Predictive modeling and analytics are not being done timidly in Hadoop. That’s one of the main uses of Hadoop.
This sort of analysis wasn’t performed 10 years ago, and it’s only just become mainstream practice. A colleague told me a story about a credit card company. He lives in Maryland, and he went to New York on a trip. He used his card one time in New York and then he went to buy gas, and the card was cut off. His card didn’t work at the gas station. He called the credit card company and asked, “Why did you cut off my card?” And they said, “We thought it was a case of fraud. You never have made a charge in New York and all of a sudden you made two charges in New York.” They asked, “Are you at the gas station right now?” He said yes. It’s remarkable what the credit card company did. It ticked him off that they could figure out that much about him, but the credit card company potentially saved itself tens of thousands of dollars in charges it would have had to eat.
This new generation of processing platforms focuses on analytics. That problem right there is an analytical problem, and it’s predictive in its nature. The tools to help with that are just now emerging. They will get much better about helping data scientists and other users. Metadata management capabilities in these highly distributed big data platforms will become crucial—not nice-to-have capabilities, but I-can’t-do-my-work-without-them capabilities. There’s a sea of data.
Dale Sanders
Dale Sanders is senior vice president of Health Catalyst.
PwC: How are healthcare enterprises scaling and maturing their
analytics efforts at this point?
DS: It’s chaotic right now. High-tech funding facilitated the adoption of EMRs [electronic medical records] and billing systems as data collection systems. And HIEs [health information exchanges] encouraged more data sharing. Now there’s a realization that analytics is critical. Other industries experienced the same pattern, but healthcare is going through it just now. The bad news for healthcare is that the market is so overwhelmed from the adoption of EMRs and HIEs. And now the changes from ICD-9 [International Classification of Diseases, Ninth Revision] are coming, as well as the changes to the HIPAA [Health
Insurance Portability and Accountability Act] regulation. Meaningful use is still a challenge. Accountable care is a challenge. There’s so much turmoil in the market, and it’s hard to admit that you need to buy yet another IT system. But it’s hard to deny that, as well. Lots of vendors claim they can do analytics. Trying to find the way through that maze and that decision making is challenging.
PwC: How did you get started in this area to begin with, and what has your approach been?
DS: Well, to go way back in history, when I was in the Air Force, I conceived the idea for late binding in data warehouses after I’d seen some different failures of data warehouses using relational database systems.
Technology Forecast: Rethinking integration
Issue 1, 2014
A step toward the data
lake in healthcare:
Late-bound data warehouses
Dale Sanders of Health Catalyst describes how healthcare
providers are addressing their need for better analytics.
Interview conducted by Alan Morrison, Bo Parker, and Brian Stein14 PwC Technology Forecast A step toward the data lake in healthcare: Late-bound data warehouses If you look at the early history of data
warehousing in the government and military—it was all on mainframes. And those mainframe data warehouses look a lot like Hadoop today. Hadoop is emerging with better tools, but conceptually the two types of systems are very similar. When relational databases became popular, we all rushed to those as a solution for data warehousing. We went from the flat files associated with mainframes to Unix-based data warehouses that used relational database systems. And we thought it was a good idea. But one of the first big mistakes everyone made was to develop these enterprise data models using a relational form.
I watched several failures happen as a consequence of that type of early binding to those enterprise models. I made some adjustments to my strategy in the Air Force, and I made some further adjustments when I worked for companies in the private sector and further refined it.
I came into healthcare with that. I started at Intermountain Healthcare, which was an early adopter of informatics. The organization had a struggling data warehouse project because it was built around this tightly coupled, early-binding relational model. We put a team together, scrubbed that model, and applied late binding. And, knock on wood, it’s been doing very well. It’s now 15 years in its evolution, and Intermountain still loves it. The origins of Health Catalyst come from that history.
PwC: How mature are the analytics systems at a typical customer of yours these days?
DS: We generally get two types of customers. One is the customer with a fairly advanced analytics vision and aspirations. They understand the whole notion of population health management and capitated
reimbursement and things like that. So they’re naturally attracted to us. The dialogue with those folks tends to move quickly. Then there are folks who don’t have that depth of background, but they still understand that they need analytics.
We have an analytics adoption model that we use to frame the progression of analytics in an organization. We also use it to help drive a lot of our product development. It’s an eight-level maturity model. Intermountain operates pretty consistently at levels six and seven. But most of the industry operates at level zero—trying to figure out how to get to levels one and two. When we polled participants in our webinars about where they think they reside in that model, about 70 percent of the respondents said level two and below. So we’ve needed to adjust our message and not talk about levels five, six, and seven with some of these clients. Instead, we talk about how to get basic reporting, such as internal dashboards and KPIs [key performance indicators], or how to meet the external reporting requirements for joint commission and accountable care organizations [ACOs] and that kind of thing.
“We have an analytics adoption model that we
use to frame the progression of analytics in an
organization. Most of the [healthcare] industry
operates at level zero.”
If they have a technical background, some organizations are attracted to this notion of late binding. And we can relate at that level. If they’re familiar with
Intermountain, they’re immediately attracted to that track record and that heritage. There are a lot of different reactions.
PwC: With customers who are just getting started, you seem to focus on already well-structured data. You’re not opening up the repository to data that’s less structured as well.
DS: The vast majority of data in healthcare is still bound in some form of a relational structure, or we pull it into a relational form. Late binding puts us between the worlds of traditional relational data warehouses and Hadoop—between a very structured representation of data and a very unstructured representation of data. But late binding lets us pull in unstructured content. We can pull in clinical notes and pretext and that sort of thing. Health Catalyst is developing some products to take advantage of that.
But if you look at the analytic use cases and the analytic maturity of the industry right now, there’s not a lot of need to bother with unstructured data. That’s reserved for a few of the leading innovators. The vast majority of the market doesn’t need unstructured content at the moment. In fact, we really don’t even have that much unstructured content that’s very useful.
PwC: What’s the pain point that the late-binding approach addresses?
DS: This is where we borrow from Hadoop and also from the old mainframe days.
When we pull a data source into the late-binding data warehouse, we land that data in a form that looks and feels much like the original source system. Then we make a few minor modifications to the data. If you’re familiar with data modeling, we flatten it a little bit. We denormalize it a little bit. But for the most part, that data looks like the data that was contained in the source system, which is a characteristic of a Hadoop data lake—very little transformation to data. So we retain the binding and the fidelity of the data as it appeared in the source system. If you contrast that approach with the other vendors in healthcare, they remap that data from the source system into an enterprise data model first. But when you map that data from the source system into a new relational data model, you inherently make compromises about the way the data is modeled, represented, named, and related. You lose a lot of fidelity when you do that. You lose familiarity with the data. And it’s a time-consuming process. It’s not unusual for that early binding, monolithic data model approach to take 18 to 24 months to deploy a basic data warehouse.
In contrast, we can deploy content and start exposing it to analytics within a matter of days and weeks. We can do it in days, depending on how aggressive we want to be. There’s no binding early on. There are six different places where you can bind data to vocabulary or relationships as it flows from the source system out to the analytic visualization layer. Before we bind data to new vocabulary, a new business rule, or any analytic logic, we ask ourselves what use case we’re
“The vast majority of data in healthcare is still
bound in some form of a relational structure, or
we pull it into a relational form.”
16 PwC Technology Forecast A step toward the data lake in healthcare: Late-bound data warehouses trying to satisfy. We ask on a use case
basis, rather than assuming a use case, because that assumption could lead to problems. We can build just about whatever we want to, whenever we want to.
PwC: In essence, you’re moving toward an enterprise data model. But you’re doing it over time, a model that’s driven by use cases.
DS: Are we actually building an enterprise data model one object at a time? That’s the net effect. Let’s say we land half a dozen different source systems in the enterprise data warehouse. One of the first things we do is provide a foreign key across those sources of data that allows you to query across those sources as if they were an enterprise data model. And typically the first foreign key that we add to those sources—using a common name and a common data type—is patient identifier. That’s the most fundamental. Then you add vocabularies such as CPT [Current Procedural Terminology] and ICD-9 as that need arises. When you land the data, you have what amounts to a virtual enterprise model already. You haven’t remodeled the data at all, but it looks and functions like an enterprise model. Then we’ll spin targeted analytics data marts off those source systems to support specific analytic use cases. For example, perhaps you want to drill down on the variability, quality, and cost of care in a clinical program for women and newborns. We’ll spin off a registry of those patients and the physicians treating those patients into its own separate data mart. And then we will associate every little piece of data that we can find: costing
data, materials management data, human resources data about the physicians and nurses, patient satisfaction data, outcomes data, and eventually social data. We’ll pull that data into the data mart that’s specific to that analytic use case to support women and newborns.
PwC: So you might need to perform some transform rationalization, because systems might not call the same thing by the same name. Is that part of the late-binding vocabulary rationalization?
DS: Yes, in each of those data marts.
PwC: Do you then use some sort of provenance record—a way of rationalizing the fact that we call these 14 things different things—that becomes reusable?
DS: Oh, yes, that’s the heart of it. We reuse all of that from organization to organization. There’s always some modification. And there’s always some difference of opinion about how to define a patient cohort or a disease state. But first we offer something off the shelf, so you don’t need to re-create them.
PwC: What if somebody wanted to perform analytics across the data marts or across different business domains? In this framework, would the best strategy be to somehow consolidate the data marts, or instead go straight to the underlying data warehouse?
DS: You can do either one. Let’s take a comorbidity situation, for example, where a patient has three or four different disease states. Let’s say you want to look at that patient’s continuum of care across all of those.
“We are building an enterprise data model one
object at a time.”
Over the top of those data marts is still this common late-binding vocabulary that allows you to query the patient as that patient appears in each of those different subject areas, whatever disease state it is. It ends up looking like a virtual enterprise model for that patient’s record. After we’ve formally defined a patient cohort and the key metrics that the organization wants to understand about that patient cohort, we want to lock that down and tightly bind it at that point. First you get people to agree. You get physicians and administrators to agree how they want to identify a patient cohort. You get agreement on the metrics they want to understand about clinical effectiveness. After you get comprehensive agreement, then you look for it to stick for a while. When it sticks for a period of time, then you can tightly bind that data together and feel comfortable about doing so—so you don’t need to rip it apart and rebind it again.
PwC: When you speak about coming toward an agreement among the various constituencies, is it a process that takes place more informally outside the system, where everybody is just going to come up with the model? Or is there some way to investigate the data first? Or by using tagging or some collaborative online utility, is there an opportunity to arrive at consensus through an interface?
DS: We have ready-to-use definitions around all these metrics—patient registries and things like that. But we also recognize that the state of the industry being what it is, there’s still a lot of fingerprinting and opinions about those definitions. So even though
an enterprise might reference the National Quality Forum, the Agency for Healthcare Research and Quality, and the British Medical Journal as the sources for the definitions, local organizations always want to put their own fingerprint on these rules for data binding. We have a suite of tools to facilitate that exploration process. You can look at your own definitions, and you can ask, “How do we really want to define a diabetic patient? How do we define congestive heart failure and myocardial infarction patients?” We’ll let folks play around with the data, visualize it, and explore it in definitions. When we see them coming toward a comprehensive and persistent agreement, then we’ll suggest, “If you agree to that definition, let’s bind it together behind that visualization layer.” That’s exactly what happens. And you must allow that to happen. You must let that exploration and fingerprinting happen. A drawback of traditional ways of deploying data warehouses is that they presuppose all of those bindings and rules. They don’t allow that exploration and local fingerprinting.
PwC: So how do companies get
started with this approach? Assuming they have existing data warehouses, are you using those warehouses in a new way? Are you starting up from scratch? Do you leave those data warehouses in place when you’re implementing the late-bound idea?
DS: Some organizations have an existing data warehouse. And a lot of organizations don’t. The greenfield organizations are the easiest to deal with.
“A drawback of traditional ways of deploying
data warehouses is that they presuppose various
bindings and rules. They don’t allow for data
exploration and local fingerprinting.”
18 PwC Technology Forecast A step toward the data lake in healthcare: Late-bound data warehouses The strategy is pretty complicated to decouple
all of the analytic logic that’s been built around those existing data warehouses and then import that to the future. Like most transitions of this kind, it often happens through attrition. First you build the new enterprise data
warehouse around those late-binding concepts. And then you start populating it with data. The one thing you don’t want to do is build your new data warehouse under a dependency to those existing data warehouses. You want to go around those data warehouses and pull your data straight from source systems in the new architecture. It’s a really bad strategy to build a data warehouse on top of data warehouses.
PwC: Some of the people we’ve interviewed about Hadoop assert that using Hadoop versus a data warehouse can result in a cost benefit that’s at least an order of magnitude cheaper. They claim, for example, that storing data costs $250,000 per terabyte in a traditional warehouse versus $25,000 per terabyte for Hadoop. If you’re talking with the C-suite about an exploratory analytics strategy, what’s the advantage of staying with a warehousing approach?
DS: In healthcare, the compelling use case for Hadoop right now is the license fee. Contrast that case with what compels Silicon Valley web companies and everybody else to go to Hadoop. Their compelling reason wasn’t so much about money. It was about scalability.
If you consider the nature of the data that they’re pulling into Hadoop, there’s no such thing as a data model for the web. All the data that they’re streaming into Hadoop comes tagged with its own data model. They don’t need a relational database engine. There’s no value to them in that setting at all. For CIOs, the fact that Hadoop is inexpensive open source is very attractive. The downside, however, is the lack of skills. The skills and the tools and the ways to really take advantage of Hadoop are still a few years off in healthcare. Given the nature of the data that we’re dealing with in healthcare right now, there’s nothing particularly compelling about Hadoop in healthcare right now. Probably in the next year, we will start using Hadoop as a preprocessor ETL [extract, transform, load] platform that we can stream data into. During the next three to four years, as the skills and the tools evolve to take advantage of Hadoop, I think you’ll see companies like Health Catalyst being more aggressive about the adoption of Hadoop in a data lake scenario. But if you add just enough foreign keys and dimensions of analytics across that data lake, that approach greatly facilitates reliable landing and loading. It’s really, really hard to pull meaningful data out of those lakes without something to get the relationship started.
By Galen Gruman and Alan Morrison
Big SOA was overkill. In its place, a more agile form of
services is taking hold.
Technology Forecast: Rethinking integration
Issue 1, 2014
Microservices: The resurgence
of SOA principles and an
20 PwC Technology Forecast Microservices: An alternative to the monolith
Moving away from the monolith
Companies such as Netflix, Gilt, PayPal, and Condé Nast are known for their ability to scale high-volume websites. Yet even they have recently performed major surgery on their systems. Their older, more monolithic architectures would not allow them to add new or change old functionality rapidly enough. So they’re now adopting a more modular and loosely coupled approach based on microservices architecture (MSA). Their goal is to eliminate dependencies and enable quick testing and deployment of code changes. Greater modularity, loose coupling, and reduced dependencies all hold promise in simplifying the integration task.
If MSA had a T-shirt, it would read: “Code small. Code local.”
Early signs indicate this approach to code management and deployment is helping companies become more responsive to shifting customer demands. Yet adopters might encounter a challenge when adjusting the traditional software development mindset to the MSA way—a less elegant, less comprehensive but more nimble approach. PwC believes MSA is worth considering as a complement to traditional methods when
speed and flexibility are paramount—typically in web-facing and mobile apps.
Microservices also provide the services layer in what PwC views as an emerging cloud-inspired enterprise integration fabric, which companies are starting to adopt for greater business model agility.
Why microservices?
In the software development community, it is an article of faith that apps should be written with standard application programming interfaces (APIs), using common services when possible, and managed through one or more orchestration technologies. Often, there’s a superstructure of middleware, integration methods, and management tools. That’s great for software designed to handle complex tasks for long-term, core enterprise functions—it’s how transaction systems and other systems of record need to be designed.
But these methods hinder what Silicon Valley companies call web-scale development: software that must evolve quickly, whose functionality is subject to change or obsolescence in a couple of years—even months—and where the level of effort must fit a compressed and reactive schedule. It’s more like web page design than developing traditional enterprise software.
Greater modularity,
loose coupling,
and reduced
dependencies all
hold promise in
simplifying the
integration task.
For a monolith to change, all must agree on each change. Each change has unanticipated effects requiring careful testing beforehand.
Elements in SOA are developed more autonomously but must be coordinated with others to fit into the overall design.
Developers can create and activate new microservices without prior coordination with others. Their adherence to MSA principles makes continuous delivery of new or modified services possible.
Pre-SOA (monolithic)
Tight coupling Traditional SOALooser coupling MicroservicesDecoupled
1990s and earlier 2000s 2010s
Dependencies from a developer’s perspective
Team Team Team Team Team Team Team Team Team Team
Some of the leading web properties use MSA because it comes from a mindset similar to other technologies and development approaches popular in web-scale companies: agile software development, DevOps, and the use of Node.js and Not only SQL (NoSQL). These approaches all strive for simplicity, tight scope, and the ability to take action without calling an all-hands meeting or working through a tedious change management process. Managing code in the MSA context is often ad hoc and something one developer or a small team can handle without complex superstructure and management. In practice, the actual code in any specific module is quite small—a few dozen lines, typically—is designed to address a narrow function, and can be conceived and managed by one person or a small group.
It is important to understand that MSA is still evolving and unproven over the long term. But like the now common agile methods, Node.js coding framework, and NoSQL data management approaches before it, MSA is an experiment many hope will prove to be a strong arrow in software development quivers.
MSA: A think-small approach
for rapid development
Simply put, MSA breaks an application into very small components that perform discrete functions, and no more. The definition of “very small” is inexact, but think of functional calls or low-level library modules, not applets or complete services. For example, a microservice could be an address-based or geolocation-based zip-code lookup, not a full mapping module. In MSA, you want simple parts with clean, messaging-style interfaces; the less elaborate the better. And you don’t want elaborate middleware, service buses, or other
orchestration brokers, but rather simpler messaging systems such as Apache Kafka. MSA proponents tend to code in web-oriented languages such as Node.js that favor small components with direct interfaces, and in functional languages like Scala or the Clojure Lisp library that favor “immutable” approaches to data and functions, says Richard Rodger, a Node.js expert and CEO of nearForm, a development consultancy.
This fine-grained approach lets you update, add, replace, or remove services—in short, to integrate code changes—from your application easily, with minimal effect on anything else. For example, you could change the zip-code lookup to a UK postal-code lookup by changing or adding a microservice. Or you could change the communication protocol from HTTP to AMQP, the emerging standard associated with RabbitMQ. Or you could pull data from a NoSQL database like MongoDB at one stage of an application’s lifecycle and from a relational product like MySQL at another. In each case, you would change or add a service.
MSA lets you move from quick-and-dirty to quick-and-clean changes to applications or their components that are able to function by themselves. You would use other techniques— conventional service-oriented architecture (SOA), service brokers, and platform as a service (PaaS)—to handle federated
application requirements. In other words, MSA is one technique among many that you might use in any application.
The fine-grained, stateless, self-contained nature of microservices creates decoupling between different parts of a code base and is what makes them easy to update, replace,
The fine-grained,
stateless,
self-contained nature
of microservices
creates decoupling
between different
parts of a code
base and is what
makes them
easy to update,
replace, remove,
or augment.
Pre-SOA (monolithic)
Tight coupling Traditional SOALooser coupling MicroservicesDecoupled
1990s and earlier 2000s 2010s
Evolution of services orientation
Coupling
Exist in a “dumb” mess
aging envir
22 PwC Technology Forecast Microservices: An alternative to the monolith
Thinking the MSA way:
Minimalism is a must
The MSA approach is the opposite of the traditional “let’s scope out all the possibilities and design in the framework, APIs, and data structures to handle them all so the application is complete.”
Think of MSA as almost-plug-and-play in-app integration of discrete services both local remove, or augment. Rather than rewrite a
module for a new capability or version and then coordinate the propagation of changes the rewrite causes across a monolithic code base, you add a microservice. Other services that want this new functionality can choose to direct their messages to this new service, but the old service remains for parts of the code you want to leave alone. That’s a significant difference from the way traditional enterprise software development works.
Issue overview: Integration fabric
The microservices topic is the second of three topics as part of the integration fabric research covered in this issue of the PwC Technology Forecast. The integration fabric is a central component for PwC’s New IT Platform.*
Enterprises are starting to embrace more practical integration.** A range of these new approaches is now emerging, and during the next few months we’ll ponder what the new cloud-inspired enterprise integration fabric looks like. The main areas we plan to explore include these:
Integration
fabric layers Integration challenges Emerging technology solutions
Data Data silos, data proliferation, rigid schemas, and high data warehousing cost; new and heterogeneous data types
Hadoop data lakes, late binding, and metadata provenance tools
Enterprises are beginning to place extracts of their data for analytics and business intelligence (BI) purposes into a single, massive repository and structuring only what’s necessary. Instead of imposing schemas beforehand, enterprises are allowing data science groups to derive their own views of the data and structure it only lightly, late in the process. Applications
and services
Rigid, monolithic systems that are difficult to update in response to business needs
Microservices
Fine-grained microservices, each associated with a single business function and accessible via an application programming interface (API), can be easily added to the mix or replaced. This method helps developer teams create highly responsive, flexible applications.
Infrastructure Multiple clouds and operating systems that lack standardization
Software containers for resource isolation and abstraction
New software containers such as Docker extend and improve
virtualization, making applications portable across clouds. Simplifying application deployment decreases time to value.
* See http://www.pwc.com/us/en/increasing-it-effectiveness/new-it-platform.jhtml for more information. **Integration as PwC defines it means making diverse components work together so they work as a single entity.
to accommodate all possible use cases when those use cases can change unexpectedly and the life span of code modules might be less than 18 months.
The pace at which new code creation and changes happen in mobile applications and websites simply doesn’t support the traditional application development model. In such cases, the code is likely to change due to rapidly evolving social media services, or because it runs in iOS, Android, or some other environment where new capabilities are available annually, or because it needs to search a frequently updated product inventory. For such mutable activities, you want to avoid—not build in—legacy management requirements. You live with what nearForm’s Rodger considers a form of technical
debt, because it is an easier price to pay for functional flexibility than a full-blown architecture that tries to anticipate all needs. It’s the difference between a two-week update and a two-year project.
and external. These services are expected to change, and some eventually will become disposable. When services have a small focus, they become simple to develop, understand, manage, and integrate. They do only what’s necessary, and they can be removed or ignored when no longer needed.
There’s an important benefit to this minimalist approach, says Gregg Caines, a freelance web developer and co-author of programming books: “When a package doesn’t do more than is absolutely necessary, it’s easy to understand and to integrate into other applications.” In many ways, MSA is a return to some of the original SOA principles of independence and composition—without the complexity and superstructure that become common when SOA is used to implement enterprise software. The use of multiple, specific services with short lifetimes might sound sloppy, but remember that MSA is for applications, or their components, that are likely to change frequently. It makes no sense to design and develop software over an 18-month process
Mobile apps and
web apps are
natural venues
for MSA.
Traditional SOA versus microservices
Traditional SOA Microservices
Messaging type Smart, but dependency-laden ESB Dumb, fast messaging (as with Apache Kafka) Programming
style Imperative model agent-based systemsReactive actor programming model that echoes Lines of code
per service of codeHundreds or thousands of lines 100 or fewer lines of code
State Stateful Stateless
Messaging type Synchronous: wait to connect Asynchronous: publish and subscribe Databases Large relational databases NoSQL or micro-SQL databases blended with
conventional databases
Code type Procedural Functional
Means of
evolution Each big service evolves abandoned or ignoredEach small service is immutable and can be Means of
systemic change Modify the monolith Create a new service
Means of scaling Optimize the monolith Add more powerful services and cluster by activity
System-level
24 PwC Technology Forecast Microservices: An alternative to the monolith This mentality is different from that required
in traditional enterprise software, which assumes complex, multivariate systems are being integrated, requiring many-to-many interactions that demand some sort of intelligent interpretation and complex framework. You invest a lot up front to create a platform, framework, and architecture that can handle a wide range of needs that might be extensive but change only at the edges.
MSA assumes you’re building for the short term; that the needs, opportunities, and context will change; and that you will handle them as they occur. That’s why a small team of developers familiar with their own microservices are the services’ primary users. And the clean, easily understood nature lets developers even more quickly add, remove, update, and replace their services and better ensure interoperation with other services. In MSA, governance, data architecture, and the microservices are decentralized, which minimizes the dependencies. As a result of this independence, you can use the right language for the microservice in question, as well as the right database or other related service, rather than use a single language or back-end service to accomplish all your application’s needs, says David Morgantini, a developer at ThoughtWorks.
Where MSA makes sense
MSA is most appropriate for applications whose functions may need to change frequently; that may need to run on multiple, changing platforms whose local services and capabilities differ; or whose life spans are not long enough to warrant a heavily architected framework. MSA is great for disposable services.
Mobile apps and web apps are natural venues for MSA. But whatever platform the application runs on, some key attributes favor MSA: • Fast is more important than elegant. • Change in the application’s
functionality and usage is frequent.
• Change occurs at different rates within the application, so functional isolation and simple integration are more important than module cohesiveness. • Functionality is easily separated into
simple, isolatable components. For example, an app that draws data from social networks might use separate microservices for each network’s data extraction and data normalization. As social networks wax and wane in popularity, they can be added to the app without changing anything else. And as APIs evolve, the app can support several versions concurrently but independently.
Microservices can make media distribution platforms, for example, easier to update and faster than before, says Adrian Cockcroft, a technology fellow at Battery Ventures, a venture capital firm.The key is to separate concerns along these dimensions: • Each single-function microservice
has one action.
• A small set of data and UI elements is involved.
• One developer, or a small team, independently produces a microservice. • Each microservice is its own build,
to avoid trunk conflict. • The business logic is stateless.
• The data access layer is statefully cached. • New functions are added swiftly,
but old ones are retired slowly.1
These dimensions create the independence needed for the microservices to achieve the goals of fast development and easy