Achieving Repeatability of Asynchronous Events in
Wireless Sensor Networks with EnviroLog
Liqian Luo
†, Tian He
‡, Gang Zhou, Lin Gu, Tarek F. Abdelzaher
†, John A. Stankovic
Computer Science Department, University of Virginia, Charlottesville, Virginia 22904{ll4p, tianhe, gz5d, lg6e, zaher, stankovic}@cs.virginia.edu
Abstract— Sensing events from dynamic environments are normally asynchronous and non-repeatable. This lack of repeata-bility makes it particularly difficult to statistically evaluate the performance of sensor network applications. Hence, it is essential to have the capability to capture and replay sensing events, providing a basis not only for system evaluation, but also for realistic protocol comparison and parameter tuning. To achieve
that, we design and implement EnviroLog, a distributed service
that improves repeatability of experimental testing of sensor networks via asynchronous event recording and replay. To use EnviroLog, an application programmer needs only to specify two types of simple annotations to the source code. Automatically, the preprocessor embeds EnviroLog into any desired level of an event-driven architecture. It records all events generated by lower layers and can replay them later to upper layers on demand. We validate the accuracy and performance of recording and replay through a set of microbenchmarks, using the latest XSM platforms. We further demonstrate the strength of EnviroLog in system tuning and performance evaluation for sensor network applications in an outdoor environment with 37 XSMs.
I. INTRODUCTION
With the increase in maturity of sensor networks research and with recent solutions to several practical systems and de-ployment problems, sensor network applications are entering the real world. Representative experiences of such evolution are documented in recent literature such as military surveil-lance [7] [19], habitat monitoring [13] [12], and environmental monitoring [23] [2], just to name a few. Quite different from controlled lab settings, physical environments introduce a high degree of uncertainty that makes it hard to conduct repro-ducible experiments. Consequently it is hard for researchers to obtain statistically consistent empirical results. With the growing number of applications developed and deployed, there is an increasing need for tools and services to assist with system evaluation and debugging, as well as with performance tuning of applications in outdoor environments.
To address this issue, we proposeEnviroLog, a tool to im-prove repeatability of experimental testing of distributed event-driven sensor network applications. Unlike time-event-driven appli-cations, such as periodic sampling of environmental condi-tions, the state of event-driven systems can change depending on the particular sequence of events received and their timing.
The work reported in this paper was supported in part by the National Science Foundation grants EHS-0208769, CSR-0509233, and NETS-0435060, and by MURI grant N00014-01-1-0576.
†Liqian Luo and Tarek F. Abdelzaher are now with University of Illinois at Urbana-Champaign.
‡Tian He is now with University of Minnesota.
Matters such as tuning protocol parameters for particular event scenarios or comparing performance of different protocols typ-ically require the same distributed event traces to be replayed (e.g., to ensure a common basis for comparison). To address this requirement, we provide an event recording and replay service that can capture and reproduce distributed events on demand. The service provides the abstraction of a completely repeatable environment as observed by the sensory subsystem for the sake of experimental testing. Communication properties remain stochastic. Hence, a separation is achieved between the effects of communication non-determinism and the effects of environmental non-repeatability in the study of sensor network protocols. The service is especially valuable in the study of rare, unsafe, or hard-to-reproduce events such as the motion of tracked animals through a sensor field.
Our service is geared for the final stages of testing, typically performed in-field, where the effects of environmental realities can be studied. Early testing can use simulators that may be good for initial debugging since they allow fully controlled and repeatable experiments to be conducted. However, simulators are notoriously inaccurate when it comes to sensor network applications, since: (i) certain practical issues (e.g., the dis-tribution of radio irregularity) are not adequately captured in most available simulators, resulting in large discrepancies between simulation results and empirical measurements, and (ii) simulators do not faithfully mimic environmental event signatures which affects the performance of sensor network applications. The problem is especially severe in event-driven architectures, where application behavior is more sensitive to the sequence, timing, and parameters of events received.
In addition to improving the repeatability of field testing, our service significantly reduces experimentation cost. In the absence of a recording and replay service, the investigators would have to either physically reproduce or passively wait for environmental events of interest, which entails additional costs. For example, the authors of [7] have developed a surveillance system that tracks persons and vehicles in the field. The need for walking or driving through the field hundreds of times while tuning an array of protocol parameters has proved to be a major practical impediment imposing a significant limitation on the rate at which experiments could be conducted in practice. EnviroLog, the asynchronous event recording and replay service described in this paper, provides a comprehensive solution to this problem.
storage. For example, Mica, Mica2, Mica2Dot [15] and XSM [17] hardware platforms incorporate 128 KB internal flash for code storage and 512 KB external flash for other usage. EnviroLog logs environmental events into such persistent storage devices. Later on, in replay mode, EnviroLog replaces environmental inputs with retrieved logs and re-issues the logged events in their original time sequence as asynchronous inputs. In addition to environmental events, EnviroLog can also log system runtime status for future analysis by recording selected variable values at runtime as specified by the program-mer using simple annotations.
EnviroLog has two unique features. First, EnviroLog can operate at any layer of an application. In other words, events recorded and replayed by EnviroLog are not limited to direct reflection of environmental events such as raw sensory read-ings. They can be any system-level events. This characteristic of EnviroLog enables the debugging or tuning of any specific layer using controlled and repeatable inputs from lower layers in an event-driven system. Second, EnviroLog provided a very friendly user interface. Users only need to add simple annotations before events or variables to be logged. Applica-tions with EnviroLog annotaApplica-tions can be compiled either into production code that ignores all EnviroLog annotations or into development code that allows on-demand recording and replay. The potential uses of EnviroLog include (i) in-field de-bugging and performance tuning of specific parameters of an application, (ii) collecting statistical results from a large number of repeated experiments, and (iii) generating traces for mixed simulation environments that accept experimental measurements as inputs.
The remainder of the paper is organized as follows. Section II reviews related work. Section III describes the design goals and system architecture for EnviroLog. Section IV describes the implementation details. Section V evaluates EnviroLog, using XSM platforms, through a series of in-field experiments based on several sample applications provided by TinyOS [8] and a surveillance system [7] built upon TinyOS. Section VI concludes the paper.
II. RELATEDWORK
In recent years, sensor network researchers have proposed several tools and middleware that aid the debugging and evaluation of sensor network applications. Generally, they can be divided into four categories: simulators, emulators, test-beds and services. The section compares EnviroLog with related work in each of these categories.
Simulators are popular tools in debugging and evaluation of sensor network applications since they don’t usually require the deployment of sensor hardware. NS-2 [16], GloMoSim [24] and TOSSIM [11] are good examples. NS-2 is a discrete event simulator supporting various networking protocols over wired and wireless networks. GloMoSim focuses more on mobile, wireless networks. It allows comparison of multiple protocols at a given layer. TOSSIM is a simulator especially designed for TinyOS applications, which provides scalable simulations of sensor network software. Current simulators,
however, do not adequately capture the real behavior of sensor networks. This is due to the difficulty in modeling practical imperfections such as radio irregularity as well as due to the lack of good models of environmental inputs. The ability of EnviroLog to record environmental events can presumably be utilized to improve these tools by importing recorded event data to simulate environmental inputs.
Another category of debugging and performance evaluation tools in sensor networks is emulators that mimic sensor devices either in software or hardware. AVR JTAG ICE [1], a real time in-circuit emulator, is a good representative of hardware emulators. It uses the JTAG interface to enable a user to do real-time emulation of the microcontroller of sensor devices. A drawback of such in-circuit emulators is that they have to be physically connected to emulated devices, which causes logistical difficulties in conducting experiments especially for large-scale applications covering a wide field. Atemu [18] is a software emulator for AVR-processor-based systems that emulates AVR processors as well as other peripheral devices on the MICA2 platform. Like TOSSIM, Atemu also sim-ulates wireless communication. Such software emulators do not introduce the logistical difficulties exhibited in hardware emulators, but they are usually less realistic in reproducing network behavior.
The final stages of debugging and performance tuning typically use actual testbeds to evaluate sensor network appli-cations. For example, Motelab [22] is a public testbed using MICA2 platforms, which allows users to upload executables and receive execution results via the Internet. Kansei [20] is another testbed. It employs XSM, MICA2, and Stargate platforms. EmStar [5] is a combination of emulators and testbeds for Linux-based sensor network applications, which runs applications using either a modeled radio channel or the channel of real nodes. EmTOS [6] extends EmStar to run TinyOS applications by compiling them into EmStar binaries. These testbeds ease the development and evaluation a lot without requiring full-scale deployment. However, they do not focus on repeatability of environmental inputs like EnviroLog does.
We categorize all other software facilitating field tests of sensor network applications as services. EnviroLog belongs to this category. Monitoring tools such as Message Center [21] aid field tests by capturing messages in the air, filtering and displaying them to users. Closest to EnviroLog is TOSHILT [10], a middleware for hardware-in-the-loop testing. TOSHILT defines emulated stimuli to replace the real environmental events, so that applications can be evaluated repeatedly before the final deployment. Since TOSHILT uses synthetic and parametric event profiles, the detail of accuracy is less than what can be captured by EnviroLog. In addition, TOSHILT doesn’t provide abstractions similar to EnviroLog annotations to ease the integration of the middleware into user applications. All these difference make EnviroLog unique. In the following, EnviroLog is described in more detail.
Record Stage Log modules Target modules Target modules Enviro-Log Flash Input Output Replay Stage Log modules Target modules Target modules Flash Input Output Enviro-Log
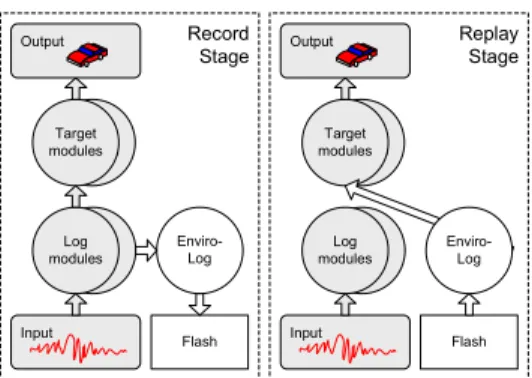
Fig. 1. Main idea of EnviroLog
III. DESIGN
The major goal of EnviroLog is to enable experimental repeatability by recording and replaying environmental in-puts. From a program’s view, such inputs are essentially data streams that are transformed by each module of the program until they reach the modules at the topmost layer and become outputs. If we log the data stream generated by a module during the occurrence of an environmental event, and regenerate the same data stream later, from the perspective of the modules that consume the data, the environmental event is repeating itself.
EnviroLog makes the assumption that data is transferred from one module to another module only through function calls and their parameters. This assumption conforms to the event-driven sensor acquisition convention of TinyOS, where sensory data is usually obtained through asynchronous events (defined as a type of function calls in TinyOS) with parameters containing the data. Based on this assumption, the desired data stream generated by a module can be recorded by logging all its issued function calls and their parameters. That founds the main idea that EnviroLog is built upon.
Users of EnviroLog, through user interfaces, designate the modules that provide the data stream. These modules are called log modules. The modules that directly or indirectly consume the logged data stream are calledtarget modules. As depicted in Figure 1, during the record stage, EnviroLog logs all function calls issued by the log modules into persistent storage devices such as a flash. During the replay stage, log modules are disabled. Instead, EnviroLog issues the previously recorded function calls at the right time and in the right sequence as recorded. Based on this main idea, the following subsections discuss the design of EnviroLog in more detail. A. Design Goals
The design goals of EnviroLog are:
• Effectiveness: Effectiveness of EnviroLog is measured
by its ability to perform: (i) accurate event record and event replay, and (ii) reliable runtime status record and retrieve.
• Efficiency: In sensor platforms, resource constraints (on
both CPU and memory) are significant which makes it critical to use resources efficiently. EnviroLog is designed
EnviroLog service Code depository Stage controller Record and replay Time synchronization Preprocessor
Applications with EnviroLog annotation
Applications with EnviroLog service incorporated
Fig. 2. System architecture of EnviroLog
with efficiency in mind so that it can be applied to complex applications that consume a significant fraction of available resources.
• Simplicity: As a tool aimed to simplify the life of
sensor network programmers, EnviroLog must be easy to use. In other words, simple user interfaces should be provided. Experiences tell us that simple tools tend to gain more popularity and persist longer while more complex tools sometimes run into usability barriers and become deserted.
• Flexibility: There are always tradeoffs between
perfor-mance and overhead. Since EnviroLog cannot achieve optimal performance and minimum overhead at the same time, it should allow users to flexibly select their specific performance requirements (e.g., high logging throughput) at the expense of incurring a corresponding overhead. EnviroLog should also be flexible enough to allow users to record and replay any application behavior not limited to direct inputs of environmental events.
The above design goals provide guidelines throughout the design and implementation of EnviroLog.
B. System Architecture
Figure 2 illustrates the architecture of EnviroLog. Users indicate the set of events and variables to be recorded by inserting special annotations, called EnviroLog annotations, into applications. EnviroLog annotations are essentially the user interface of EnviroLog. Annotated applications are then processed by apreprocessorthat translates EnviroLog annota-tions into real code, and, based on the annotaannota-tions, integrates only the necessary modules from a code repository into the applications. The preprocessor and the code repository constitute EnviroLog services. As a result of the processing, application code is given the ability to record and replay specified events and to record and retrieve specified variable values that represent runtime status.
C. User Interface
Our design goal of simplicity calls for an easy user interface through which users are able to express the desired function-ality of EnviroLog in a simple and intuitive manner.
The user specifies two main issues: asynchronous environ-mental event record and replay, and runtime status record
and retrieve. The user interface design for the latter is easier since runtime status can be interpreted as values of variables at runtime. Such variables are simply annotated for logging. The former one is more complicated. As stated in the be-ginning of this section, EnviroLog supports environmental event record and replay by logging and regenerating data streams originating from environmental events. Since these data streams are transferred between modules through function calls and their parameters in most embedded systems such as TinyOS, we can log the behavior of a module by recording all issued function calls. Therefore, the only action an EnviroLog user is required to take is to specify a set of data-providing modules whose output data streams (issued function calls) are to be logged. The preprocessor takes the responsibility of enumerating function calls within the annotated modules and using APIs to log and replay each of them. To be more flexible, instead of specifying entire modules, advanced users are allowed to specify the exact function calls to be logged within a module.
Different from most services that usually provide function call APIs, EnviroLog provides EnviroLog annotations as the user interface. Table I lists the basic set of EnviroLog anno-tations.
The special characteristics of this user interface are: 1) EnviroLog annotations are simple to use. Users only need to insert annotations before function calls without worrying about details such as how these function calls are recorded, what data structures are used, and how and when to re-execute them when replaying. The preprocessor takes the responsibility to automatically generate code and integrate modules from the code depository to handle these details.
2) EnviroLog annotations take the form of comments that are ignored by the regular language compiler. This allows users to freely switch between original applications without EnviroLog integrated and EnviroLog-augmented applications. Annotated applications, when directly compiled, generate exe-cutables that do not include EnviroLog support. Alternatively, if they are processed by the EnviroLog preprocessor before compiling, the resulting executables are able to record and replay/retrieve the specified set of function calls and variable values based on user annotations.
To log environmental events, one option is to log the inputs of sensor drivers. However, users may focus on the evaluation and tuning of a specific layer higher than the layer of sensor drivers, thus requiring repeatable inputs to this layer. To fulfill such requirements, EnviroLog allows users to use EnviroLog annotations at any layer to enable repeatable input to that specific layer without interference from lower layers.
Though EnviroLog is geared for recording and replaying events of interest, it is also possible to choose whether to record the radio channel conditions using the user interface. If function calls to send messages or to cause the sending of messages are logged, the channel conditions are not captured and might be different between record and replay, depending mostly on the environment. Alternatively, if the programmers choose to log function calls that handle the reception of
mes-sages, the delivery of messages and their sequence should be the same between record and replay, no matter how the radio conditions change in reality. However, repeating the channel conditions is not always desired since in most experimental scenarios it is valuable to investigate how variances in channel conditions affect system behavior given the same sensory inputs.
D. Preprocessor
The simple user interface is supported by the preprocessor, which takes applications with EnviroLog annotations as input and outputs applications with EnviroLog code incorporated. The functionality of the preprocessor includes:
• Enumerating function calls and variables to be logged
and assigning unique IDs, calledlog IDs, to them;
• Translating EnviroLog annotations into code that
per-forms three functions. It defines the data structures for function parameters. It uses APIs provided by the record and replay module to record log IDs together with func-tion parameters or variable values at the record stage. Finally, it re-executes at the replay stage the function calls upon the reception of logs from the record and replay module;
• Selecting necessary modules from the code repository and
integrating them into applications.
To enhance robustness, logged data must be consistent with the current application during replay. Replaying data to the wrong application is not meaningful. A simple approach to ensure consistency is to use an ID, called theapplication fam-ily ID (or application ID for short) to denote the application tuned or the class of applications compared. The ID is logged as metadata at the record stage and is verified before replay. This ID is either specified by the application programmer who has the knowledge of which applications belong in the same family, or, if not specified, automatically created by the preprocessor by hashing the set of logged function calls into an application ID. The former solution allows for more flexibility while leaving the responsibility of ensuring consistency to the programmer. In the latter case, the same ID is generated as long as users don’t change the set of function calls to be logged. This approach ensures consistency between logs and applications, making application IDs transparent to users since they are automatically handled by the preprocessor. Note that, both solutions enable repeatable environmental input to different application versions. Both the log modules and the target modules can be different between record and replay stage as long as data interfaces (in other words, the set of logged function calls) between them are the same.
Another challenge is to ensure complete and consistent replay, which means that:
• System outputs should be exactly the same during the
record stage and replay stage, as long as target modules are not changed.
• Changes to target modules for purposes such as
TABLE I
ENVIROLOG ANNOTATION LIST
Purpose Annotation Usage Functionality
For event record and
replay /*LOG MODULE*/ Insert the annotation in the beginning ofthe implementation of a module To record all function calls issued in themodule for future replay /*LOG FUNCTION*/ Insert the annotation before a clause that
makes a function call To record the function call for futurereplay
For system status
record and retrieve
/*LOG VARIABLE: vari-able name*/
Insert the annotation with specified vari-able name at a position within scope of the variable
To record current value of the variable for future retrieve
modules. If the target modules can affect the behavior of log modules, EnviroLog design may be unrealizable. For example, if power management services can dynamically select a subset of nodes and turn them off, a situation can arise where a node is turned off during the record stage but turned on during the replay. It is obviously impossible to decide on the correct value to be replayed since none was recorded. Another example is when a different (e.g., faster) sensor sampling rate is set by target modules during replay. Since data was recorded at a different rate, the information to be replayed is not available in the log. Both of the aforementioned cases are hard to accommodate, and are therefore not allowed.
With the prior guarantee that the two special cases above don’t exist in a given application, the preprocessor can provide some consistency checks. To enable these checks, in addition to the set of log modules (L), users are required to specify the set of modules (I) that directly interact with the environment (e.g., senor drivers) and the set of modules (O) that provide system outputs (e.g., modules reporting final decisions to base stations). If one moduleuissues one or more function calls to another module v, we denote this relationship asu→v. To formalize the initial check procedure, we further define that i
represents system inputs, o represents system outputs andM
represents the set of all application modules. Based on user inputs (L, I, O) and definitions (i, o, M), the preprocessor abstracts the application into a directed graph G = (V, E), where:
V ={u|u∈M} ∪ {i} ∪ {o}
E={(u, v)|(u, v∈M ∧u→v)∨(u=i∧v∈I)
∨(u∈O∧v=o)}
Given the set of log modules (L) specified by the user and the calling graph G, the consistency check is done first by removing all edges that originate from vertices representing these log modules from the graph, which forms a new graph
G0 = (V0, E0), where:
V0 =V
E0=E− {(u, v)|u∈L}
If G0 doesn’t contain a directed path from i to o, the log
module set is guaranteed to provide complete and consistent replay; otherwise, it may not be true.
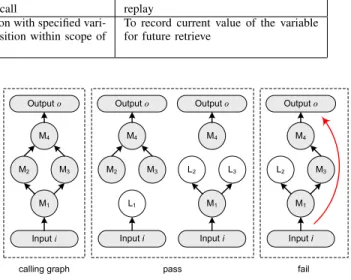
Figure 3 gives an example to show more concretely the consistency check algorithm. Assume the application contains four modules,M1throughM4. ModuleM1directly consumes
calling graph Output o Input i M4 M3 M2 M1 Output o Input i M4 M3 M2 L1 Output o Input i M4 L3 L2 M1 Output o Input i M4 M3 L2 M1 pass fail
Fig. 3. Examples of consistency checks
environmental inputs and issues function calls to M2 and M3. Both M2 and M3 further issue function calls to M4.
Finally,M4produces system outputs. The preprocessor builds
the calling graph between application modules, adds outputo
and input i as virtual modules, connects input i to modules that directly consume environmental inputs (M1), and connects
modules producing system outputs (M4) to outputo. The result
is the directed graph shown on the left rectangle of Figure 3. According to the algorithm, for each logged module, we then remove its outgoing edges from the graph. If the resulted graph doesn’t contain any directed path from inputito output
o, complete and consistent replay is guaranteed. As shown in the middle rectangle, logging ofM1or logging ofM2andM3
ensures complete and consistent replay since no path exists from inputi to output o. However, if only M2 is logged, as
shown in the right rectangle, a directed path traversingM1,M3
andM4exists between inputiand outputo, which fails in the
consistency check and warns against a potentially incomplete or inconsistent replay.
Note that passing the initial checks is a sufficient, but not necessary condition for a complete and consistent replay guarantee, since not all function calls are issued due to environmental events. Thus, a directed path from itoo does not necessarily indicate that system outputs will indeed be affected by environmental inputs.
E. Stage Controller
EnviroLog needs runtime facilities to control (during execu-tion) when to record environmental events or system status and when to replay events as well as to retrieve recorded system status. For this purpose, we provide the stage controller to interact with users during runtime, employing a client/server
architecture. The server node, connected to a PC, receives commands from users through a command-line interface or GUI and disseminates them to client nodes. Upon the reception of commands, client nodes execute corresponding code for commands immediately or at a requested future time.
Each command must include a command name and a stage name. Command names include start, stop, pauseand continue. Stage names can be record, replayor retrieve. The time period between the start of a stage and the stop of that stage is called arun. Other optional parameters in a command include a replay speed for the replay stage to request that logged events be replayed ntimes faster or slower than their original rate. For a retrieve stage, variable names and/or node IDs can be specified to denote the name of a variable whose recorded values and timestamps in the specified node are to be retrieved. Any stage can also specify arun IDto select the logs for the particular run the command will operate on.
To provide accurate replay for applications involving mul-tiple nodes, one critical factor is that they have to be syn-chronized. In other words, these nodes have to execute the same command at the same time. If the same command is always delivered to all nodes at the same time, we can simply program nodes to execute the command right after its reception without worrying about synchronization. However, the assumption doesn’t hold for multi-hop applications or single-hop applications with lossy links. We solve the problem by proposing two-phase command execution, which makes use of time synchronization and system-wide broadcast. When issuing commands, users are required to provide a future time as a command parameter, which specifies when the command is to be executed. Then, in the first phase, the command and synchronization beacons originated from the server node are propagated across the entire network to synchronize clocks of client nodes as well as to broadcast the command. When the specified future time comes, client nodes enter the second phase simultaneously to execute the command. Two-phase command execution is costly because of its time synchro-nization service and repeated system-wide broadcast. To be flexible, advanced users are allowed to configure the stage controller into its lightweight single-hop version as well as a version with two-phase command execution support.
Researchers on time synchronization [14] for current hard-ware platforms have observed a significant variance in clock frequency due to the instability of the used crystals. Although mechanisms like linear regression are able to compensate for clock drifts in the short term (e.g., within 30 seconds), periodic re-synchronization through messages is inevitable for long-term experiments to keep the error to the microsecond range. As a result, long experiments tend to introduce more inaccuracy if using two-phase command execution. In such a case, an alternative solution would be to keep the time syn-chronization service on throughout the two phases assuming that re-synchronization messages do not alter the behavior of the applications.
F. Record and Replay
The record and replay service is the core component of EnviroLog. It responds to stage control commands to switch between different stages, logs data into flash during recording, reads from flash the logged function calls to re-issue them in their original time sequence during replay, and reads from flash the logged variable values during status retrieving. Besides maintaining logs of function calls and variable values, it also maintains metadata such as application ID, run ID, and run length during recording, which are to be verified when replaying. The service also supports the replay of events at a speed different from recorded one, which can be used to emulate extremely fast or slow targets that are hard to generate physically.
1) Queue-based File System: If metadata and logs of one run are viewed as one file, we can easily design the service based on existing file systems such as Matchbox [4] and ELF [3]. To be comprehensive, these file systems usually support various file operations such as open, close, read, write, and append, consuming a lot of code as well as data memory. Our design goal of efficiency calls for a simpler solution. Hence, we propose aqueue-based file system, where files are organized into one queue. At any point in time, only the file at the tail of the queue is writable and new data is always appended to this file. Only the file at the head of the queue can be deleted. It differs from typical file systems in that (i) each file occupies a continuous storage space, and (ii) the gap between two successive files is always smaller than one page. The queue-based file system brings about several benefits:
• It realizes the special characteristics of the logging
be-havior in EnviroLog: logs are sequentially written into flash, and oldest logs are usually most undesired.
• It exhibits low resource consumption. This file system
only supports a minimum set of operations (file creation, sequential write, sequential read, file deletion) that is necessary in EnviroLog. The queue-based design elimi-nates the need for complicated storage space management such as free page maintenance and flash defragmentation. Hence, it consumes minimum code and data memory.
• It prolongs lifetime of flash memory by balancing writes
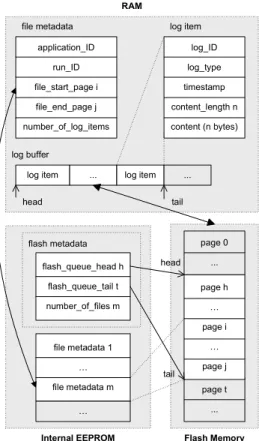
to different pages. Each flash page has a write limit of about 10,000 times. In the queue-based file system, the sequential write access to flash pages ensures that the number of writes to different pages differs at most by 1. 2) Distribution of Data Structures: Although the ultimate storage space for logs is flash, during runtime, multiple mem-ory levels are employed to improve efficiency and reliability. Figure 4 depicts the distribution of data structures in RAM, internal EEPROM and external flash.
Because flash access is relatively slow (e.g., for flash AT45DB041B used in MICA motes, erasing a page takes up to 8ms and writing a page takes up to 14ms), the service employs a buffer in RAM, calledlog buffer, to temporarily store logs before committing them into flash.Log items constructed for function calls or variable values to be recorded are queued in
… file metadata 1 … file metadata m flash metadata page t ... page h … page i … page j log_ID log_type timestamp content_length n content (n bytes) flash_queue_head h flash_queue_tail t number_of_files m page 0 ... application_ID run_ID file_start_page i file_end_page j number_of_log_items
log item ... log item ...
head tail
file metadata log item
log buffer … head tail Flash Memory Internal EEPROM RAM
Fig. 4. Data distribution in different memory levels
this log buffer. Each log item consists of a log ID, a log type (eventorstatus), a timestamp, log content (parameters of function calls or values of variables) and content length. We note that buffering can not only increase throughput of flash access, but also accommodate temporary data bursts typical in event detection or tracking applications. Another benefit of buffering is to support potential data compression. Many log items can be compressed before being written into flash to conserve space, including those containing the same content but different timestamps and those containing timestamps with fixed differences.
All log items of a run constitute a file, which is usually stored in flash. Access to a file is usually sequential, either reading from the beginning to the end or writing from the beginning to the end. Besides files, the metadata of files (file metadata for short) and the metadata of the queue (flash metadatafor short) also require permanent storage. Different from access to files, access to metadata is much more frequent, that is why we store such data into the internal EEPROM of MICA motes which is smaller (4KB) but with a longer endurance (100,000 write/erase cycles) compared with the flash memory (512KB, 10,000 write/erase cycles). For other sensor devices without EEPROM, EnviroLog can be adapted to reserve several pages in flash for metadata storage. These pages are expected to be worn out earlier than other pages, which makes the usable flash size smaller.
3) Workflow of Different Stages: This section explains the execution flow of the record and replay service during different
stages in more detail.
At the beginning of a record stage, upon the reception of a start record command, the service reacts by: (i) remembering the current time as the reference time, (ii) loading flash metadata into RAM, and (iii) constructing the metadata of a new file. During the record stage, whenever the application requests to record a function or a variable value, the service constructs a corresponding log item and enqueues it into the log buffer. The log item contains a relative timestamp, which is calculated by subtracting the reference time from the current time. If more than half of the buffer is filled up, all log items in the buffer are transferred into flash, which empties the buffer completely. An alternative choice would be to write everything in the buffer into flash whenever a new log item arrives. We decide on the former option, since higher throughput is observed for bigger block sizes in flash access (experiments on LogData component provided by TinyOS show that flash write speed is 12.99KB/s for a block size of 16B and 42.37KB/s for a block size of 128B). Finally, upon the reception of astop recordcommand, the service updates flash metadata and file metadata and commits them into EEPROM.
At the beginning of a replay stage, when astart replay command is received, the service takes several initial steps: (i) it loads into RAM the metadata of the corresponding file, whose run ID matches the one indicated in the command; (ii) to ensure data consistency, before replaying, it further verifies the application ID contained in file metadata against the one indicated by the user or produced by the preprocessor; (iii) it loads log items from flash to fill up the log buffer. After initialization, the service marks the current time as the reference time and starts to replay logged events. During replay, the service automatically loads data from flash to fill up the buffer whenever the buffer is half-empty. The service discards allstatuslog items and replayseventlog items one by one. It dequeues the first event log item from the buffer, sets a timer based on the timestamp contained in the item, and upon the expiration of the timer, issues the corresponding function call. Then it proceeds with the next log item. The expiration timeTexpiration is calculated as follows:
Texpiration=
Tref erence+Ttimestamp−Tcurrent Sreplay
where Tref erence, Ttimestamp, and Tcurrent represent the
reference time, the timestamp, and the current time respec-tively, and Sreplay represents replay speed. As discussed
before,Sreplay is one of the parameters ofstart replay
commands to speed up or slow down replay. Another way to calculate the expiration time is to take the difference between the timestamps of two successive events and divide it by Sreplay. It is deserted because it makes time accuracy
of the latter event always depend on the former one, and consequently accumulates errors over time. The replay stage ends when the entire file is processed or a stop replay command is received.
event log items. For status log items, it extracts the variable values and sends them to the stage controller, which then displays the data for end users.
IV. IMPLEMENTATION
In this section, we describe an implementation of Envi-roLog, which has been fully tested on Mica2 and XSM hard-ware platforms. This implementation is expected to work on Mica and Mica2Dot as well. The common features of hardware platforms that this version of EnviroLog operates on are (i) 4KB EEPROM inside the micro-controller and (ii) 512KB external data flash. EnviroLog is implemented on TinyOS 1.x, a popular operating system for the aforementioned hardware platforms. Table II lists the implementation characteristics of different components in EnviroLog.
A. Preprocessor Implementation
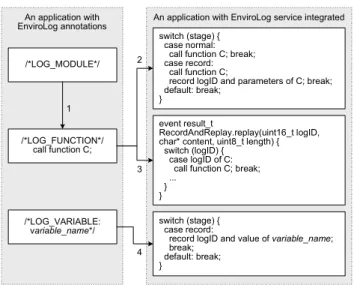
The preprocessor is essentially a translator that takes a TinyOS application annotated with EnviroLog annotations as input and outputs its corresponding version with the EnviroLog service integrated. Figure 5 depicts the main steps of this translation:
• Step 1: For modules annotated by /*LOG MODULE*/,
the preprocessor enumerates all function calls is-sued by these modules and annotates them by /*LOG FUNCTION*/.
• Step 2: The preprocessor scans the entire application
to search for all function calls that are annotated by /*LOG FUNCTION*/. A unique log ID is assigned to address each of them. The clause that issues an annotated function call is replaced by a segment of code that (i) issues the function call only when the application is not at the replay or retrieve stage, and (ii) records the call’s log ID and parameters during the record stage using APIs of the record and replay service.
• Step 3: The preprocessor also creates event handlers to
handle replay requests from the record and replay service. For each replay request, it generates code to extract parameters and execute the corresponding function call.
• Step 4: after scanning the entire application, the
pre-processor enumerates EnviroLog annotations in the form of/*LOG VARIABLE: variable name*/. The pre-processor assigns unique log IDs to them, and translates each of them into a segment of code that records the variable value and its log ID using APIs of the record and replay service.
The preprocessor then automatically wires necessary com-ponents (e.g., the record and replay service) into the resulting application to complete the integration of EnviroLog. B. Stage Controller Implementation
Figure 6 depicts the field deployment of a system to use the stage controller. End users type-in stage control commands through the PC. The server node, which is connected to the PC through a serial cable, forwards the commands to the field. The client nodes in the field propagate the commands throughout
An application with EnviroLog annotations
An application with EnviroLog service integrated
/*LOG_MODULE*/ /*LOG_FUNCTION*/ call function C; /*LOG_VARIABLE: variable_name*/ switch (stage) { case normal: call function C; break; case record: call function C;
record logID and parameters of C; break; default: break;
}
event result_t
RecordAndReplay.replay(uint16_t logID, char* content, uint8_t length) { switch (logID) {
case logID of C: call function C; break; ...
} }
switch (stage) { case record:
record logID and value of variable_name; break; default: break; } 1 2 3 4
Fig. 5. Translation steps of the preprocessor
Client nodes Server node
PC
Fig. 6. A field deployment to use the stage controller
the field, and execute them immediately or in a two-phase manner.
We implement a simple Java tool on the PC to interact with end users. This tool has several functionalities such as: (i) encoding stage control commands into messages, (ii) injecting the messages into the server node through the serial port, (iii) receiving messages from the serial port, and (iv) displaying retrieved variable values to end users during the receive stage. The server node, running the TOSBase application provided by TinyOS, forwards messages between the PC and client nodes. The client nodes run the system with EnviroLog integrated, which includes a stage controller component.
The implementation of the single-hop version of the stage controller is simple. Commands are immediately executed upon reception and execution results, if any, are sent back to the server node through one-hop unicast. The multi-hop version that supports two-phase command execution needs more functionality. First, it contains a time synchronization service modified from multi-hop FTSP [14]. Multi-hop FTSP utilizes periodic flooding of synchronization beacons to per-form continuous re-synchronization. We modify it to stop the periodic beacons at the end of the first phase; otherwise, these beacons may interfere with the system and change its behavior. Second, to conserve energy, commands are piggybacked onto periodic synchronization beacons. Client nodes remember the command when they receive the first synchronization beacon. The periodic nature of synchronization beacons also makes the dissemination of commands robust to sporadic message losses.
TABLE II
IMPLEMENTATION CHARACTERISTICS OFENVIROLOG COMPONENTS
Component Language Code length (lines) Data memory (bytes)
Preprocessor Perl 873
Stage controller nesC 604 single-hop:46, multi-hop:137
Record and replay nesC 758 54+buffer size
1
4 interface RecordAndReplay {
command result_t record(uint16_t logID, uint8_t logType, char* content, uint8_t length); event result_t replay(uint16_t logID, char* content, uint8_t length);
event result_t retrieve(uint16_t logID, char* content, uint8_t length);
command result_t executeCommand(uint8_t name, uint8_t stage, char* parameters); }
3 2
Fig. 7. Interface of the record and replay component
Third, the service incorporates a simple routing algorithm to collect execution results from client nodes. The routing service we implement is similar to directed diffusion [9]. Although the primary purpose of synchronization beacons is to synchronize clocks of client nodes, they also serve as interest beacons for client nodes to set up reverse paths to the server node. Later on, execution results can be sent back to the PC along those paths. Note that, the modified Multi-hop FTSP and the simple routing service become parts of the EnviroLog service only if users configure the stage controller as a multi-hop one before the application gets processed by the preprocessor. They are only invoked during the two-phase command execution and, therefore, are independent of any time synchronization or routing service used by user applications.
C. Record and Replay Implementation
The record and replay service provides a set of APIs to interact with application components and other Envi-roLog components. It is implemented in one big com-ponent named RecordAndReplayC. Figure 7 illus-trates the RecordAndReplay interface provided by the RecordAndReplayC component and Figure 8 depicts the interactions between this component and other components in the system. Application components (already processed by the preprocessor) call the command record to log function calls as well as variable values. During the replay stage, the record and replay component signals the event replay to request application components to execute the corresponding function calls. Another eventretrieveis signaled to trans-fer retrieved variable values to the stage controller component, which then communicates the data back to the server node and, finally, to the PC. The stage controller component interacts with the record and replay component by issuing the command executeCommandto execute stage control commands from end users.
The record and replay component relies on several TinyOS modules: clock, timer, EEPROM access, and flash access. The clock component is used for the purpose of timestamp calculation. The timer component is utilized during replay to issue logged function calls in their original time sequence. Flash access and EEPROM access components are
User Application
Record and Replay
Stage Controlller
Time Timer 2
1 3 4
EEPROM Access Flash Access
Fig. 8. Interactions between the record and replay component and other components
employed to read/write logged data and metadata.
V. PERFORMANCEEVALUATION
To evaluate the effectiveness and efficiency of the recording and replay service provided by EnviroLog, we integrate Envi-roLog into several sample applications delivered with TinyOS, download them onto XSM motes, and carry out a set of empirical experiments. The XSM platform is an extended ver-sion of MICA2 motes, featuring improved peripheral circuitry, improved antenna and new types of sensors. The purpose of these microbenchmarks is to characterize the performance of EnviroLog by illustrating its maximum recording period, throughput, overhead, and replay accuracy.
Based on a complex surveillance system called Vigilnet [7] running on TinyOS and XSM platforms, we show the various functionalities of EnviroLog by using the recording and replay service to tune and evaluate performance of Vigilnet, to collect its runtime status and to replay targets with virtually increased or decreased velocities.
A. Microbenchmarks
In this section, we pick several sample applications provided by TinyOS and run a series of microbenchmarks to show how EnviroLog performs in terms of maximum recording period, throughput, overhead, and replay accuracy. These results, collected from simple applications, provide insights into the relevant basic aspects of EnviroLog’s expected performance. Larger, more realistic applications are investigated later, high-lighting higher-level performance aspects.
1) Maximum Recording Period: Due to limited storage space, EnviroLog cannot continuously record an infinite num-ber of events. The termmaximum recording period describes how long EnviroLog is able to continuously record. Maxi-mum recording periodRPmax depends on three factors: flash
size Sf lash, expected event interval E{eventInterval} and
expected log item lengthE{logItemLength}. The expected event interval indicates the average length of the time intervals between successive events. The expected log item length
0 10000 20000 30000 40000 50000 60000 70000 10 100 1000
Expected event interval (ms)
Max
imum rec
ordi
ng peri
od (s
) Expected log item length-8B Expected log item length-16B Expected log item length-24B Expected log item length-32B
Fig. 9. Maximum recording period for different expected event interval and log item length
indicates the expected flash space a recorded event occupies. The maximum recording period is calculated as follows:
RPmax=
Sf lashE{eventInterval}
E{logItemLength}
Setting the flash size to be 512KB, Figure 9 depicts the max-imum recording period for different expected event intervals and log item lengths. Typical raw sensing data, if generated at 10Hz, can be recorded for about 90 minutes, which is usually long enough for purposes of debugging or tuning sensor drivers.
2) Throughput: The throughput of EnviroLog (i.e., how fast EnviroLog is able to record) is evaluated based on the Blink application.Blinksets a periodic timer and toggles the red led when the timer fires. EnviroLog is used to record the toggling of the red led. The log item length equals the length of the log item header (7 bytes) since the toggling event contains no parameters. To make the scenario more realistic, the occurrences of toggling events are modeled as a Poisson process by making the time intervals between successive events exponentially distributed with the density function
f(x) =λe−λx
whereλis the expected event interval.
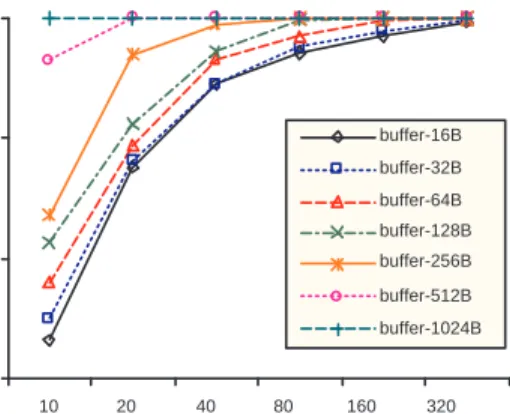
To increase throughput, EnviroLog buffers events in mem-ory before committing them to flash. We repeatedly change the expected event interval and buffer size, compile and download changedBlinkonto a XSM mote and measure the success ratio of recording operations. Figure 10 illustrates the experimental results. Each point in this figure is the average of at least 10 runs to achieve a high confidence level. As shown in Figure 10, a higher success ratio is observed for lower event rates and bigger buffers. For events at 10Hz, a 128-byte buffer is enough to ensure a 100%success ratio.
3) Overhead: EnviroLog introduces a certain overhead, which may affect the runtime behavior of the original appli-cation. It must be verified that EnviroLog does not change the behavior of the original application dramatically during recording; otherwise, the replay of recorded behavior (which is dramatically different from the original behavior) becomes meaningless. 0.85 0.9 0.95 1 10 20 40 80 160 320 E(Event Interval) (ms) S uc c es s Rati o buffer-16B buffer-32B buffer-64B buffer-128B buffer-256B buffer-512B buffer-1024B
Fig. 10. Success ratio of recording operations for different expected event rate and buffer size
We try to quantify the overhead and its effect through an example application CntToLedsAndRfm. The application maintains a counter on a 4Hz timer and sends out the value of the counter by broadcast on each increment. The execution of the command that outputs the value of the counter by messages is recorded and replayed by EnviroLog. We change the message format to contain the sendtime of the current message and thesendDonetime of the previous message in addition to the value of the counter, so that the time period to send a complete message, defined as sending delay, can be calculated by overhearing these messages. The modified CntToLedsAndRfm application is run on one XSM mote. Another XSM mote works as the server node of the stage controller to control the stage as well as overhear messages.
This experiment compares the sending delay during a nor-mal stage with the one during a record stage to quantify the overhead of recording operations. Figure 11 depicts the cumulative distribution function of sending delay for 1000 messages during the normal stage and 1000 messages during the record stage. A longer sending delay is observed during the record stage compared with the normal stage, which indicates the overhead of recording operations. However, the effect of the overhead is trivial and acceptable. It is observed that the 95% confidence interval of the sending delay during the recording stage drifts only 0.4ms from the one during the normal stage.
4) Replay Accuracy: In this experiment, we use the same modified version ofCntToLedsAndRfm as in the previous experiment. We first log about 100 commands by EnviroLog and overhear the messages to remember their send time. The remembered send time is actually the time when each logged command is executed. Then, we replay those commands 20 times. We calculate the difference between the average send time during the replay stage and the original send time during the record stage and depict its cumulative distribution in Figure 12. The results reflect how accurate the replay service is. As Figure 12 shows, the average error is less than 1ms.
0 0.2 0.4 0.6 0.8 1 10 20 30 40 Sending Delay (ms) P erc entage normal stage record stage
Fig. 11. Comparison of sending delay between normal stage and record stage 0 0.2 0.4 0.6 0.8 1 -0.7 -0.6 -0.5 -0.4 -0.3 -0.2 -0.1 0 0.1 0.2 0.3 0.4 Difference of Event Arrival Time (ms)
P
erc
entage
Fig. 12. Difference of send time between record stage and replay stage
B. Macrobenchmarks
Based on a surveillance system called Vigilnet [7], this sec-tion evaluates the effectiveness of EnviroLog in practice and showcases the variety of functionalities it provides. We first introduce the experimental methodology, including hardware, software and deployment scenarios. Then, we show the ef-fectiveness of EnviroLog by recording and replaying different types of targets. Finally, we show how EnviroLog aids in-field tests of Vigilnet in various ways, including performance tuning and evaluation, runtime status collection and virtual velocity simulation.
1) Methodology: Vigilnet, implemented in TinyOS for XSM platforms, is targeted to detect, classify and track various events of interest in real-time through in-network processing. It takes environmental targets as inputs, applies multiple levels of processing before outputting results to end users. The lowest layer is sensor drivers which sample raw data from sensors and, if any target of interest is detected, signal detection results to higher layers. The layer above sensor drivers is a set of group management protocols that dynamically organize nodes in the vicinity of targets into local groups, collect detection results from individual nodes, elect leaders to aggregate these results and send aggregate data to nodes connected to base stations (base nodes). Target positions, as part of the aggregate data, are calculated by averaging locations of detection nodes. The highest layer is located in base nodes, where aggregate reports from leaders are further processed to extract properties such as target velocities. The highest layer outputs target types (vehicles or persons), trajectories and velocities to a GUI
0 10 20 30 40 50 60 70 0 10 20 30 40 50 60 70 X (meter) Y (meter)
Fig. 13. System deployment
which displays results to end users.
An obvious use of EnviroLog in this system would be to debug sensor drivers, to tune their sensor data processing parameters (e.g., various filters), or to compare their different versions by recording and replaying raw sensing data on individual nodes. However, what is more interesting is to see how EnviroLog aids the in-field tests of higher layers that involve coordination among multiple nodes in a multi-hop wireless network. Towards that end, we insert EnviroLog between the sensor driver layer and the group management layer, record outputs of sensor drivers rather than raw sensing data, and focus on the behavior of layers higher than the sensor drivers.
Vigilnet employs three types of sensors: magnetic, acoustic and motion sensors. Their drivers interact with higher layers by signaling instances of the following event:
event result t detected(TargetConfidence confidences);
whereTargetConfidenceis an array of integers, each representing the possibility of a certain target type.
To integrate EnviroLog into the system, we simply insert /*LOG FUNCTION*/ before each clause that signals the event, and process the code using the preprocessor before com-piling the system. To collect empirical data, we download the system onto 37 XSMs. We deploy the XSMs approximately 5 meters apart on both sides of a driveway, as shown in Figure 13. The triangle marks the position of the base node connected to a laptop.
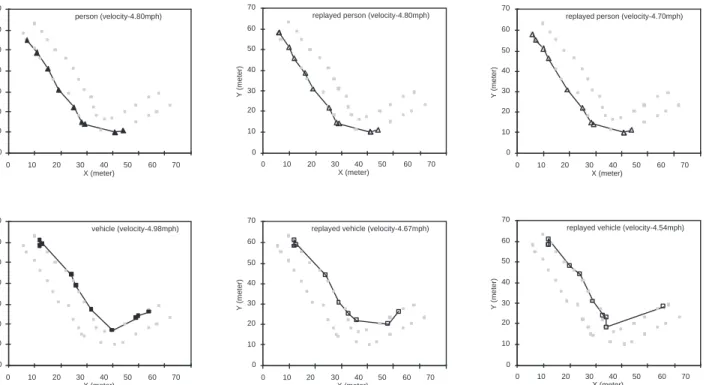
2) Effectiveness: To evaluate the effectiveness of recording and replay, we first set the system to be at record stage, and physically generate targets by jogging or driving through the driveway. The trajectories and calculated velocities for the jogging person and the vehicle are shown separately in Figure 14(a) and 14(d). Later on, we switch the system to its replay stage to virtually replay the jogging person and the vehicle. Figure 14(b) and 14(c) shows two different replays of the person, while Figure 14(e) and 14(f) shows two replays of
person (velocity-4.80mph) 0 10 20 30 40 50 60 70 0 10 20 30 40 50 60 70 X (meter) Y (meter)
replayed person (velocity-4.80mph)
0 10 20 30 40 50 60 70 0 10 20 30 40 50 60 70 X (meter) Y (meter)
replayed person (velocity-4.70mph)
0 10 20 30 40 50 60 70 0 10 20 30 40 50 60 70 X (meter) Y (meter) vehicle (velocity-4.98mph) 0 10 20 30 40 50 60 70 0 10 20 30 40 50 60 70 X (meter) Y (meter)
replayed vehicle (velocity-4.67mph)
0 10 20 30 40 50 60 70 0 10 20 30 40 50 60 70 X (meter) Y (meter)
replayed vehicle (velocity-4.54mph)
0 10 20 30 40 50 60 70 0 10 20 30 40 50 60 70 X (meter) Y (meter)
Fig. 14. Trajectories and calculated velocities for physical and replayed targets
the vehicle.
As is seen for both the person and the vehicle, the tra-jectories of real targets and replayed ones are very close, and the differences of their calculated velocities are below 0.5 mph. This observation verifies the effectiveness of En-viroLog. However, outputs are not exactly the same, which is expected considering the variability in layers above sensor drivers. For example, communication delays may change due to randomness in the MAC layer especially when multiple neighboring nodes request to send simultaneously. This also explains why replay of the person is more accurate than that of the vehicle. A person is usually detected by only one node while vehicles can be detected by multiple nodes simultaneously, which causes those nodes to send detection reports to leaders simultaneously. The possibility that these detection reports are always received by the leader in the same order during different runs is very low, which leads to the minor differences among observed target trajectories.
3) Potential Uses - Performance Tuning and Evaluation: A big portion of wireless sensor network applications are outdoor applications that detect targets or monitor environments. It is difficult to evaluate such applications by simulators, which either can’t simulate environmental inputs or can’t realistically simulate them. The environments are much more complex than what simulators can model. Even the modeling of the magnetic field near a vehicle is extremely challenging due to the uneven and unknown distribution of metals inside the vehicle. The lack of realistic sensing models makes in-field testing a necessary step before the real deployment of
most applications involving target detection or environmental monitoring. EnviroLog makes in-field tuning and evaluation much easier as shown by the following experiments.
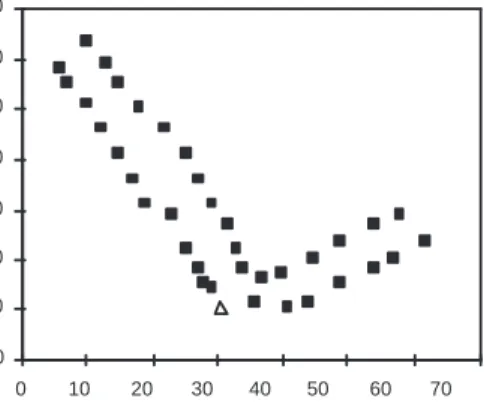
In Vigilnet, the group management layer used to group nodes that detect the same target has a tunable parameter called DOA (degree of aggregation). It is used to eliminate sporadic false positives in target detection. Group leaders do not report the detection of a target to the base station until the number of nearby nodes that detect the target reaches DOA. Higher DOA filters out more false positives, thus reducing the number of reports from leaders. However, too high DOA results in false negatives. To find out the proper DOA, we have to drive the vehicle or walk through the field multiple times while tuning this parameter. EnviroLog provides an alternative way to tune DOA with less overhead. We drive a vehicle or walk once to record the environmental inputs, then replay them multiple times with different DOA values. Figure 15 shows target trajectories for different DOA settings. As is seen, a higher DOA results in fewer trajectory points, thus more inaccurate calculated velocities. When DOA reaches 4, the calculated velocity (10.96 mph) is far away from the ground truth (5±1 mph).
We also use EnviroLog to log and retrieve the number of aggregate reports during runtime. Figure 16 depicts the cumulative distribution of the number of aggregate reports for different DOA values. As expected, a higher DOA leads to fewer aggregate reports. These results suggest that DOA values of 1, 2 and 3 are acceptable settings, though a higher value that leads to less communication overhead is more preferred.
replayed vehicle (velocity-5.37mph) 0 10 20 30 40 50 60 70 0 10 20 30 40 50 60 70 X (meter) Y (meter) (a) DOA = 2
replayed vehicle (velocity-5.37mph)
0 10 20 30 40 50 60 70 0 10 20 30 40 50 60 70 X (meter) Y (meter) (b) DOA = 3
replayed vehicle (velocity:10.96mph)
0 10 20 30 40 50 60 70 0 10 20 30 40 50 60 70 X (meter) Y (meter) (c) DOA = 4 Fig. 15. Trajectories and calculated velocities for different DOA
0 10 20 30 40 0.8 0.85 0.9 0.95 1
Cumulative fraction of nodes
Number of aggr. reports
DOA-1 DOA-2 DOA-3 DOA-4
Fig. 16. Cumulative distribution of number of aggregate reports for different DOA
4) Potential Uses - Runtime Status Collection: During development and testing, batteries are often depleted due to frequent experiments. One drawback of XSM motes is that batteries can not be measured or replaced without opening the package by unscrewing 4 screws. Vigilnet usually operates at the scale of hundreds of XSMs, which makes it extremely painful to check whether each node has a high enough voltage. Runtime status recording and retrieve supported by EnviroLog provides a simple solution for this problem. Voltage values of nodes can be logged and retrieved after each in-field test to find out those with low voltage, whose batteries then can be replaced before next test. Figure 17 shows the cumulative distribution of voltage values before and after the whole set of macrobenchmarks, which are collected through EnviroLog. 5) Potential Uses - Virtual Velocity Simulation: EnviroLog allows users to speed up or slow down the replay of events by setting a replay speed greater or less than 1. Note that changing replay speed is not always meaningful. For example, if sensor drivers pull data at a fixed rate and raw sensing data is logged, replaying at a different speed actually violates the logic of sensor drivers. In Vigilnet, EnviroLog records and replays the outputs of sensor drivers, which are detection events signaled by sensor drivers to higher layers. Replaying them at a higher speed can virtually simulate environmental targets with higher velocities. This experiment replays recorded events using different replay speeds to validate the effectiveness of virtual velocity simulation. Figure 18 depicts the calculated
0 0.2 0.4 0.6 0.8 1 2300 2500 2700 2900 Voltage(mV) Cumul ati v e frac ti on of nodes Before After
Fig. 17. Cumulative distribution of voltage values before and after experi-ments 0 20 40 60 80 100 1× 2× 4× 8× 16× Replay speed Cac ul ated target v el oc ity (mph) replayed vehicle replayed person ground truth
Fig. 18. Calculated velocities for different replay speed
velocities for different replay speeds and targets. When the replay speed doesn’t exceed 4×, calculated velocities for both the person and the vehicle are close to the ground truth. Higher replay speeds lead to intolerable errors in velocity calculation. C. Concluding Remarks
Results from the series of microbenchmarks and mac-robenchmarks above validate the effectiveness of EnviroLog for both simple and complex applications. EnviroLog is able to record and replay high frequency events if assigned a big enough buffer (e.g., recording 10Hz events with a 128-byte buffer in the Blink application). Its recording operations bring little overhead (e.g., adding only 0.4ms delay in the CntToLedsAndRfm application). It also replays events
ac-curately (e.g., the average difference between timestamps of recorded events and replayed events is less than 1ms). Envi-roLog has various potential uses for in-field tests of large-scale systems, including performance tuning and evaluation, and runtime status collection. EnviroLog can replay events at dif-ferent replay speed, which can be used to virtually simulate tar-gets moving at different velocities. EnviroLog is available for download at http://www.cs.uiuc.edu/homes/lluo2/EnviroLog/.
VI. CONCLUSION
With the increasing popularity of wireless sensor networks, an increasing number of realistic applications employing large systems of sensor devices emerge. Although the initial de-velopment and debugging of these applications can be aided by simulators, in-field tests still have to be conducted at a later stage due to typical discrepancies between simulation results and empirical measurements. In this paper, we present the design, implementation and evaluations of EnviroLog, an asynchronous event record and replay service that improves repeatability of environmental events for in-field testing of distributed event-driven applications. The friendly user inter-face of EnviroLog allows users to integrate and utilize the service merely by inserting annotations into their applications and learning a few operation commands. Based on several sample applications of TinyOS and a complicated surveillance system, we validate the effectiveness of event recording and replay. We demonstrate the usefulness of EnviroLog in various aspects of in-field tests such as performance tuning without physically generating events, runtime status collection without extra hardware, and virtual velocity simulation. However, the potential uses of such service are not limited to what we have discussed in this paper. EnviroLog can be further extended to perform remote replay (recording events in environment
Awhile replaying them remotely in environmentB), and off-site replay (recording events on sensor devices while replaying them in simulators), which are on our agenda for future work on EnviroLog.
REFERENCES
[1] Atmel Corporation. Mature AVR JTAG ICE.http://www.atmel.com/dyn/ products/tools-card.asp?tool-id=2737.
[2] M. A. Batalin, M. Rahimi, Y. Yu, D. Liu, A. Kansal, G. S. Sukhatme, W. J. Kaiser, M. Hansen, G. J. Pottie, M. Srivastava, and D. Estrin. Call and response: experiments in sampling the environment. InSenSys ’04: Proceedings of the 2nd international conference on Embedded networked sensor systems, pages 25–38, New York, NY, USA, 2004. ACM Press.
[3] H. Dai, M. Neufeld, and R. Han. Elf: an efficient log-structured flash file system for micro sensor nodes. InSenSys ’04: Proceedings of the 2nd international conference on Embedded networked sensor systems, pages 176–187, New York, NY, USA, 2004. ACM Press.
[4] D. Gay. Matchbox: A simple filing system for motes.
http://www.tinyos.net/ tinyos-1.x/doc/matchbox.pdf.
[5] L. Girod, J. Elson, A. Cerpa, T. Stathopoulos, N. Ramanathan, and D. Estrin. Emstar: a software environment for developing and deploying wireless sensor networks. InProceedings of the 2004 USENIX Technical Conference, June 2004.
[6] L. Girod, T. Stathopoulos, N. Ramanathan, J. Elson, D. Estrin, E. Os-terweil, and T. Schoellhammer. A system for simulation, emulation, and deployment of heterogeneous sensor networks. InProceedings of the Second ACM Conference on Embedded Networked Sensor Systems (SenSys’04), November 2004.
[7] T. He, S. Krishnamurthy, J. A. Stankovic, T. Abdelzaher, L. Luo, R. Stoleru, T. Yan, L. Gu, J. Hui, and B. Krogh. An energy-efficient surveillance system for sensor networks. In International Conference on Mobile Systems, Applications, and Services (MobiSys), June 2004. [8] J. Hill, R. Szewczyk, A. Woo, S. Hollar, D. Culler, and K. Pister.
System architecture directions for networked sensors. In ASPLOS-IX: Proceedings of the ninth international conference on Architectural support for programming languages and operating systems, pages 93– 104, New York, NY, USA, 2000. ACM Press.
[9] C. Intanagonwiwat, R. Govindan, D. Estrin, J. Heidemann, and F. Silva. Directed diffusion for wireless sensor networking. IEEE/ACM Trans. Netw., 11(1):2–16, 2003.
[10] D. Jia, B. H. Krogh, and C. Wong. TOSHILT: Middleware
for Hardware-in-the-loop Testing of Wireless Sensor Networks. http://www.ece.cmu.edu/ ˜webk/sensor-networks/toshilt/toshilt.html. [11] P. Levis, N. Lee, M. Welsh, and D. Culler. Tossim: Accurate and scalable
simulation of entire tinyos applications. InFirst International Confer-ence on Embedded Networked Sensor Systems (SenSys’03), November 2003.
[12] T. Liu, C. M. Sadler, P. Zhang, and M. Martonosi. Implementing soft-ware on resource-constrained mobile sensors: experiences with impala and zebranet. In MobiSYS ’04: Proceedings of the 2nd international conference on Mobile systems, applications, and services, pages 256– 269, New York, NY, USA, 2004. ACM Press.
[13] A. Mainwaring, D. Culler, J. Polastre, R. Szewczyk, and J. Anderson. Wireless sensor networks for habitat monitoring. In WSNA ’02: Proceedings of the 1st ACM international workshop on Wireless sensor networks and applications, pages 88–97, New York, NY, USA, 2002. ACM Press.
[14] M. Maroti, B. Kusy, G. Simon, and A. Ledeczi. The flooding time synchronization protocol. In SenSys ’04: Proceedings of the 2nd international conference on Embedded networked sensor systems, pages 39–49, New York, NY, USA, 2004. ACM Press.
[15] MICA motes. http://www.tinyos.net/scoop/special/hardware/. [16] ns-2. The Network Simulator. http://www.isi.edu/nsnam/ns/.
[17] Ohio State University. XSM. http://www.cast.cse.ohio-state.edu/exscal/ index.php?page=main.
[18] J. Polley, D. Blazakis, J. McGee, D. Rusk, and J. S. Baras. Atemu: A fine-grained sensor network simulator. InFirst International Conference on Sensor and Ad Hoc Communications and Networks, October 2004. [19] G. Simon, M. Maroti, A. Ledeczi, G. Balogh, B. Kusy, A. Nadas,
G. Pap, J. Sallai, and K. Frampton. Sensor network-based countersniper system. InSenSys ’04: Proceedings of the 2nd international conference on Embedded networked sensor systems, pages 1–12, New York, NY, USA, 2004. ACM Press.
[20] O. S. University.Kansei: Sensor Testbed for At-Scale Experiments, Feb 2005.
[21] Vanderbilt University. Message Center. http://www.isis.vanderbilt.edu/ projects/nest/msgctr.html.
[22] G. Werner-Allen, P. Swieskowski, and M. Welsh. Motelab: A wireless sensor network testbed. In Proceedings of the Fourth International Conference on Information Processing in Sensor Networks (IPSN’05), Special Track on Platform Tools and Design Methods for Network Embedded Sensors (SPOTS), April 2005.
[23] N. Xu, S. Rangwala, K. K. Chintalapudi, D. Ganesan, A. Broad, R. Govindan, and D. Estrin. A wireless sensor network for structural monitoring. In SenSys ’04: Proceedings of the 2nd international conference on Embedded networked sensor systems, pages 13–24, New York, NY, USA, 2004. ACM Press.
[24] X. Zeng, R. Bagrodia, and M. Gerla. Glomosim: A library for theparallel simulation of large-scale wireless networks. In Proceedings of the 12th Workshop on Parallel and Distributed Simulation (PADS’98), page 154C161, May 1998.