国立大学法人電気通信大学 / The University of Electro-Communications
IRT-Based Adaptive Hints to Scaffold Learning
in Programming
著者(英)
Maomi Ueno, Yoshimitsu Miyazawa
journal or
publication title
IEEE Transactions on Learning Technologies
volume
11
number
4
page range
415-428
year
2018-12
URL
http://id.nii.ac.jp/1438/00009282/
doi: 10.1109/TLT.2017.2741960IRT-based adaptive hints to scaffold learning in
programming
Maomi Ueno,
Member, IEEE,
and Yoshimitsu Miyazawa
Abstract—Over the past few decades, many studies conducted in the field of learning science have described that scaffolding plays an important role in human learning. To scaffold a learner efficiently, a teacher should predict how much support a learner must have to complete tasks and then decide the optimal degree of assistance to support the learner’s development. Nevertheless, it is difficult to ascertain the optimal degree of assistance for learner development. For this study, it is assumed that optimal scaffolding is based on a probabilistic decision rule: given a teacher’s assistance to facilitate the learner development, an optimal probability exists for a learner to solve a task. To ascertain that optimal probability, we developed a scaffolding system that provides adaptive hints to adjust the predictive probability of the learner’s successful performance to the previously determined certain value, using a probabilistic model, i.e., item response theory (IRT). Furthermore, using the scaffolding system, we compared learning performances by changing the predictive probability. Results show that scaffolding to achieve 0.5 learner success probability provides the best performance. Additionally, results demonstrate that a scaffolding system providing 0.5 probability decreases the number of hints (amount of support) automatically as a fading function according to the learner’s growth capability.
Index Terms—Learning science, Constructivism, Scaffolding, Dynamic assessment, Cognitive apprenticeship, Item response theory
F
1
I
NTRODUCTIONT
HE leading metaphor of human learning has recently been transferred from instructionism to social construc-tivism [1], [2] in an education society. Vygotsky (1962) introduced the Zone of Proximal Development (ZPD) with problem solving, where a learner cannot solve difficulties alone, but can do so with an expert’s help, thereby promot-ing learner development [1]. Bruner (1978), like Vygotsky, emphasized the social nature of learning, reporting that other people should help a child develop skills through the process of ”scaffolding” [3]. He defined scaffolding as steps taken to reduce the degrees of freedom in carrying out some task so that children can concentrate on difficult skills. The term ”scaffolding” first appeared in the literature when Wood et al. (1976) described how tutors interacted with preschoolers to help them solve a block reconstruction problem [4]. Scaffolding situations were those in which learners obtained assistance or support to perform tasks beyond their own capability if pursued independently when unassisted. Stone (1998) emphasized the dynamic charac-teristics of the scaffolding process, which is dependent on cycles of assessment and adaptive support [5].Brown and Ferrara (1985) [6] and Campione (1989) [7] worked on a new assessment method called ”dynamic as-sessment,” by which a cascading sequence of hints(so-called ”graded hints” ) is provided to enable dynamic assessment of how much support learners needed to complete various benchmark tasks. Each hint is staged in a graded fashion
• M. Ueno is with Graduate School of Information Systems, The University of Electro-Communications, 1-5-1, Chofugaoka, Chofu-shi, Tokyo 182-8585, Japan. E-mail: [email protected].
E-mail: [email protected]
• Y. Miyazawa is with the Research Organization for Next-Generation Education, Tokyo Gakugei University, 4-1-1 Nukuikita-machi, Koganei-shi, Tokyo 184-8501 Japan.
E-mail: [email protected].
known as a cascading sequence of hints. A learner is given a task to solve. If the learner can not solve the task alone, then the learner is given a series of graded hints one after another until the achievement is successful. The graded hints become more concrete as the sequence is followed. Results showed that learners who needed only a minimum number of hints to solve the tasks tended to achieve the greatest learning gain. Subsequently, scaffolding was in-corporated into cognitive apprenticeship theory [8]. It has played important roles in several learning theories. Collins et al. (1987) introduced ”fading” to scaffolding, meaning that once learners accomplish a target skill, the teacher reduces (or fades) learner participation, providing only limited hints, refinements, and feedback to learners, who practice successive approximation of smooth executions of the whole skill [8]. Pea (1993) claimed that scaffolding with fading is an intrinsic component that enables what he called ”distributed intelligence” [9].
Recently, a great deal of interest in the learning science field has arisen in the use of software tools to scaffold learners in complex tasks (e.g., [10], [11], [12], [13], [14], [15], [16], [17], [18], [19], [20], [21]), but these software tools have been unable to adapt to individual learners. However, in the Intelligent Tutoring System (ITS) field using a different approach from the Vygotskian, an adaptive function that uses a student model to select unmastered problems for a learner (e.g., [22], [23], [24], [25], [26], [27], [28], [29], [30], [31], [32], [33], [34], [35], [36]) has been proposed for adaptation to individual learners. This adaptive problem selection is known to be effective for learning, but it cannot adjust the degree of help for learner development. To realize adaptive help for a learner, many ITSs have technology that can provide a learner with adaptive assistance for problem solving (e.g., [37], [38], [39], [40], [41] ). Although this technology solves a learner’s impasse in problem solving,
it cannot adjust the degree of help for learner development. Some experiment results presented in these reports show that the adaptive help technology tends to over-instruct learners. It might actually obstruct effective learning [39].A tradeoff exists between information giving and withholding to achieve optimal learning. The tradeoff has recently been called the ’assistance dilemma’ [31]. To resolve this dilemma, some results of earlier studies suggest that on-demand graded hints, with each giving progressively more specific advice until the learners judge they accomplished the task, might be effective for learning [39], [42], [43], [44], [45], [46], [47], [48], [49], [50], [51], [52].
Although previous studies have produced several im-portant results for scaffolding, they have not clarified the mechanisms of effective scaffolding. Earlier studies have included two main problems.
1) Previous systems have been unable to predict a learner’s performance given scaffolding. Therefore, they have been unable to predict how much support learners require for optimal scaffolding.
2) No previous study has used a reasonable strategy of how to scaffold learners. The strategies must provide appropriate support to increase learners’ abilities.
Wood (2001) emphasized the importance of predicting a learner’s performance given scaffolding as future work in computer-based tutoring studies [52].
Pea (2004) pointed out that although a fading function is a necessary feature for scaffolding, many scaffolding systems have no such fading function [53]. The scaffolding system can necessarily derive a fading function if one is able to solve the problems of earlier studies.
The first problem is how to define the individual learn-ers’ development by learning. However, it is difficult be-cause ”development” means not only the increase of explicit knowledge that a learner has but the increase of more gener-alized abilities, including meta-knowledge, which underlie the problem solving in the field (e.g. [57]). In item response theory (IRT), the common ability that underlies problem solving is represented using a latent variable model [54], [55]. The probability of a correct response to a test item is modeled in IRT as a mathematical function of an individual latent ability variable.
Our main idea is using this IRT to represent the individ-ual learner’s development as the increase of the latent ability variable and then to provide optimal help for scaffolding learners by predicting a learner’s performance given several hints. To predict a learner’s performance given hints, we first propose an IRT model for dynamic assessment, by which learners are tested when given dynamic conditions of providing a series of graded hints. Then we estimate the model parameters from the obtained data. Next, we propose a scaffolding system that predicts the learner’s performance with hints based on the learner’s estimated ability and which presents adaptive hints to the learner. Specifically, the system provides hints to adjust the learner’s correct an-swer probability to the previously determined certain value. Here, we assume that the optimal scaffolding is based on a probabilistic decision rule. An optimal probability exists for a learner’s successful performance. To ascertain the optimal
probability, using the scaffolding system, we compared the learning performance by changing the predicted correct answer probability for several programming trace problems. Results reveal that the adaptive hint function is the most ef-fective for learning when we determine 0.5 to be the correct answer probability. Consequently, over-assistance and lack of help hinder rather than support a learner’s development. Additionally, they demonstrate that a scaffolding system with probability 0.5 decreases the number of hints (amount of support) automatically as a fading function according to the learner’s growth capability.
2
P
REVIOUS WORKSThis section presents a review of previous studies of computer-based scaffolding systems.
Various studies of computer-based scaffolding have been conducted in traditional subject areas of education such as reading (e.g., [10], [11], [12]), mathematics (e.g. [13]), and science (e.g. [14]).
Furthermore, recently, several scaffolding systems have been developed based on learning science theories.
Bell and Davis (2000) found that a scaffolding system used in science classrooms helped students identify ways to improve their understanding by helping students think individually and collaboratively to provide alternative ex-amples, thought experiments, and counter-evidence for con-sideration, and by providing a place to form their own thoughts about these ideas visibly and explicitly [15].
Davis and Linn (2000) investigated, using a technology-based study design, the learning and design questions that determine whether reflection prompts promotion of knowl-edge integration for students working on science projects [16] . Furthermore, they investigated the effects of students’ different dispositions on their reflection. They explored which characteristics of prompts best support students in knowledge integration. Results indicate that prompting stu-dents to reflect significantly increases knowledge integration in science projects. Results also showed that self-monitoring prompts, which encourage planning for and reflection on activities, helped students to demonstrate an integrated understanding of the relevant science. By contrast, activity prompts, which guided the inquiry process, were less suc-cessful in prompting knowledge integration.
Reiser (2004) addressed the problem of specific goals of scaffolding systems [17]. He presented two goals for scaffolding. One of these goals, called structuring, funda-mentally serves to simplify tasks for learners. He argued that researchers in the learning sciences field have come to emphasize this first mechanism for scaffolding. Yet Reiser suggested that a second goal, called problematizing, is at least as important. Scaffolding that problematizes student work draws learners’ attention to issues or tasks they might otherwise choose to ignore, in part because of their natu-ral tendency toward the path of least cognitive resistance. Reiser draws on the extensive literature as well as empirical and design work in his own research to argue that by making learning tasks more difficult in the short term, scaffolding designed with these twin goals in mind actually promotes students’ learning in the long term.
Tabak (2004) distinguishes three patterns of scaffolding: differentiated, redundant, and synergistic scaffolding [18]. She specifically examined how teachers, software, and other agents can work together to strengthen one another’s effects, arguing that the synergies created by multiple sources of and types of scaffolding can provide more powerful scaf-folding than might be expected from the sum of the parts.
Quintana et al. (2004) developed guidelines and strate-gies for the design of software scaffolding [19]. These guide-lines and strategies challenge learners to face engagement in complex learning tasks, grounding this framework in im-portant ways. According to these guidelines and strategies, they developed software applications.
Rittle-Johnson and Koedinger (2005) presented a methodology for designing better learning environments [20]. First, they assessed sixth-grade students’ prior knowl-edge using difficulty factors assessment (DFA). The assess-ment revealed that scaffolding designed to elicit contextual, conceptual, or procedural knowledge improved student abilities. Next, they designed an intervention based on scaffolding with this prior knowledge. They implemented a computer-based scaffolding system in mathematics classes.
Yelland and Masters (2007) reported that conceptualiza-tions of scaffolding are needed in computer contexts to gain greater insights into teaching and learning processes [21]. They reported that traditional forms of scaffolding, based on an ’expert’s’ view of how the problem should be solved, needed to be modified to accommodate the child’s perspec-tive. Moreover, they reported that scaffolding of three types can be conceptualized, which they designated as cognitive, technical, and affective. This study demonstrated that cog-nitive, affective, and technical scaffolding are beneficial for learning and that children can support mutual learning via sharing strategies and via articulation of their underlying reasons.
Consequently, previous studies using scaffolding sys-tems have examined effective scaffolding methods by em-phasizing learning strategies, collaboration, and synergies of scaffolding methods of various kinds, and so on.
However, although these software tools serve necessary functions for scaffolding, they have been insufficient to adapt to learners. As described previously, adaptive func-tions to learners have often been used in ITS fields (e.g. [22] ). To adapt to learners, intelligent tutor systems often track individual learners’ knowledge growth and support adaptive problem selection [23], [24], [25]. A popular track-ing method [23] uses the posterior probability of mastertrack-ing a knowledge component in the student model. The pos-terior probability is updated each time a learner encoun-ters a problem step involving the knowledge component. The posterior probability depends on the performance of that step, the prior probability of mastery, the likelihood of learning from a step, and conditional probabilities that allow for the possibility that a learner might guess the step or slip. As an alternative method, Bayesian networks are often used for the student model [26]. Furthermore, recent educational data mining areas have advanced the development of new student modeling methods (e.g., [27], [28], [29]). In adaptive problem selection, the system uses its student model to select problems that (for the given learner, at the given point in time) target unmastered knowledge
components. The system continues to do so until the student model indicates that the learner has achieved mastery of the target knowledge components [30], [31]. Conati and Vanlehn (2000) used the student model to ascertain what steps in a worked example a particular learner should be prompted to explain, which for early learners was shown to be more helpful than a system in which the steps to be explained were not selected on an individual basis [32]. Muldner and Conati (2007) also used the student model to select suitable examples for analogical comparison [33].
Although adaptive problem selection has remained pop-ular in ITS fields, it cannot adjust the degree of help for learner development. For this purpose, many ITSs have employed adaptive help technology for the learner’s prob-lem solving (e.g., [37], [38], [39], [40], [41]). This technology can provide a learner with adaptive help at each step of problem solving. The level of help can vary: from signaling about a wrong step to giving a hint that states what the learner should do at the next step. In addition, a system with this technology can monitor the learner’s actions. Then a student model can be constructed to provide adaptive help [37]. Variants of this technique are used in a number of ITS fields (e.g., [38], [39], [40], [41]). However, some ITS researchers have pointed out that the adaptive help function tends to provide over-assistance and that it might obstruct effective learning [39], [42], [43], [44], [45], [46], [47]. A trade-off exists between information giving and withholding to achieve optimal learning, which has recently been called the ”assistance dilemma’ [31]. Anderson et al. (1989) conducted a study that evaluated the effects of the tutor’s mastery learning method and of explanatory content in both the tutor’s hints and its feedback messages [42]. They compared the regular Lisp Tutor, which provides explanatory content in its hints and in some of its error feedback messages, with a version that simply told students they were wrong when they made errors, or gave them the correct answer when they requested a hint. They found that explanatory messages help students learn faster, but not better. They speculated that the students in the no explanation condition, after seeing the answers provided by the system, were able to generate their own explanations of the answers, but that it took extra time to do so. This result suggests that on-demand graded hints are more effective for learning [39], [43], [44], [45], [46], [47], [48], [49], [50], [51]. Typically, multiple levels of hints are available, with each giving progressively more specific advice. The hints explain which problem-solving principle is applicable and how. The last hint in the sequence, called the ’bottom-out hint’ often states the correct answer and its explanation [31]. However, the evidence related to actual use of on-demand graded hints shows that learners are not good at seeking assistance or information at appropriate times [31], [39].For example, Koedinger and Aleven (2007) reported from log data that students frequently used bottom-out hints to obtain answers without reading prior hints that explain why the answer is what it is [31]. They also pointed out that learners often did not request help even after they had made multiple errors related to a single step. To solve this problem, they suggested redesign of the ITS so that it achieved a better bal-ance between withholding and providing problem-solving hints, by making it provide more information proactively
after problem-solving errors. The other solution proposed helping learners to create a better balance for themselves by providing tutoring with respect to learners’ help-seeking skills [45], [47]. The aim of such metacognitive instruction is for students to learn to balance themselves and to judge when to seek information and assistance versus when to try to think independently [31]. Returning to the topic about the original concept of scaffolding, the fundamentally important function of scaffolding is adapting a learner’s ZPD to support the learner. Although earlier studies have been undertaken to ascertain the optimal balance between information giving and withholding in the learning envi-ronment, and although they have yielded some results, the optimality in the studies seems somehow obscure. There-fore, the products of such studies are not well generalized.
Pea (2004) emphasized the importance of a fading func-tion of scaffolding as described previously [53]. The scaf-folding system necessarily has a fading function if it has an adaptive assistance function that adjusts the degree of help to a learner’s development. This study addresses the fun-damentally important elements of scaffolding, ”adaptivity,” and ”fading”.
3
I
TEMR
ESPONSET
HEORYEffective scaffolding requires estimation of how much sup-port a learner must have to complete tasks and decision of the optimal degree of assistance for learner development.
The main idea of this study is to use Item Response Theory (IRT) [54], [55] to predict a learner’s performance given several hints and then to select the optimal hint for the learner. This section briefly introduces IRT, a recent test theory based on mathematical models, which is be-ing used widely in areas such as human-resource assess-ment, entrance examinations, and certification tests with the widespread use of computer testing. It has three main benefits:
1) It can assess ability while minimizing the effects of heterogeneous or aberrant items, which have low estimation accuracy.
2) The learners’ responses to different items can be assessed on the same scale.
3) It predicts the individual probability of correct re-sponse to a problem based on past rere-sponse data. This section introduces the two-parameter logistic model [54], which is an extremely popular IRT model. For the two-parameter logistic model, uj denotes the response of
a learner to itemj(1,· · · , n)as
uj= {
1 :learner answers correctly to itemj
0 :else other.
In the two-parameter logistic model, the probability of a correct answer given to itemjby learneriwith abilityθi∈
(−∞,∞)is assumed as
p(uj = 1|θi) =
1
1 + exp(−1.7aj(θi−bj)
, (1)
where aj ∈ (0,∞) is the j-th item’s discrimination
pa-rameter expressing the discriminatory power for learners’ abilities of item j, and bj ∈ (−∞,∞) is the j-th item’s
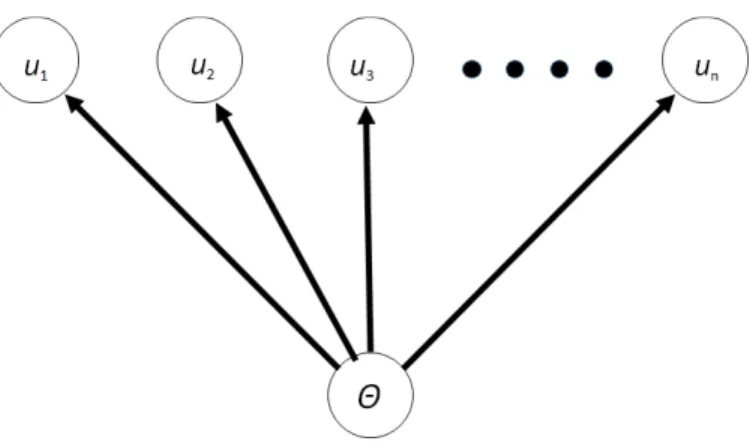
Fig. 1. Probabilistic graphical model representation of IRT.
difficulty parameter expressing the degree of difficulty of itemj. Parametersajandbj must be estimated previously
from data using some numerical estimation method [55]. Actually, IRT assumes conditional independence among items given the ability variable, which is known as ”local in-dependence.” Fig. 1 depicts a probabilistic graphical model representation of IRT. Fig. 1 shows that all items in the same domain depend on a common ability, which is represented by a latent variableθ. In other words, the random variable of the learner’s response to each item is conditionally inde-pendent when the common ability variable is given.
To specify the scaffolding mechanism, we must de-fine the learner’s individual development. However, it is difficult because ”development” does not mean only the increase of explicit knowledge that a learner has but the increase of more generalized abilities including the meta-knowledge which underlies the problem solving in the field (e.g. [57]). The first idea of this study is to represent the individual learners’ development as the increase of the latent ability variable of IRT to represent the common ability which underlies the problem solving in the target domain.
4
I
TEMR
ESPONSET
HEORY FORD
YNAMICA
S-SESSMENT
4.1 Dynamic assessment
The scaffolding process requires dynamic assessment to predict learner performance when a teacher’s help is pre-sented to them, as explained previously. Brown and her team compared the performance of children’s responses to IQ test items under two conditions [6]. The first was ”static assessment,” which involved children trying to solve problems under conventional test conditions, for which they received no help or guidance. The same children were also tested on the same items under dynamic conditions of providing a series of graded hints. The results demon-strated that dynamic assessment provided a stronger basis for predicting learning outcomes than static measures did. The most important result was that the greatest learning gain tended to be achieved by children who only needed the minimum number of hints. The magnitude of the ’gap’ between assisted and unassisted performance indicated by the amount of help needed was therefore prognostic of individual differences in learning outcomes. Assessing how much help a learner needed to succeed provided more
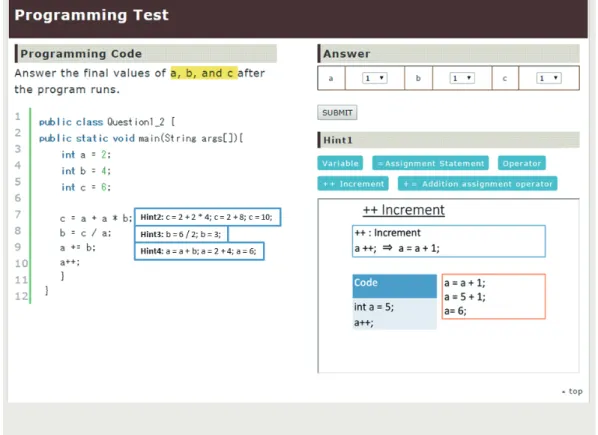
Fig. 2. Dynamic assessment system.
decisive information about readiness for learning than de-termining how often they failed when doing the same, un-tutored tasks. Consequently, dynamic assessment integrated the assessment of learners’ prior knowledge with the task of helping them to learn [52].
An important difficulty associated with previous studies is that the number of hints needed was not a reliable mea-sure of dynamic assessment because it depended strongly on the task difficulty. In addition, earlier studies were unable to predict how much support a learner needed for solving a task that had not been presented to the learner. In the next section, to resolve these problems, we propose an IRT model for dynamic assessment.
4.2 Data from dynamic assessment system
We developed the dynamic assessment system depicted in Fig. 2 to obtain learners’ response data from tasks using a series of graded hints to apply IRT to dynamic assessment data.
We consider a series of graded hints {k},(k = 1,2, . . . , K −1) for task j. For that series, k = 0 when the task is presented without a hint. First, the dynamic assessment system in a computer presents task j without a hint to learneri.
If the learner responds incorrectly, then the system presents hint k = 1. Otherwise, the system stores the learner’s response and presents the next task: j+ 1. If the learner responds incorrectly to taskj with hintk= 1, then the system presents hint k = 2. Alternatively, the system stores the learner’s response and presents the next task:
j+ 2. Consequently, the system presents hints fromk= 1to
k=K−1until the learner answers correctly. This procedure is repeated untilj=n. Taking this procedure forNlearners, one obtains dynamic assessment data
X ={xijk},(i= 1,· · ·, N, j= 1,· · · , n, k= 0,· · ·K), where xijk=
1 :learnerianswered correctly to taskjwhen hintkor the previous hint beforekwas presented
0 :else other,
andxijK denotes the response data when learneri cannot
answer correctly with hintK−1.
4.3 Item response theory for dynamic assessment
We propose application of IRT to data X obtained in dynamic assessment, where the problems with traditional dynamic assessment methods are solvable as a result of the three benefits of IRT. The probability that learneriwill respond correctly to taskj with thek-th hint,p(uj =k|θi),
is assumed by the following graded response model [56]
p(uj =k|θi) = 1 1 +exp(−ajθi+bj(k−1)) − 1 1 +exp(−ajθi+bjk) , (2) whereajstands for a discrimination parameter expressing
the discriminatory power for learners’ abilities of taskj,bjk
is a difficulty parameter expressing the degree of difficulty of taskjwhen thek-th hint is presented, andθiis an ability
parameter expressing the ability of learner i. In addition,
p(xj = 0|θi) = 1andp(xj = K|θi) = 0. Here, we simply
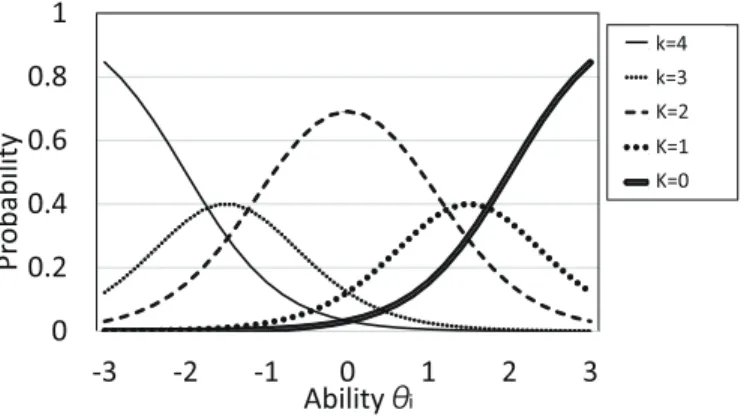
assume a unidimensional ability variable, which reflects the learner development for a domain. Fig. 3 depicts an example of item response function (2) for a task with four hints. The horizontal axis shows the learner’s abilities. The vertical axis shows the probabilityp(uj = k|θi)that learneri will
respond correctly to taskjwhenk-th hint is presented.
4.4 Dynamic assessment for programming trace prob-lems
In the report in which the term ”scaffolding” first appeared [4], Wood et al. (1976) described how teachers interacted with learners to help them solve a problem. Recently, the concept of ”scaffolding” has been extended to enhance learner development in broader situations than those of problem solving only [57]. However, in this study, we specif-ically examine ”scaffolding” for problem-solving situations according to Wood et al. (1976) [4].
We applied the proposed IRT for dynamic assessment of computer programming trace problems that have been addressed in the computer science education area (see, for example, [58]).
We used the tasks to find the final numerical values of the target variables in the programs. We used six tasks with four hints and one task with three hints. Task 1 with hints is depicted in Fig. 2. First, the system presents each task without hints to a learner. If the learner responds incorrectly, then the system presents Hint 1. Otherwise, the system stores the learner’s response and presents the next task. If the learner responds incorrectly to the task with Hint 1, then the system presents Hint 2. The system presents Hint 1, Hint 2, Hint 3, and Hint 4 sequentially until the learner responds correctly. It is noteworthy that Hint 4 includes the final answers of the task.
On the right of screen in Fig. 2, Hint 1 is presented to explain ”increment: ++” in the program. On the left of screen in Fig. 2, Hint 2, Hint 3, and Hint 4 are presented sequen-tially. The first hint presented the required prior knowledge to solve the task, with subsequent successive hints with visualized trace results from the top of the program one after another. In these tasks, the graded hints are designed to become closer to the final answers as the sequence is followed. ’ iŠ K” ½‰žƒ ‚ƒ fƒ ‹ 0 0.2 0.4 0.6 0.8 1 -3 -2 -1 0 1 2 3 ƒ Jƒ eƒ Sƒ Š0 ƒ Jƒ eƒ Sƒ Š1 ƒ Jƒ eƒ Sƒ Š2 ƒ Jƒ eƒ Sƒ Š3 ƒ Jƒ eƒ Sƒ Š4 k=4 k=3 K=2 K=1 K=0 Ability θi P ro b a b il it y
Fig. 3. Graded response model for hints.
We obtained response dataXfrom 156 examinees using the dynamic assessment system. The examinees were first-year technical college students who had begun to study programming.
4.5 Estimated Parameters
We estimated the parameters of the graded response model in Eq. (2) using data X obtained in the previous section. For this purpose, we maximized the following log-Bayesian posterior l(aj, bjk|X) = ∫ ∑N i=1 n ∑ j=1 K ∑ k=0 [(xijklogp(uj=k|θ, aj, bjk) (1−xijk) log(1−p(uj=k|θ, aj, bjk))) p(θ)p(aj)p(bjk)]dθ, (3) wherep(θ) ∼ N(0,12),p(a j) ∼logN(1.0,0.42),p(bjk) ∼ N(µjk,0.42),µj0 = −2.5,µj1 = −1.25,µj2 = 0.0,µj3 = 1.25,µj3= 2.5, andN(µ, σ)denote the normal distribution
with expected valueµand varianceσ.
We used the Newton–Raphson method to solve
∂l(aj, bjk|X) ∂aj = 0 (4) ∂l(aj, bjk|X) ∂bjk = 0 (5)
with a convergence criterion of 0.001. For integration ofθin (3), we use Gaussian quadrature integration with 20 points. Table 1 presents the correct answer rates (CARj0 = ∑N
i=1xij0
N ) for tasks without hints, and shows the estimated
parameters ofajandbjkfor each task and associated hints.
Almost all tasks were slightly difficult, as inferred from the
CARj0, because all correct answer rates were less than 0.51.
It is apparent fromaj that tasks 3–7 strongly discriminated
learners’ abilities, but tasks 1 and 2 had poor discrimination. The estimated parameters bjk for each hint were ordered
according to the order in which the hints were presented because the hints were presented cumulatively. In the table, NA signifies that no learner answered correctly when a hint was presented. Therefore, hints 1, 2, and 3 are the only options in task 7 because all the students had answered correctly when hint 3 was presented. We then compared the reliabilities of the ability estimators with the numbers of hints that were used in an earlier study [7] of dynamic
TABLE 1
Estimated parameters for each task and associated hints.
CARj0 aj bj4 bj3 bj2 bj1 bj0 Task 1 0.27 0.79 -2.59 -1.05 -0.54 0.23 0.99 Task 2 0.07 0.45 -1.62 -0.16 0.65 1.13 2.54 Task 3 0.26 2.03 -0.79 -0.25 0.33 0.77 1.06 Task 4 0.13 1.08 -1.04 -0.66 0.68 1.10 1.94 Task 5 0.37 1.02 -1.34 -0.52 -0.25 0.13 0.54 Task 6 0.37 1.15 -0.99 -0.66 -0.35 -0.20 0.52 Task 7 0.51 1.09 NA -0.76 -0.57 -0.28 -0.04
Esmaon
of ability
Predicon of the correct answer
probability with each hint
Select the adapve hint
Learner response
history
Tasks and hints
Data Base
Learner
Probability based scaffolding system
Present the Task
1. Task
2. Response
3. Adapve
hint
Automacally mark the response
E
The learner's
response
Wrong
Correct
or the final hint
was presented.
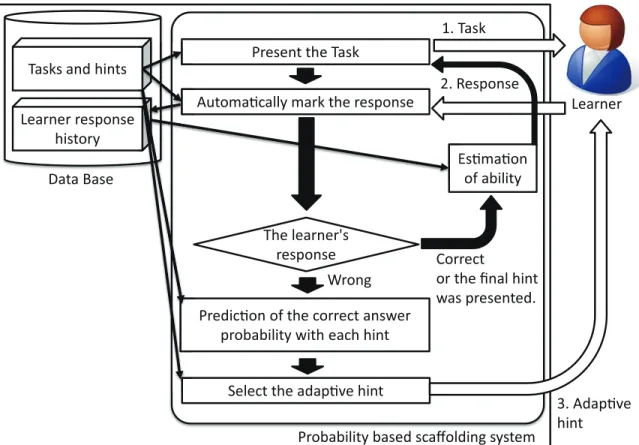
Fig. 4. Outline of the probability-based scaffolding system.
assessment. We calculated the correlation coefficients be-tween the estimated abilities using data for tasks 1–4 and those using data for tasks 4–7. The results revealed a high correlation coefficient value of 0.862. We similarly calculated correlation coefficients between the average number of hints needed for tasks 1–4 and those for tasks 4–7. We obtained a low value of 0.662. The main reason the number of necessary hints was less reliable is that the variance of the numbers of used hints tended to be small because only a few hints were needed for learners. Then the magnitude of estimation error tended to be large. In contrast, the proposed estimated ability for dynamic assessment was a more reliable measure by minimizing the effects of heterogeneous or aberrant responses that might have affected poor accuracy in the estimates. Consequently, the proposed method improves the reliability of dynamic assessment.
5
P
ROBABILITY-
BASED SCAFFOLDING SYSTEMThe main objective of this study was clarification of the mechanism for effective scaffolding. The main difficulty with scaffolding is that over-assistance or lack of help inter-rupts effective learning. The difficult task for the instructor is how to optimize the magnitude of help using dynamic assessment. In the previous section, we proposed an IRT for dynamic assessment and showed that it improved the reliability of traditional dynamic assessment. However, a more important benefit of the proposed IRT for this study is that it enables prediction of a learner’s correct answer probabilities to tasks which had not been presented to the learner before. In this section, we propose a method of
presenting adaptive hints to control the learner’s predictive correct answer probabilities in tasks using the proposed IRT. Here, we assume that some optimal correct answer proba-bility exists to increase learners’ abilities. That high level of capability is achieved by scaffolding when the difficulty of tasks is slightly beyond the learner’s abilities. The most important problem is to ascertain how great the optimal correct response probability is. In this study, we compare the learning performance by changing the probability to find the optimal probability for learning in the later section. We designate the optimal probability as the ”scaffolding probability” and express it asPS.
According to this idea, we developed a scaffolding sys-tem to solve the programming trace problem. Fig. 4 depicts an outline of the system framework. The system consists of the scaffolding system, the task and hints database, and the learner response history database. The system has the following procedures. 1. The system presents a task. 2. The learner answers to the task. 3. If the learner responds incorrectly to the presented task, then the system selects the hint that is nearest to the scaffolding probabilityPS from
the hint database, and presents it to the learner. Procedures 2 and 3 are repeated until the learner answers correctly to the task or the final hint is presented.
Algorithm 1 shows details of the proposed algorithm. First, the system presents the first task without hints. If a learner responds correctly, then the system estimates the learner’s ability using the learner response data and presents the next task. Here, the initial value of θi is zero,
incor-rectly, then the system shows the feedback that the learner’s answer was wrong and then, from the remaining hints, presents a hint by which the learner’s predicted probability of correct answer to the task using the estimatedθis closest toPS. Here, the system predicts the learner’s correct answer
probability to the taskj with hintk by assigning the esti-mated abilitybθand the estimated task and hint parameters
b
ajandbbjkfrom the database into (2) as follows:
p(uj =k|baj,bbjk,θb) = (6) 1 1 +exp(−bajθbi+bbj(k−1)) − 1 1 +exp(−bajθbi+bbjk) .
If the learner responds incorrectly again, then the system presents the wrong answer feedback and then provides the next optimal hint sequentially until the learner responds correctly or the final hint is presented. After the learner responds correctly, the task or the final hint is presented. The system presents the correct answer feedback and its explanation. Next, the system estimates the learner’s ability using the response history data. Then, the system presents the next task. This procedure is repeated until no task remains in the database. This algorithm was inspired by adaptive testing that presented optimal items for measuring learners’ abilities (For details of adaptive testing, see for example, van der Linden and Glas (2010) [59] ).
For details, in the system, the ability parameter is esti-mated as described below. We obtain learner i’s response dataXiluntil thel-th presented task is presented, as
Xil={xiqk},(q= 1,· · ·, l, k= 0,· · ·K), where xiqk=
1 :learnerianswered correctly toq-th task when hintkor the previous hint beforekwas presented
0 :else other,
andxiqK denotes the response data when learneri cannot
answer q-th task correctly with hint K −1. To estimate learneri’sbθ, we maximize the following log-posterior
l(θ|Xil, al, blk) = l ∑ q=1 K ∑ k=0 [(xiqklogp(uj=k|θ, aq, bqk) (1−xiqk) log(1−p(uj=k|θ, aq, bqk)))p(θ)]. (7)
We used the Newton–Raphson method to solve
∂l(θ|Xil, al, blk)
∂θ = 0 (8)
with a convergence criterion of 0.0001.
It is noteworthy that our study was conducted on the assumption that the estimated ability increases, even though the conventional IRT has assumed that the estimated ability is invariant. For this study, we do not consider unique fea-tures in which the estimated ability is dynamically increased in the IRT model. However, the estimated ability using the proposed method can reflect the dynamically increased ability sufficiently because the tasks are not very numerous.
Fig. 5 depicts an example of adaptive hints presented in the system according to a learner’s responses. Task 2 asks the final values of a and b after the program runs. In this example, the estimated ability is 0.0 after the learner incorrectly responded to task 2. In (a), the system selects hint 3 as the optimal hint for task 2 and presents it to the learner because the learner’s predicted correct answer probability with hint 3, 0.53, is closest to 0.5. Although the hints actually include hint 1, which presents the necessary programming grammars for this task, as the same as the right side of Fig. 2, Fig. 5 doesn’t show hint 1 because of limitations of space. The learner answers the task incorrectly again. Therefore, in (b), the system presents the next hint 4. Then the learner completes the task correctly. The system re-estimates the learner’s ability as 0.029. The system presents the next task 3. Task 3 asks the final values of a, b, c, and d after the program runs. The learner completes the task incorrectly. Then, in (c), the system presents optimal hint 3 because the learner’s predicted correct answer probability with hint 3, 0.723, is closest to 0.5. This procedure is repeated until there are no remaining tasks in the database.
Hints 3 and 4 of the example correspond to the second and third iterations of the loop in the task programs. If a loop iterates more than three times when we use the same mode of providing hints, then it is necessary to add extra hints corresponding to the extra loop iterations because our current system has only four hints at most for all the tasks.
Algorithm 1Scaffolding ()
1: Initializebθ= 0
2: Input ”scaffolding probability”PS, ”the number of hints
for taski”(K−1)i 3: fori= 1;N do 4: k= 0
5: Present taskiand goto 8
6: Select unused hint k with which the learner’s pre-dicted probability of correct answer to task i is the closest to the scaffolding probability PS. Here, the
learner’s predicted probability of correct answer to taskiis obtained byp(uj=k|baj,bbjk,θb)in (6). 7: Present taskiwith hintk
8: Input the learner’s response to taski 9: Automatically mark the response
10: if k < (K−1)i and the learner’s response is wrong
then
11: Provide the wrong answer feedback to the learner and go to 6
12: end if
13: Present the correct answer feedback and its explana-tion
14: Estimateθbfrom the learner’s response history
15: end for
6
E
MPIRICAL EXPERIMENTS TO FIND THE OPTIMALSCAFFOLDING PROBABILITY
The analyses described in this section estimate the optimal scaffolding probability from some empirical experiments. The participants in these experiments were 93 first-year
1 2 3 4 5 6 7 8 9 10 11 12 13 14 15 16 17
public classQuestion2_2{ public static void
main(String args[]){ int a = 0; //a<-0; int b = 0; //b<-0;
while(a < 3){ //0<3:true->loop 1; 1<3:true->loop2;
a++; //a=a+1;a=0+1;a=1; a=a+1;a=1+1;a=2; if(b > a){ //0>1:false->skip; a++; // b++; // } b += 3; //b=b+3;b=0+3;b=3 }
System.out.println(a); System.out.println(b); }
}
Hint2 Hint 3
No Hint Hint 1 Hint 2 Hint 3 Hint 4 Item Difficulty Parameter 2.54 1.13 0.65 -0.16 -1.62 Predicted Correct Answer Probability 0.13 0.30 0.38 0.53 0.78 Es!mated Ability 0.0
Answer the final values of a and b a"er the program runs.
(a) Task 2 Hint 3
1 2 3 4 5 6 7 8 9 10 11 12 13 14 15 16 17
public classQuestion2_2 { public static void
main(String args[]){ inta =0; //a<-0; intb =0; //b<-0;
while(a <3){ //0<3:true->loop 1; 1<3:true->loop2; a++; //a=a+1;a=0+1;a=1; a=a+1;a=1+1;a=2; if(b >a){ //0>1:false->skip; 3>2:true->continue;
a++; // a=a+1;a=2+1;a=3;
b++; // b=b+1;b=3+1;b=4;
}
b +=3; //b=b+3;b=0+3;b=3 b=b+3;b=4+3;b=7; }
System.out.println(a); System.out.println(b); }
}
Hint4
Hint2 Hint 3
No Hint Hint 1 Hint 2 Hint 3 Hint 4 Item Difficulty Parameter 2.54 1.13 0.65 -0.16 -1.62 Predicted Correct Answer Probability 0.13 0.30 0.38 0.53 0.78 Es!mated Ability 0.0
Answer the final values of a and b a"er the program runs.
(b) Task 2 Hint 4 1 2 3 4 5 6 7 8 9 10 11 12 13 14 15 16 17
public class Question5_2 {
public static voidmain(String args[]){ int a =0; //a<-0 int b =0; //b<-0 int c =3; //c<-0 int d =0; //d<-0 while(a <2){ //0<2:true->loop A 1 if(c <5){ //0<3:true->continew
while(d <2){//0<2:true->loop B 1 1<2:true->loop B 2
c++; //c=c+1;c=3+1;c=4; c=c+1;c=4+1;c=5; d++; //d=d+1;d=0+1;d=1; d=d+1;d=1+1;d=2; b++; //b=b+1;b=0+1;b=1; b=b+1;b=1+1;b=2; } b++; // b=b+1;b=2+1;b=3; } a++; // a=a+1;a=0+1;a=1; }}} Hint2 Hint3
No Hint Hint 1 Hint 2 Hint 3 Hint 4 Item Difficulty Parameter 1.06 0.77 0.33 -0.25 -0.79 Predicted Correct Answer Probability 0.027 0.071 0.261 0.723 0.944 Es!mated Ability 0.029
Answer the final values of a, b, c and d a"er the program runs.
(c) Task 3 Hint 3 Fig. 5. Example of adaptive hints.
university students of the faculty of engineering, who had begun to study programming.
6.1 Method
This section presents comparison of the learning perfor-mances by changing the scaffolding probability to obtain the optimal probability using the system in section 5 (groups A– C). Additionally, we compare the learning performances of the proposed system with those of the no hint condition (group D), the traditional dynamic assessment condition (group E), and the condition of the task presentation with the answer and its explanation (group F). Specifically, the participants were divided into the following six groups for different experiments.
A) The system in section 5 presented hints so that the learner’s predictive correct answer probability was close to 0.8.
B) The system in section 5 presented hints so that the learner’s predictive correct answer probability was close to 0.65.
C) The system in section 5 presented hints so that the learner’s predictive correct answer probability was close to 0.5.
D) The system presented no hints. (The learner’s pre-dictive correct answer probability was 0.1–0.5). If the participant answers incorrectly once, then the system presents the correct answer and its explanation. E) The system presents the graded hints sequentially in
the same way as the method explained in section 4.4. The system presents the next hint if the participant responds incorrectly to the task. This procedure was repeated until the participant responded correctly. If the participant responds incorrectly to the task when the final hint is presented, then the system presents
TABLE 2
Results from pre-tests and post-tests (Tukey–Kramer method and significant difference from group C: *5 %, **1%).
Group A B C D E F
No. of examinees 14 16 18 15 12 18
Pre-test score (The maximum score 12)
1.14 (1.59) 1.69 (2.44) 1.78 (2.44) 1.33 (1.89) 2.17 (1.40) 2.72 (2.23) Post-test score (The maximum score 45)
35.4** (2.94) 34.8** (2.13) 40.0 (3.15) 36.5* (2.22) 34.8** (2.44) 30.9** (4.92) Memory holding test (The maximum score 26)
20.8 (2.73) 20.8 (2.27) 23.0 (2.18) 20.6 (1.81) 20.8 (1.81) 18.3 (5.41)
Learning time [min] 69 (26) 78 (28) 71 (22) 67 (15) 72 (24) 64 (24)
the correct answer and its explanation. Although the systems in A)–C) skip to the hint closest to the target probability, the system in E) presents all the hints one-by-one until the learner answers correctly. F) The system presents tasks with the correct answers
and an explanation. Although the participants were not required to input their answers to the system, they read the tasks with the correct answers and their explanations sequentially.
We developed these six versions of the system. The ex-periments were conducted according to five steps presented below.
1) The participants took a pre-test using the system to assess their prior knowledge. The pre-test consisted of programming trace problems asking for the final values of variables after the program began work-ing. The examinees had to solve the problems in-dependently without hints. The number of problem items was 12; raw scores were used.
2) The system presented basic knowledge related to programming trace problems to the examinees after the pre-test had taken place. Specifically, the exam-inees studied the programming grammar: 1. vari-able, 2. condition branch, 3. while loop, 4. for loop, and 5. array, to solve programming trace problems. 3) The system started the scaffolding module
corre-sponding to each group (A–F) after previous learn-ing had taken place.
4) The examinees took a post-test after learning with the scaffolding system. The post-test consisted of new problems combined with the previously learned programming grammars: 1. variable, 2. con-dition branch, 3. while loop, 4. for loop, and 5. array. The participants had to solve problems by themselves without hints. The number of problem items was 45. The raw scores were used.
5) After a week, the participants took a memory hold-ing test that consisted of similar items to those in the post-test. The number of problem items was 26. The raw scores were used.
The period of the experiments was from October 15 through October 31 in 2014. We allocated 20 participants randomly to each group. However, only 93 participants completed the experiments.
6.2 Results
6.2.1 Optimal Scaffolding Probability
For this study, we assumed that there is an optimal probabil-ity with which the learner can solve the task given teacher’s assistance for scaffolding. To ascertain that optimal proba-bility, this section presents a comparison of the performance of pre-test and post-test examinees groups from A to F that were used to evaluate the proposed system. The test results are presented in Table 2, which lists the number of examinees who completed the experiments in each group, the average score obtained from pre-tests, the average score from post-tests, the average score from memory-holding tests, and the average learning time using the system. The values in parentheses in the table are standard errors. We infer from the results of χ2 test with a significance level of 5% that the results from the pre-test are equivalent to those of the other groups. No difference was found in the groups before the experiment. In addition, the average pre-test scores were extremely low because the examinees were beginners at programming.
We assessed differences between groups using one-way analysis of variance (ANOVA) in the results from post-tests; then we used the Tukey–Kramer method for the detected differences. Using Tukey-Kramer tests allows for correction because of having done multiple comparisons, as long as the statistical results from the ANOVA are significant.
Group C outperformed the others, as shown in Table 2, with a significance level of 5% despite the short average learning times. Conversely, Group F, which provided the answers and their explanations, exhibited the worst per-formance, although the explanation included the content for all hints. This method provided less opportunity for learners for deep consideration of problems because the average learning time was the shortest. In contrast, with no hints, group D exhibited the second-best performance. The average learning time for group D was longer than that for group F. Presenting answers only after learners’ incorrect answers might induce deep thinking from this to solve problems. Moreover, this result suggests that over-instruction is ineffective for attaining learner development.
The system presented herein hints in groups A and B so that a learner’s predictive correct answer probability was near 0.8 for the former and 0.65 for the latter. In these cases, the system tended to present more help (content of hints) than that for group C. The average scores for groups A and B were less than that of group D, although the averages of learning times for groups A and B were longer than
Fig. 6. Correct answer rates for the examinees when the first hint was presented (except for group D) .
those for the others. This result demonstrates that setting correct answer probabilities by scaffolding strongly affects the learning effectiveness. We also conducted a conventional dynamic assessment procedure for group E. The average score for group E was less than that of group C and was almost identical to those for groups A and B from the results. Actually, the effectiveness of the conventional method was almost identical to that of the other methods with slight over-assistance. The average learning time was almost equal to those of group C that skips the hint closest to PS. The
reason is that the number of hints (only four at most) was small in this experiment. However, if the number of hints for each task becomes large, group E might waste much time reading many meaningless hints and suffer from a heavy mental load. If this is true, then the differences of learning performance and time between groups C and E could become large when the number of hints becomes large.
Group C provided the best average score in the results for the memory holding test. In contrast, the average score for group F was the worst. The average scores for the other groups were almost identical. These results indicate that the scaffolding method with a correct answer probability of 0.5 was superior.
6.2.2 Evaluation of basic functions
In previous sections, we concluded that the scaffolding to adjust learners’ success probability to 0.5 was the most effective for learning. As described in this section, we tested and confirmed that the system presented adaptive hints so that the learners’ predicted correct answer probabilities in (6) to the tasks were close to PS. Fig. 6 depicts the
correct answer rates for groups A, B, C, and E, over all examinees for tasks when the first hints were presented. It is noteworthy that the first hints for groups A, B, C, and E were presented after the learners answered incorrectly to the tasks without hints. The correct answer rates, CARj1,
were calculated using dataXi(l=n)in section 5 as follows:
CARj1=
∑Nj1 i=1xij1
Nj1
, (9)
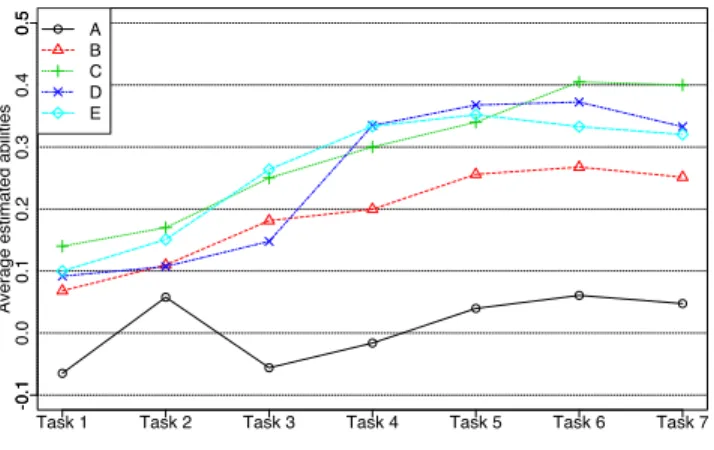
Fig. 7. Transition in estimated abilities.
Fig. 8. Average numbers of presented hints.
where Nj1 denotes the number of learners who answered
task j with hint 1. For group D, Fig. 6 shows the correct answer rates for tasks without hints. From Fig. 6, the sys-tems for groups A, B, and C controlled learners’ correct answer probabilities at around PS by presenting adaptive
hints to various levels of learners. This evidence of control demonstrates that the function of adaptive hints functioned precisely because the correct answer rates without hints (group D) were between 0.1 and 0.4. In addition, the correct answer rates for group D increased greatly (more than 0.1). This might result from the learning effects from the exercises. However, those for groups A, B, and C increased less than those for group D. This phenomenon for groups A, B, and C also reflects the effectiveness of the adaptive hints function to enhance individual learners’ abilities.
From task 1 to task 4, the correct answer rates for group E are slightly higher than those for group D because the results for group E indicate the correct answer rates with only the hints 1. However, after task 5, the differences between the groups become somewhat unstable because the learners’ abilities increased as a result of the learning from
the exercises. Next, we tested and confirmed that the system increased the learners’ abilities.
Fig. 7 depicts the average estimated abilities, calculated as described in section 5, for tasks when learning with the system. The results for groups D and E, which did not employ the IRT model, were estimated using the learners’ responses of data to the tasks and the IRT parameters in Table 1.
In this study, we did not add unique features in which the estimated ability is increased dynamically in the IRT model. However, results show that the estimated ability us-ing the proposed method reflects the dynamically increased ability. It is noteworthy that the true ability might increase more than the estimated ability increases in Fig. 7 because the increase of the ability estimates in (8) is restricted by learner’s response data for the learner’s past learned tasks. It is expected that this restriction works to suppress an over-fitting and then provides more accurate ability estimation. This result demonstrates the effectiveness of the proposed system for learner development.
As the results of Table 2 suggest, the order of the degree of ability increase is C, D, E, B, and A. The average ability in group C, which shows the best performance, increases monotonically from 0.1 in the figure when learners proceed with learning until task 6; it converges to around 0.4. The abilities for groups A and B might be estimated as less than the learners’ true abilities because groups A and B automati-cally present greater numbers of hints than the other groups do, although a learner’s estimated ability increases as the number of hints after which the learner correctly responded increases. Particularly, the estimated abilities for group A are significantly lower than those for the other groups, which causes over-assistance. In this case, it’s almost as though the learners are wasting their time in the system because the system presents more hints than necessary.
Furthermore, the ability estimates of all the groups tend to decrease in task 7. The following possible reasons exist. One is that the hints difficulty parameter estimates of task 7 are smaller than those of tasks 2- 6, from Table 6. The examinees’ abilities are estimated as smaller because they answer incorrectly to tasks and hints with smaller difficulty parameter estimates. The other is that the prior distribution
p(θ) = N(0,12)worked to avoid extreme deviation from
b
θ = 0.0. Therefore, the prior might have caused a ceiling effect.
Fig. 8 depicts the transition in the average number of hints presented to learners for groups A, B, C, and E. The number of hints that the learner received from the scaffolding system depends on the scaffolding probability
PS, the hint difficulty parameter estimates, and the learner’s
current ability estimate. The number of presented hints in group C does not decrease monotonically because the characteristics of hints differ for tasks. However, the aver-age number of presented hints decreases dynamically after learning task 4. The system gradually decreases the amount of help according to the increased learner’s ability. This is the fading function that is expected to enhance learners’ autonomous learning and their self-reliance in solving tasks. This fading function caused the phenomenon by which the correct answer rates for groups A, B, and C did not change greatly as the number of provided hints decreases; then it
is expected to increase the learners’ abilities when PS is
appropriate for learning.
Groups A and B tend to receive greater numbers of hints than group C because they adjusted their correct answer probability to a higher value than that of group C. However, the average number of hints for group E tends to remain at around two for all the tasks except for task 2. Therefore, the traditional dynamic assessment method did not work any fading functions because it is difficult for the learners to control the optimum number of hints by themselves. As a result, the degree of fading in group C was greater than those of the other groups because the average numbers of hints for tasks 6–8 were less than one. This result might be an important factor by which group C outperformed in Table 2.
Moreover, this lack of the fading function might be the reason that the ability estimates of groups D and E did not increase monotonically in Fig. 7. As described previously, Pea pointed out that many software features in the current scaffolding systems did not have a fading function [53]. The scaffolding system necessarily has a fading function if it has the adaptive function to learners.
Consequently, the results demonstrate that the proposed approach realizes a fading function, which the previous scaffolding systems did not have. It might be an important factor for effective learning.
6.2.3 Question analyses
We also posed three questions to the examinees:
1) Did you think that you achieved the correct answers to the tasks by yourself?
2) Did you have confidence in solving similar tasks by yourself?
3) How did you evaluate the problem solving task difficulty?
The examinees answered them by responding on a five-point Likert scale for questions 1) and 2): 1. Strongly dis-agree, 2. Weakly disdis-agree, 3. I am not sure, 4. Weakly agree, and 5. Strongly agree. For question 3), the following alternatives were used: 1. very easy, 2. easy, 3. appropriate, 4. difficult, 5. very difficult.
Table 3 presents the average scores of groups A–F for respective questions. The values in parentheses in the table represent standard errors. From Table 3, group C shows the highest score for question 1). However, it is noteworthy that the examinees did not think that they reached the correct answers by themselves because the score ”3” means ”I am not sure”. Furthermore, the scores of the other groups are much lower than that of group C. This result suggests that both over-assistance and lack of assistance might decrease the learners’ sense of accomplishment.
For question 2), group C shows the highest score, which is higher than 4.0. However, the scores of the other groups are less than 4.0. Therefore, no method except for the pro-posed method increases learners’ confidence for significant autonomous learning.
Group F with full instruction shows the worst score for both questions 1) and 2). Therefore, over-instruction tends to convince learners of learning well only slightly and hinders learner independence.
TABLE 3
Average scores and the standard deviation from five point Likert scale questions (Tukey–Kramer method and significant difference: *5%).
Group A B C D E F
Question 1: Did you think that you achieved the correct answers to the tasks by yourself?
2.57 (0.979) 2.16 (0.601) 3.00 (0.882) 2.06 (0.680) 2.31 (0.583) 2.00 (0.577) Question 2: Did you have confidence in
solving similar tasks by yourself?
3.79 (0.340) 3.81 (0.674) 4.05 (0.726) 3.87 (0.705) 3.75 (1.01) 3.67 (1.00) Question 3: How did you evaluate the
problem solving task difficulty? (0.75)2.85 (1.03)2.96 (0.83)3.28 (0.96)3.79 (0.93)3.23 (0.84)2.50
Group D presents poor results for question 1), but it shows better results for question 2). The reason for question 1) results is that the tasks with no hints tend to be difficult for learners because their correct response rates are less than 0.4. However, the post-test result from Table 2 is good. Learners tried to solve the tasks autonomously. This chal-lenge might have enhanced their learning and confidence, although they were unable to reach the correct answer.
Consequently, the results from questions 1) and 2) show that effective learning is served better by lack of assistance than by over-assistance.
The results for question 3) showed that group F evalu-ated the task as easy because the average score was 2.50. Group D produced the highest score, which means it is the most difficult task because the correct answer rate of group D was the worst. For the other groups, the order of the score was close to 3.0, which means that ’appropriate’ is B, A, E, and C. This result demonstrates that the learners tended to prefer the tasks with the predicted correct answer probabil-ity of 0.65, which is slightly more than 0.5. However, from Table 2, group C provided the best learning performance. This result suggests that the learning performance might be superior when learners feel that solving a task is somewhat difficult.
7
C
ONCLUSIONSThis article proposed a scaffolding framework that pro-vided adaptive hints using a probabilistic model, i.e., item response theory (IRT). We first proposed IRT for dynamic assessment in which learners were tested under dynamic conditions of providing a series of graded hints. Further-more, we estimated the parameters of the IRT for dynamic assessment from actual data. Results show that the proposed method improves the reliability of traditional dynamic as-sessment.
We then explained a scaffolding system we had devel-oped that presented adaptive hints using the estimated abil-ity using IRT from learner’s response data. It was assumed for this study that rational scaffolding is based on a prob-abilistic decision rule: an optimal probability to facilitate learner development exists for a learner solving a task after a teacher’s assistance. To ascertain the optimal probability, we used the scaffolding system to compare the learning performance by changing the predictive probability. Re-sults show that scaffolding such that the learners’ success probability is 0.5 provides the best learning performance. Results also suggest that over-instruction, which presents full answers of tasks without opportunities for learners
to solve the problems by themselves, presents the worst learning performance.
Furthermore, we obtained the following results: 1) The scaffolding system enhanced learner development to in-crease the learner ability. 2) The system achieved scaffolding with fading. 3) Neither over-instruction nor lack of instruc-tion was effective for learner development.
We have six plans for future work: A) For this study, the experiment period was about two weeks only. We intend to conduct an experiment over a longer period to confirm the actual effectiveness of the system. B) We intend to expand IRT to a method with multidimensional abilities or to a Bayesian network because the unidimensional ability model has a limitation that it is difficult to correctly esti-mate the model parameters when the task variables are not conditionally independent given the unidimensional ability variable [60], [61]. C) We did not consider unique features in which the estimated ability was increased dynamically in the system design. Discarding response data from earlier presented tasks might improve the accuracy of estimating a learner’s current ability. D) We applied ”scaffolding” to problem-solving tasks. Recently however, the concept of ”scaffolding” has been extended to enhance learner devel-opment in a broader situation than that of problem solving alone [57]. We intend to extend the proposed framework to a broader concept of the scaffolding situation. For example, several IRT models, which incorporate the reviewers’ pa-rameters into the model, have been proposed recently for peer assessment [62], [63]. These IRT models can extend the possibility of applying the proposed approach to open-ended tasks or some activities in learning communities with peer reviewers’ assessment. E) According to Vigotskian scaffolding theory, learner development is promoted by an expert’s appropriate help to a task that the learner cannot solve alone. The learner’s correct answer probabilities for the presented tasks without a hint is expected to be less than 0.5 if the most effective help is giving hints to increase the learner’s correct answer probability is 0.5, as shown in this study. However, the learner’s correct answer probability for a task without a hint varies by the learner’s ability. To select a task so that the learner’s correct answer probability of tasks is close to the target probability, the problem selection of ”adaptive testing” [59] using IRT has been known. We intend to add the adaptive problem selection function to the scaffolding system so that the learner’s correct answer probabilities for the presented tasks without a hint are less than 0.5. F) As shown in section 2, adaptive scaffolding methods of various kinds have been proposed. We intend to compare the proposed method with these existing methods.