1
Novel Bio-inspired Memetic Salp Swarm Algorithm and Application to
MPPT for PV Systems considering Partial Shading Condition
Bo Yang 1, Linen Zhong 1, Xiaoshun Zhang 2,*, Hongchun Shu 1, Tao Yu 3, Haofei Li 3, Lin Jiang 4,
Liming Sun 5
1 Faculty of Electric Power Engineering, Kunming University of Science and Technology, 650500 Kunming,
China;
2 College of Engineering, Shantou University, 515063 Shantou, China;
3 College of Electric Power, South China University of Technology, 510640 Guangzhou, China;
4 Department of Electrical Engineering & Electronics, University of Liverpool, Liverpool, L69 3GJ, United
Kingdom;
5 Guangzhou Shuimuqinghua Technology Co. LTD., 510898 Guangzhou, China; * Correspondence: Xiaoshun Zhang, e-mail: [email protected]
Abstract: This paper proposes a novel bio-inspired optimization method named memetic salp swarm algorithm (MSSA). It is developed by extending the original salp swarm algorithm (SSA) with multiple independent salp chains, thus it can implement a wider exploration and a deeper exploitation under the memetic computing framework. In order to enhance the convergence stability, a virtual population based regroup operation is used for the global coordination between different salp chains. Due to partial shading condition (PSC) and fast time-varying weather conditions, photovoltaic (PV) systems may not be able to generate the global maximum power. Hence, MSSA is applied for an effective and efficient maximum power point tracking (MPPT) of PV systems under PSC. To evaluate the MPPT performance of the proposed algorithm, four case studies are undertaken using Matlab/Simulink, e.g., start-up test, step change of solar irradiation, ramp change of solar irradiation and temperature, and field atmospheric data of Hong Kong. The obtained PV system responses are compared to that of eight existing MPPT algorithms, such as incremental conductance (INC), genetic algorithm (GA), particle swarm optimization (PSO), artificial bees colony (ABC), cuckoo search algorithm (CSA), grey wolf optimizer (GWO), SSA, and teaching-learning-based optimization (TLBO), respectively. Simulation results demonstrate that the output energy generated by MSSA in Spring in HongKong is 118.57%, 100.73%, 100.96%, 100.87%, 101.35%, 100.36%, 100.81%, and 100.22% to that of INC, GA, PSO, ABC, CSA, GWO, SSA, and TLBO, respectively. Lastly, a hardware-in-the-loop (HIL) experiment using dSpace platform is undertaken to further validate the implementation feasibility of MSSA.
Keywords: Solar energy harvesting; MPPT; partial shading condition; memetic salp swarm algorithm; virtual population
Nomenclature
Variables Abbreviations
Vpv PV output voltage, V MPPT maximum power point tracking
Ipv PV output current, A PV Photovoltaic
Ig cell’s photocurrent, A PSC partial shading condition ID diode’s photocurrent, A INC incremental conductance IS cell’s reverse saturation current, A MSSA memetic salp swarm algorithm
IRS d-q components of the grid current, A SSA salp swarm algorithm
Tc cell’s absolute working temperature, °C GA genetic algorithm
Tref cell’s reference temperature, °C PSO particle swarm optimization S total solar irradiation, W/m2 ABC artificial bees colony
Eg bang-gap energy of the semiconductor used in the cell, J CSA Cuckoo search algorithm
Np number of panels connected in parallel GWO grey wolf optimizer
Ns number of panels connected in series TLBO teaching-learning-based optimization
PV system parameters GMPP global maximum power point
q electron charge, 1.60217733×10⁻¹⁹ Cb LMPP local maximum power point
A p-n junction ideality factor, between 1 and 5 MSSA parameters
k Boltzman’s constant, 1.380658×10⁻²³ J/K c1, c2, c3 random numbers
ki cell’s short-circuit current temperature coefficient n population size of each salp chain
Rs, RSH cell’s series and shunt resistance, Ω M number of salp chains
1. Introduction
In the past decade, the ever-increasing energy consumption and inevitable reduction of fossil fuel resources (coals, oil, natural gases) [1]-[4], as well as the fast deterioration of environment resulted from global warming, have led to a global approach to research on renewable energy sources, e.g., hydro, wind, solar, biomass, geothermal, which have different features and own merits [5]-[9]. Among the above alternatives, solar energy, in particular photovoltaic (PV) panels, has recently increased as a result of these devices being environmentally friendly, high safety, clean, noise-free, and little maintenance [10]-[12]. In work [13], an extreme learning machine (ELM) was developed for short-term output power forecasting of PV systems. Since PV modules usually have significant losses in the power generation potential due to heating of the cells by solar irradiation, an automatic water cooling system was developed to increase its efficiency in converting the solar irradiation into electricity and thermal energies [14]. Moreover, a phase change material (PCM) based cooling technique was proposed to reduce the PV panel operating temperature [15]. In literature [16], the performance and land footprint of a solar PV tree under different structure and topology was thoroughly analyzed. Meanwhile, reference [17] analyzed a hybrid solar tunnel dryer with PV system and solar collector for drying mint under different solar irradiation level.
Generally speaking, a paramount task of PV system operation is to harvest the maximum available solar energy under different weather conditions, which is called maximum power point tracking (MPPT). The quality of an MPPT technique is usually evaluated by its complexity, cost, tracking speed, accuracy and number of sensors required for execution [18]. So far, almost all MPPT algorithms can perform well when the PV array is under uniform solar irradiance condition. Nevertheless, their performance may be degraded when the PV array is affected by partial shading condition (PSC), under which multiple local maximum power point (LMPP) emerge on PV curve while only one of them is the global maximum power point (GMPP) [19]. PSC usually occurs by several unavoidable scenarios, including shadow of buildings, trees, clouds, birds or the dust particles on the solar panels. Under such case, a satisfactory MPPT algorithm should be efficient and effective enough to detect the GMPP among many LMPPs [20].
Thus far, an enormous variety of MPPT algorithms have been developed for PV systems. Conventional methods such as incremental conductance (INC) [21], hill-climbing [22], and perturb & observe (P&O) [23] are the most commonly used ones. They have the advantages of high reliability and structure simplicity, which can realize an efficient tracking under uniform solar irradiation case. However, an inherent drawback of them is that they may be easily stagnated at an LMPP in the presence of multiple MPPs, which often results in a low energy conversion efficiency [24].
Basically, the aforementioned approaches are inadequate to handle the PSC thus more advanced approaches are needed. Reference [25] presented a fuzzy-logic based MPPT controller, which used an adaptive hysteresis current control algorithm to tackle PSC with constant switching frequency and limited harmonic content. In work [26], an artificial neural network (ANN) based modified INC was developed, which can effectively track GMPP under PSC. Besides, literature [27] designed an adaptive neuro-fuzzy inference system (ANFIS) based intelligent MPPT algorithm for PV systems, which adopts a hybrid learning algorithm that combines the least squares estimator and the gradient method, such that the GMPP can be efficiently obtained. Moreover, a novel power-increment based global MPPT (GMPPT) algorithm was proposed by combining the voltage line, load line, and power line altogether to determine the tracking direction and the step size [28]. In addition, a novel beta parameter three-input one-output fuzzy-logic based MPPT strategy to tackle PSC was proposed, which can simplify the fuzzy rule membership functions, cover wider operating conditions, and reduce the dependence on the user's knowledge about the system [29].
On the other hand, meta-heuristic algorithms have become surprisingly popular due to their prominent feature of flexibility, gradient-free mechanism, and local optima avoidance. As a consequence, meta-heuristic techniques have been applied to resolve this thorny obstacle [30]. In reference [31], genetic algorithm (GA) was employed to rapidly seek GMPP while particle swarm optimization (PSO) based MPPT algorithm was proposed to improve the accuracy of MPPT [32]. Furthermore, in literature [33], artificial bee colony (ABC) algorithm was reported to achieve MPPT under varying weather conditions and PSC, which requires few user-defined parameters with its convergence being independent of the initial conditions. Additionally, cuckoo search algorithm (CSA) via Levy flight was applied on PV system to guarantee an efficient GMPPT under PSC [34]. Besides, animal behaviour based whale optimization algorithm (WOA) [35] and grey wolf optimizer (GWO) [36] were developed to achieve an efficient and oscillation-free GMPPT under PSC, together with few parameters and low computational burden. Meanwhile, motivated by the human behaviour, teaching-learning-based optimization (TLBO) was employed to accurately track the GMPP under PSC, which has a very simple structure and fast convergence rate [37]. In addition, bat algorithm (BA) was utilized to provide satisfactory dynamic performance and fast convergence by automatically switching between exploration and exploitation stages during the MPPT process [38]. Moreover, moth-flame optimization (MFO) was devised to
rapidly find GMPP in the presence of PSC [39]. In reference [40], generalized pattern search (GPS) was utilized for PSC, which owns the merits of simple implementation, derivative free nature, fast convergence, high accuracy.
Recently, a novel bio-inspired algorithm called salp swarm algorithm (SSA) has been developed [41], which has a simple search mechanism and a high optimization efficiency. It has been used to seek GMPP with a fast tracking speed and insignificant power oscillations [42]. Other applications can be referred to optimal subset searching of feature selection [43], parameter optimization of polymer exchange membrane fuel cell [44], Carbon dioxide emissions forecasting [45], as well as parameter estimation of soil water retention curve [46].
In fact, an optimization method not only need to rapidly search a high-quality optimum near GMPP, but also improve the convergence stability for reducing the power fluctuation of PV system. However, like the traditional meta-heuristic algorithms, SSA is also difficult to satisfy both of these two requirements since it only adopts a single swarm of individuals (i.e., a chain of salps) with a simple search mechanism. Therefore, this paper proposes a novel memetic salp swarm algorithm (MSSA) for MPPT of PV systems under PSC, which has the following two main improvements:
Compared with the original SSA, MSSA employs multiple independent slap chains to simultaneously
implement the exploration and exploitation, which can rapidly search a high-quality optimum. Hence, the PV system can generate more power based on a high-quality control strategy near GMPP.
A virtual population based regroup operation is designed for the global coordination between different salp
chains, which can effectively improve the convergence stability. Thus, it will result in a small power fluctuation under PSC.
The remaining of this paper is organized as follows: Section 2 presents the PV systems modelling and PSC; In Section 3, MSSA is developed while its design on PV systems for MPPT under PSC is given in Section 4; Then, Section 5 and Section 6 show the case studies results and dSpace based HIL experiment results, respectively. Lastly, Section 7 concludes the whole paper.
2. PV Systems Modelling under PSC
2.1. PV cell modelling
A PV cell is consisted of a light generated current source, a parallel diode, and a series resistance, respectively. Normally, PV cells are grouped together to form PV modules, which are combined in both series and parallel to provide a desired output power [30]. Denote the number of PV cells in series and in parallel to be 𝑁 and 𝑁 , respectively, the relationship between the output current and voltage can be described by [47]
𝐼 𝑁 𝐼 𝑁 𝐼 exp 1 𝑅 𝐼 /𝑅 (1) where the meaning of each symbol is given in Nomenclature.
The generated photocurrent 𝐼 is determined by the solar irradiation, as follows
𝐼 𝐼 𝑘 𝑇 𝑇 (2) Besides, the PV cell’s saturation current 𝐼 varies with the temperature according to the following relationship:
𝐼 𝐼 exp (3) The above equations (1)-(3) indicate that the current generated by the PV array is simultaneously relied on the solar irradiation and temperature.
An even more exact mathematical description of a PV cell, called the double exponential model [48], is derived from the physical behaviour of PV cell constructed from polycrystalline silicon. This model contains a light-generated current source, two diodes, a series resistance and a parallel resistance. However, there are some limitations to develop expressions for the V-I curve parameters resulted from the implicit and nonlinear nature of the model. Therefore, this model is rarely used in the generalized PV model.
Consider the ideal PV cell model, which has no series loss and no leakage to ground, i.e., cell’s series resistance
𝑅 =0 and cell’s shunt resistance RSH=∞. The above equivalent circuit of PV solar cell can be simplified as follows
[47]:
𝐼 𝑁 𝐼 𝑁 𝐼 exp 1 (4) Based on Eq. (4), the output current becomes an explicit equation and can be obtained directly with all the parameters and voltage known.
Note that this paper assumes that the PV cell’s working temperature can be accurately measured for the MPPT design and all PV system components work normally, which is a very common assumption that can be referred to numerous MPPT algorithms development [21]-[40]. Besides, automatic watering cooling system [14] is employed to prevent PV panels from over-heating issues, while other cooling systems can also be used for protection.
2.2 MPPT under PSC effect
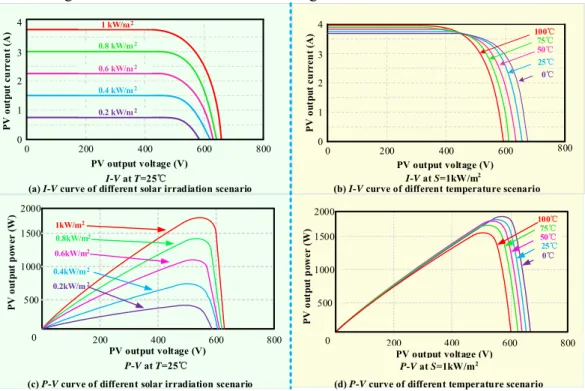
The PV systems should always operate at the maximum output point due to their inherent feature of low efficiency characteristics [49]. Here, Figure 1 illustrates the relationship of current-voltage (I-V) and power-voltage (P-V) obtained under different solar irradiation and temperature. It is obvious that a higher temperature will result in a lower MPP while a higher solar irradiation will lead to a higher MPP.
2000 1500 1000 500 P V o ut put p ow er ( W ) 0 200 400 600 800 PV output voltage (V) P-V at S=1kW/m2 100℃ 75℃ 50℃ 25℃ 0℃ 1kW/m2 0.8kW/m 0.6kW/m 0.4kW/m 0.2kW/m 2 2 2 2 2000 1500 1000 500 P V o ut put p ow er ( W ) 0 200 400 600 800 PV output voltage (V) P-V at T=25℃ 4 3 2 1 0 0 200 400 600 800 1 kW/m 0.8 kW/m 0.6 kW/m PV output voltage (V) P V o ut pu t cu rr en t (A ) I-V at T=25℃ 2 2 2 0.4 kW/m2 0.2 kW/m2 4 3 2 1 0 0 200 400 600 800 100℃ 75℃ 50℃ 25℃ 0℃ PV output voltage (V) I-V at S=1kW/m P V o ut pu t cu rr en t (A ) 2
(c) P-V curve of different solar irradiation scenario (d) P-V curve of different temperature scenario (a) I-V curve of different solar irradiation scenario (b) I-V curve of different temperature scenario
Figure 1. Current-voltage and power-voltage characteristics of PV array obtained under different solar irradiation and temperature.
Figure 2 demonstrates a PV array in a typical series-parallel configuration. Here, the PV modules are connected in strings, with four modules per string. When one of the modules in the string exposes less illumination resulted from shading, e.g., dirt, trees, birds, its voltage will drop and behave as a load rather than a generator. Then, a hot spot will be emerged while generally a bypass diode is connected in parallel with each PV module to protect the shaded module from further potential damages. Meanwhile, a blocking diode is also connected at the end of each string to provide the protection against reverse current caused by the voltage mismatch between the parallel-connected strings [50].
The diodes can save the shaded PV cells from the above issue, but they inevitably change the PV characteristics and produce a two-peak curve. Such phenomenon becomes quite complicated when several strings are connected in parallel for a higher current supply. Normally, various PV curves are generated by each string depending on the number of shaded PV cells [51]. These multi-peak PV curves are then combined due to the parallel connection, which then forms a multi-peak curve shown in Fig. 2. As a consequence, the PV systems should always operate at GMPP, such that the maximum available solar energy could be extracted from the solar energy. Otherwise, considerable amount of power might be lost when operating at an LMPP [52].
+
- - + - +
+
- - + - +
PV Cell #1 PV Cell #2 PV Cell #3 PV Cell #1 PV Cell #2 PV Cell #3
PV module with two shadowed PV cells PV module without shadowed PV cells
+ - + -Vd Vd VPV Vstring Istring + -Vs VPV + -Vs Vstri ng Istring + -- + + + -+ -PV Cell #4 VPV + -PV Cell #4 + -Vs Blocking Diode Blocking Diode 0 10 20 30 40 50 0 20 40 60 80 100 Voltage ( V) Po w er (W ) Voltage ( V) 0 10 20 30 40 50 0 20 40 60 80 100 Voltage ( V) Po w er (W )
Figure 2. The schematic illustration of PSC effect.
3 Memetic Salp Swarm Algorithm
3.1 Inspiration
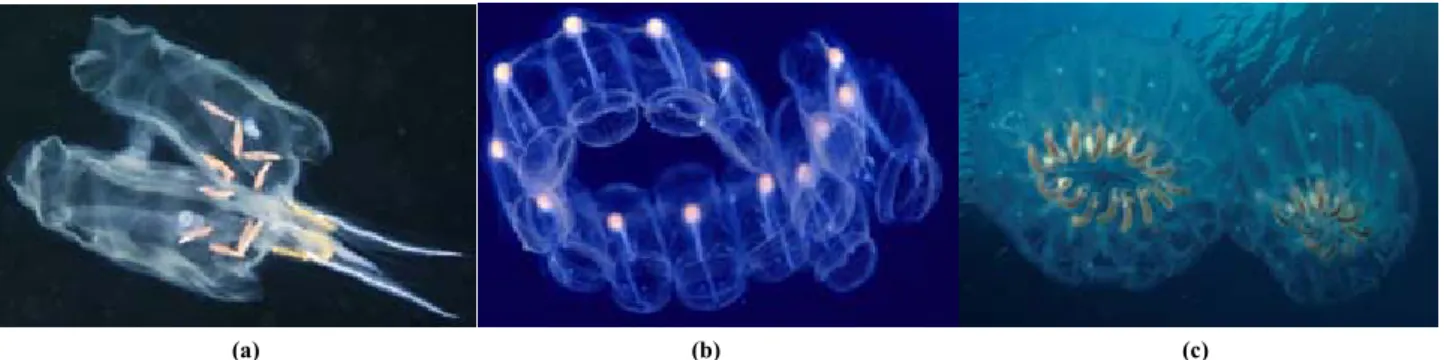
Salps belong to the family of Salpidae which own a transparent barrel-shaped body. They move by contracting, thus pumping water through its gelatinous body, while strain the pumped water through their internal feeding filters, feeding on phytoplankton. the water is pumped through body as propulsion to move forward [53]. The shape of a single salp is shown in Fig. 3(a). One of their most interesting behaviour is the swarming behaviour. In deep oceans, salps often form a swarm called a salp chain, as shown by Fig. 3(b) and Fig. 3(c), these aggregated individuals are also known as blastozooids. They remain attached together while swimming and feeding, and each individual grows in size.The main reason of this peculiar behaviour is not very clear yet, but some researchers believe that this attempts to achieve better locomotion using rapid coordinated changes and foraging [54].
(a) (b) (c)
Figure 3. Shape and structure of salp swarm in deepocean. (a) single salp, (b) single salp chain, and (c) double salp chains.
3.2 Optimization framework
Memetic algorithm was firstly proposed by Moscato [55], which has developed into a broad class of algorithms and can properly hybrid a population-based global search and the heuristic local search [56]. Since it can significantly improve the ability of global exploration and local exploitation, it has been successfully applied to an enormous variety of real-world optimization problems. In this paper, MSSA also adopts the memetic computing framework to enhance the searching ability of SSA, which mainly contains two operations (See Fig. 4), as follows:
Local search in each chain: MSSA consists of multiple parallel salp chains, where a salp chain represents a swarm of salps. Each salp chain will independently implement a local search according to the searching mechanism of SSA in each iteration.
Global coordination in virtual population: the population of MSSA is only regarded as hosts of memes where a meme is a unit of cultural evolution [57]. Particularly, meme will be positively selected for increased communicability among the hosts (e.g., the salps in MSSA). Moreover, the physical characteristics of each individual will not be changed during the global coordination. Hence, all the salps are taken as a virtual population. Besides, the virtual population will be regrouped into multiple new salp chains, such that a global coordination between different salp chains can be achieved.
Salp
Slap chain #1 Slap chain #m Slap chain #M
Leader Follower
Local search Local search Local search
Global coordination Figure 4. Optimization framework of MSSA.
3.3 Local search in each chain
The local search of MSSA is the same as the exploitation and exploration of SSA. In each chain, the salps can be divided into two roles, including the leader and the follower. As shown in Fig. 4, the leader is the salp at the front of the salp chain, and the rest salps are regarded as the followers. In the searching process, the leader is responsible for guiding the swarm to seek the food source, while the followers follow each other. For the mth salp chain, the position of the leader can be updated as follows [31]:
𝑥 𝐹 𝑐 𝑐 𝑢𝑏 𝑙𝑏 𝑙𝑏 , if 𝑐 0
𝐹 𝑐 𝑐 𝑢𝑏 𝑙𝑏 𝑙𝑏 , if 𝑐 0 (5)
where the superscript j represents the jth dimension of the searching space; 𝑥 is the position of the leader (first salp) in the mth salp chain; 𝐹 denotes the position of the food source, i.e., the current best solution obtained by the mth salp chain; 𝑢𝑏 and 𝑙𝑏 are the upper and lower bounds of the jth dimension, respectively; 𝑐 , 𝑐 , and 𝑐 are the random numbers, in which the last two parameters are the uniform random numbers from 0 to 1, respectively.
Note that 𝑐 is the most important parameter in (5) since it can directly influence the trade-off between exploration and exploitation. In order to achieve a proper balance, it is designed according to the iteration number, as follows [41]:
𝑐 2𝑒 (6) where k is the current iteration number and kmax is the maximum iteration number, respectively.
On the other hand, the position of the followers can be updated as follows [41]:
𝑥 𝑥 𝑥 , , 𝑖 2,3, … , 𝑛; 𝑚 1,2, … , 𝑀 (7) where 𝑥 is the position of the ith salp in the mth salp chain; n is the population size of each salp chain; and M is the number of salp chains, respectively.
3.4 Global coordination in virtual population
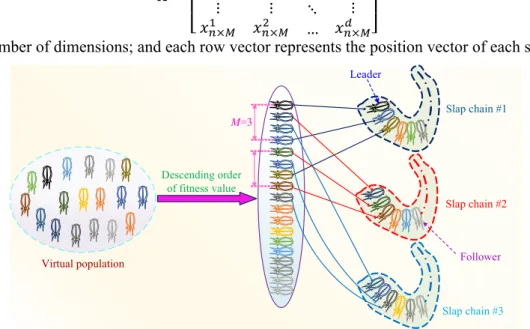
In order to improve the convergence stability, the virtual population will be regrouped into different salp chains according to all the salps’ fitness values. In this paper, the population partition rule of shuffled frog leaping algorithm (SFLA) [58] is employed for regroup operation in MSSA since SFLA is a classical memetic algorithm. Hence, the regroup operation can be achieved according to the descending order of fitness value for a maximum optimization. As illustrated in Fig. 5, the best solution will be assigned to the salp chain #1, then the second best solution will be assigned to the salp chain #2, and so on. Therefore, the updated swarm of the mth salp chain can be described as follows [58]:
𝒀 𝒙 , 𝑓 |𝒙 𝑿 𝑚 𝑀 𝑖 1 , : ,𝑓 𝑭 𝑚 𝑀 𝑖 1 , 𝑖 1,2, ⋯ , 𝑛 , 𝑚 1,2, ⋯ , 𝑀 (8)
where 𝒙 is the position vector of the ith salp in the mth chain; 𝑓 is the fitness value of the ith salp in the mth chain; F is the fitness value set of all the salps following the descending order; and X is the corresponding position
𝑿 ⎣ ⎢ ⎢ ⎡ 𝑥 𝑥 ⋯ 𝑥 𝑥 𝑥 ⋯ 𝑥 ⋮ 𝑥 𝑥 ⋮ …⋱ ⋮ 𝑥 ⎦⎥ ⎥ ⎤
where d is the number of dimensions; and each row vector represents the position vector of each salp.
Descending order of fitness value M=3 Leader Slap chain #1 Slap chain #2 Slap chain #3 Follower Virtual population
Figure 5. Regroup operation of virtual population for global coordination.
3.5 General procedure of MSSA
To summarize, the general procedure of MSSA is given in Table 1. For a specific optimization problem, the most critical link is the design of fitness function according to the corresponding objective function and constraints.
Table 1. The general procedure of MSSA 1. Initialize the optimization parameters;
2. Determine the fitness function according to the specific optimization problem; 3. Set k :=1;
4. WHILE (the termination condition is not met) 5. FOR1m :=1 to M
6. FOR2i :=1 to n
7. Calculate the fitness value of the ith salp in the mth salp chain; 8. END FOR2
9. END FOR1
10. Implement the regroup operation based global coordination in virtual population by (8); 11. FOR3m :=1 to M
12. Determine the food source of the mth salp chain;
13. Update the position of the leader in the mth salp chain by (5) and (6); 14. FOR4i :=2 to n
15. Update the position of the ith salp (i.e., the follower) in the mth salp chain by (7); 16. END FOR4
17. END FOR3
18. Set k :=k+1;
19. END WHILE
4 MSSA based MPPT Design for PV systems
4.1 Optimization model for MPPT under PSC
As clearly illustrated in Fig. 1, the output power of PV system was mainly determined by its output voltage 𝑉
under the given weather condition. Hence, the output voltage 𝑉 can be regarded as the optimization variable. If an output voltage is determined, then the duty cycle will be obtained and enter the insulated gate bipolar transistor (IGBT) for the voltage regulation of the next iteration until algorithm convergence, as shown by Fig. 6. Consider the lower and upper bounds limit of output voltage 𝑉 , the optimization model for MPPT under PSC can be described as follows:
max 𝑓 𝑉 𝑃 𝑉 𝑉 ∗ 𝐼 𝑉 (9)
s. t. 𝑉 𝑉 𝑉 (10) where 𝑃 is the output active power of PV systems; 𝑉 and 𝑉 are the lower and upper bounds of the output voltage, respectively.
4.2 Initial population of each salp chain
within the lower and upper bounds. For the mth salp chain, the initial position of the ith salp can be obtained as
𝑥 𝑉 𝑟 𝑉 𝑉 (11) where 𝑥 is the initial position of the ith salp in the mth chain and r is a uniform random number from 0 to 1, respectively.
4.3 Overall execution procedure
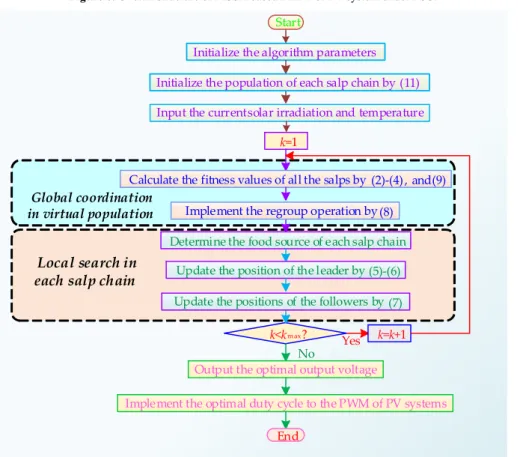
To this end, the overall execution procedure of MSSA based MPPT of PV systems under PSC is depicted in Fig. 7.
PV#1 PV#2 PV#3
MSSA based MPPT Eqs.(5)-(11)
PV system under PSC Eqs.(2)-(4)
PWM Duty cycle IGBT C1 R VPV IPV L C2 S1 T1 S2 T2 S3 T3 (D) Diode PV#4 S4 T4 M=3
Figure 6. Overall structure of MSSA based MPPT of PV system under PSC.
Initialize the algorithm parameters
k=1
Calculate the fitness values of all the salps by , and (9)
Determine the food source of each salp chain Update the position of the leader by (5)‐(6) k<km ax ? No k=k+1 Yes
Output the optimal output voltage
Implement the optimal duty cycle to the PWM of PV systems
End
Update the positions of the followers by (7) Global coordination
in virtual population
Local search in
each salp chain
Start
Initialize the population of each salp chain by (11) Input the current solar irradiation and temperature
Implement the regroup operation by
(2)‐(4) (8)
Figure 7. Overall execution procedure of MSSA based MPPT of PV systems under PSC. 5 Case Studies
In order to evaluate the MPPT performance of MSSA under PSC, this section carries out four cases, e.g., start-up test; step change in solar irradiation; ramp change in both solar irradiation and temperature; and field atmospheric data of Hong Kong. The MPPT performance is compared to that of INC [21], GA [31], PSO [32], ABC [33], CSA [34], GWO [36], SSA [42], and TLBO [37], respectively. Since the last seven heuristic algorithms can be implemented for optimization with just the fitness values of all the individuals, their optimization procedure for MPPT of PV systems under PSC can be listed in Table 2. Note that the population size and the maximum iteration number are the most two important parameters for these heuristic algorithms. To achieve a fair comparison for MPPT, they are set to be 30 and 10, respectively. Moreover, the specific parameters (e.g., the crossover probability of GA) of each algorithm and the detailed exploration and exploitation can be referred in [31]-[34], [36], [37], and [42].In
addition, Table 3 provides the PV system parameters while the MSSA parameters are tabulated in Table 4. Here, the optimization cycle of each meta-heuristic algorithm is set to be 0.01 s. The simulation is executed on Matlab/Simulink 2016a via a personal computer with an IntelR CoreTMi7 CPU at 2.2 GHz and 16 GB of RAM. Moreover, the solver
is ode 45 (Dormand-Prince) with an auto variable-step size. Lastly, the rated solar irradiation and temperature are set to be 1000 W/m2 and 25℃, respectively. Under such standard conditions, the PV array’s output power P=51.716 W,
DC link voltage Vdc=18.47 V, and PV system output current Ipv=2.8 A, respectively.
Table 2. The optimization procedure of the comparative heuristic algorithms for MPPT of PV systems under PSC 1. Initialize the parameters and the population;
2. Input the current solar irradiation and temperature; 3. Set k :=1;
4. WHILE (the termination condition is not met) 5. FOR1i :=1 to n
6. Calculate the fitness value of the ith individual by (2)-(4), and (9); 7. END FOR1
8. Determine the roles for all the individuals according to their fitness values; 9. FOR2i :=1 to n
10. Update the solution of the ith individual according to its specific exploration and exploitation; 11. END FOR2
12. Set k :=k+1;
13. END WHILE
14. Output the optimal output voltage;
15. Implement the optimal duty cycle to the PWM of PV systems.
Table 3. The PV array parameters
Typical peak power 51.716W Nominal operation cell temperature (Tref) 25℃
Voltage at peak power 18.47V p-n junction ideality factor (A) 1.5
Current at peak power 2.8A Switching frequency (f) 100 kHz
Short-circuit current (Isc) 1.5A Inductor (L) 500 mH
Open-circuit voltage (Voc) 23.36V Resistive load (R) 200 Ω
Temperature coefficient of Isc (k1) 3mA/℃ Capacitor(C1,C2) 1 μF
Table 4. The MSSA parameters
Parameter Range Value
n n>1 10
M M>1 3
kmax kmax>1 10
5.1 Performance comparison on benchmark function
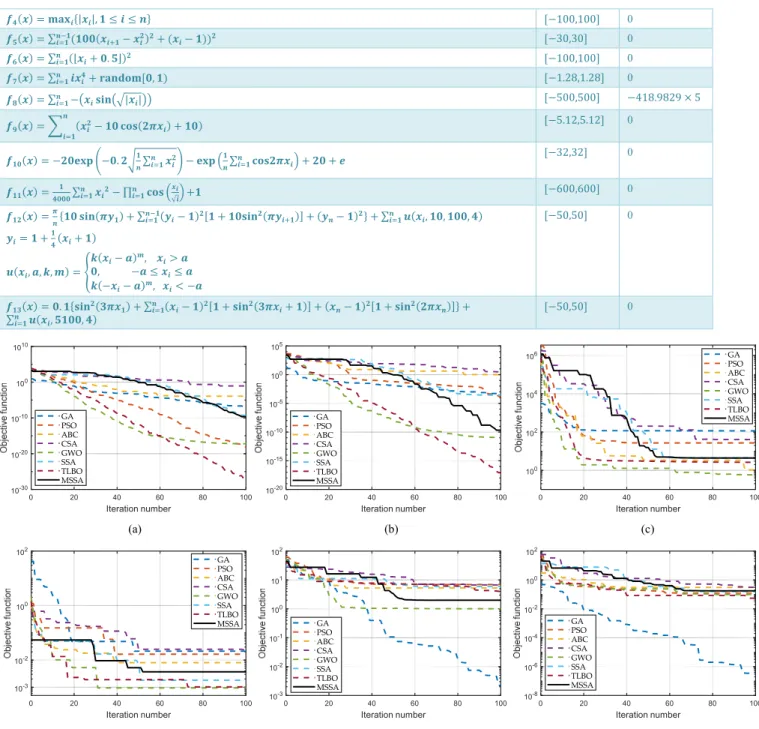
Based on the No Free Lunch theorem, “for any algorithm, any elevated performance over one class of problems is exactly paid for in performance over another class” [7]. In order to compare the performance of MSSA with other methods, thirteen general benchmark functions are used to evaluate their searching ability and convergence stability. The detailed parameters of each benchmark function [42] including the objective function, searching range, and the global minimum, are provided in Table 5, where the number of dimensions is set to be 5. For a fair performance comparison, the population size and the maximum iteration number of each algorithm are set to be 30 and 100, respectively.
Figure 8 gives the convergence curves obtained by different algorithms for six selected benchmark functions. It can be found that the searching ability of MSSA is at a medium level among all the algorithms, which is better than that of SSA for all the six benchmark functions except F7.
To further test the optimization performance, Table 6 shows the optimization results obtained by different algorithms on thirteen benchmark functions in independent 30 runs, where Avg., Std., and Rel. Std. represent the average value, the standard deviation, and the relative standard deviation of the obtained objective values, respectively. It is obvious that the searching ability of TLBO is quite strong since it obtains the minimum average values for five of thirteen benchmark functions. Moreover, the relative standard deviations obtained by MSSA are the smallest for six benchmark functions among all the algorithms, which verifies its high convergence stability. Besides, the performance of MSSA is superior than that of SSA on the whole, in which the average values obtained by MSSA are smaller than that of SSA for ten benchmark functions; and the relative standard deviations of MSSA are smaller than that of SSA for nine benchmark functions. This also demonstrates that the memetic computing framework can effectively enhance the optimization performance of MSSA.
Table 5.Detailed parameters of thirteen benchmark functions
Benchmark functions Range 𝒇𝐦𝐢𝐧
𝒇𝟏𝒙 ∑𝒏𝒊 𝟏𝒙𝒊𝟐 100,100 0 𝒇𝟐𝒙 ∑ |𝒙𝒏𝒊 𝟏 𝒊| ∏ |𝒙𝒏𝒊 𝟏 𝒊| 10,10 0 𝒇𝟑𝒙 ∑ ∑𝒏𝒋 𝟏𝒙𝒋 𝟐 𝒏 𝒊 𝟏 100,100 0
𝒇𝟒𝒙 𝐦𝐚𝐱𝒊|𝒙𝒊|, 𝟏 𝒊 𝒏 100,100 0 𝒇𝟓𝒙 ∑𝒏 𝟏𝒊 𝟏 𝟏𝟎𝟎 𝒙𝒊 𝟏 𝒙𝒊𝟐 𝟐 𝒙𝒊 𝟏 𝟐 30,30 0 𝒇𝟔𝒙 ∑𝒏𝒊 𝟏⌊𝒙𝒊 𝟎. 𝟓⌋𝟐 100,100 0 𝒇𝟕𝒙 ∑𝒏𝒊 𝟏𝒊𝒙𝒊𝟒 𝐫𝐚𝐧𝐝𝐨𝐦 𝟎, 𝟏 1.28,1.28 0 𝒇𝟖𝒙 ∑𝒏𝒊 𝟏 𝒙𝒊𝐬𝐢𝐧 |𝒙𝒊| 500,500 418.9829 5 𝒇𝟗𝒙 𝒙𝒊𝟐 𝟏𝟎 𝐜𝐨𝐬 𝟐𝝅𝒙𝒊 𝟏𝟎 𝒏 𝒊 𝟏 5.12,5.12 0 𝒇𝟏𝟎𝒙 𝟐𝟎𝐞𝐱𝐩 𝟎. 𝟐 𝟏𝒏∑𝒏𝒊 𝟏𝒙𝒊𝟐 𝐞𝐱𝐩 𝟏 𝒏∑ 𝐜𝐨𝐬𝟐𝝅𝒙𝒊 𝒏 𝒊 𝟏 𝟐𝟎 𝒆 32,32 0 𝒇𝟏𝟏𝒙 𝟒𝟎𝟎𝟎𝟏 ∑𝒊 𝟏𝒏 𝒙𝒊𝟐 ∏𝒏𝒊 𝟏𝐜𝐨𝐬 𝒙√𝒊𝒊 𝟏 600,600 0 𝒇𝟏𝟐𝒙 𝝅𝒏 𝟏𝟎 𝐬𝐢𝐧 𝝅𝒚𝟏 ∑𝒊 𝟏𝒏 𝟏𝒚𝒊 𝟏𝟐𝟏 𝟏𝟎𝐬𝐢𝐧𝟐 𝝅𝒚𝒊 𝟏 𝒚𝒏 𝟏𝟐 ∑𝒏𝒊 𝟏𝒖 𝒙𝒊, 𝟏𝟎, 𝟏𝟎𝟎, 𝟒 𝒚𝒊 𝟏 𝟏𝟒 𝒙𝒊 𝟏 𝒖 𝒙𝒊, 𝒂, 𝒌, 𝒎 𝒌 𝒙𝒊 𝒂𝒎, 𝒙𝒊 𝒂 𝟎, 𝒂 𝒙𝒊 𝒂 𝒌 𝒙𝒊 𝒂𝒎, 𝒙𝒊 𝒂 50,50 0 𝒇𝟏𝟑𝒙 𝟎. 𝟏 𝐬𝐢𝐧𝟐 𝟑𝝅𝒙𝟏 ∑𝒏𝒊 𝟏𝒙𝒊 𝟏𝟐𝟏 𝐬𝐢𝐧𝟐 𝟑𝝅𝒙𝒊 𝟏 𝒙𝒏 𝟏𝟐𝟏 𝐬𝐢𝐧𝟐 𝟐𝝅𝒙𝒏 ∑𝒏𝒊 𝟏𝒖 𝒙𝒊, 𝟓𝟏𝟎𝟎, 𝟒 50,50 0 (a) (b) (c) (d) (e) (f)
Figure 8. Convergence process of eight heuristic algorithms for different benchmark functions. (a) F1, (b) F3, (c) F5, (d) F7, (e) F9, and (f) F11.
Table 6. Optimization results obtained by different algorithms on thirteen benchmark functions in 30 runs Benchmark
functions
GA PSO ABC CSA
Avg. Std. Rel. Std. Avg. Std. Rel. Std. Avg. Std. Rel. Std. Avg. Std. Rel. Std.
F1 8.18E-06 2.37E-05 2.894510 7.05E-17 2.17E-16 3.076278 0.001026 0.000831 0.809360 0.676076 0.583592 0.863205 F2 0.000986 1.89E-03 1.918923 1.75E-05 9.61E-05 5.476500 0.001540 0.000669 0.434809 0.239397 0.095607 0.399366 F3 0.001117 2.17E-03 1.945347 0.005148 2.66E-02 5.169024 2.461006 1.39461 0.566684 2.348525 1.375695 0.585770 F4 0.522057 4.67E-01 0.895075 0.000260 8.59E-04 3.306047 0.487028 0.201858 0.414469 1.352451 0.432394 0.319711 F5 1.288426 1.270365 0.985982 67.62754 1.54E+02 2.277518 7.887337 7.179312 0.910233 24.47044 18.78930 0.767837 F6 6.17E-06 2.41E-05 3.905399 1.26E-15 4.90E-15 3.891292 0.001297 0.001194 0.920732 0.638875 0.396175 0.620114 F7 0.062813 5.54E-02 0.88240 0.600607 2.90E-01 0.483578 0.007584 0.004229 0.557599 0.012333 0.007399 0.599977 F8 -423.615 3.66E+01 0.086322 -1762.230 2.24E+02 0.127143 -1763.166 101.2177 0.057407 -1822.908 90.82229 0.049823 F9 2.354818 3.15E+00 1.338355 2.717969 2.23E+00 0.818804 5.929524 1.818617 0.306705 5.269312 1.555260 0.295154 F10 0.414081 8.64E-01 2.086277 0.054875 3.01E-01 5.477121 0.056673 0.030864 0.544591 3.306318 0.874763 0.264573 F11 0.009609 1.30E-02 1.354181 0.133188 9.46E-02 0.710125 0.229010 0.062851 0.27444 0.318169 0.089609 0.281639 F12 0.124409 3.01E-01 2.420900 0.041570 1.58E-01 3.795581 0.000653 0.000640 0.980033 0.254544 0.194272 0.763213 F13 0.009423 1.30E-02 1.382745 8.99E-11 2.88E-10 3.210151 0.003188 0.003165 0.992919 0.098218 0.057731 0.587789 Benchmark
functions Avg. GWO Std. Rel. Std. Avg. SSA Std. Rel. Std. Avg. TLBO Std. Rel. Std. Avg. MSSA Std. Rel. Std. F1 4.00E-16 1.91E-15 4.767578 8.76E-10 1.93E-09 2.207652 2.91E-26 6.88E-26 2.366495 4.20E-10 1.16E-10 0.275474 F2 8.18E-11 1.16E-10 1.418512 0.006605 0.032579 4.932612 3.73E-14 3.04E-14 0.815538 3.79E-06 6.26E-07 0.164891 F3 6.91E-08 3.01E-07 4.363473 0.004672 0.017936 3.839141 5.72E-15 1.49E-14 2.595332 2.10E-08 1.11E-07 5.274449 F4 1.36E-06 2.04E-06 1.504797 0.000361 0.001787 4.956301 7.52E-12 8.17E-12 1.086612 1.53E-05 2.75E-06 0.179846 0 20 40 60 80 100 Iteration number 10-30 10-20 10-10 100 1010 GA PSO ABC CSA GWO SSA TLBO MSSA 0 20 40 60 80 100 Iteration number 10-20 10-15 10-10 10-5 100 105 GA PSO ABC CSA GWO SSA TLBO MSSA 0 20 40 60 80 100 Iteration number 100 102 104 106 GA PSO ABC CSA GWO SSA TLBO MSSA 0 20 40 60 80 100 Iteration number 10-3 10-2 100 102 GA PSO ABC CSA GWO SSA TLBO MSSA 0 20 40 60 80 100 Iteration number 10-3 10-2 10-1 100 101 102 GA PSO ABC CSA GWO SSA TLBO MSSA 0 20 40 60 80 100 Iteration number 10-8 10-6 10-4 10-2 100 102 GA PSO ABC CSA GWO SSA TLBO MSSA
F5 7.632694 25.72992 3.371014 76.84774 142.5731 1.855267 2.224801 7.58E-01 0.340525 1.51E+01 4.31E+01 2.849658 F6 1.29E-05 6.91E-06 0.535388 4.25E-10 2.26E-10 0.532745 5.31E-06 1.57E-05 2.947736 4.39E-10 1.30E-10 0.296368 F7 0.00179 0.001575 0.879766 0.013004 0.009854 0.757799 0.003561 3.10E-03 0.871273 3.01E-02 1.19E-02 0.394789 F8 -1587.80 240.5568 0.151504 -1497.35 199.8961 0.133500 -1770.201 1.48E+02 0.083456 -1488.441 2.07E+02 0.139189 F9 2.398688 2.211432 0.921934 6.235069 4.494869 0.720901 3.033688 1.86E+00 0.613469 2.26E+00 1.61E+00 0.713573 F10 3.19E-09 5.19E-09 1.628735 0.538585 0.851039 1.580139 2.26E-13 5.71E-13 2.528661 1.15E-05 1.97E-06 0.170725 F11 0.061206 0.035545 0.580755 0.289072 0.176440 0.610365 0.113036 6.89E-02 0.609260 1.55E-01 9.06E-02 0.583148 F12 0.005427 0.014049 2.588823 0.757754 1.008047 1.330310 4.52E-04 2.43E-03 5.374002 5.94E-09 1.18E-08 1.984495 F13 2.53E-05 1.76E-05 0.695163 0.004004 0.006357 1.587819 6.22E-03 1.84E-02 2.951622 1.13E-07 4.88E-07 4.313678
5.2 Start-up test
This test attempts to investigate the MPPT performance at start-up (from zero point) under PSC, in which the solar irradiation of four PV arrays are set to be 1000 W/m2, 800 W/m2, 600 W/m2, and 400 W/m2, respectively. Figure
9 illustrates the MPPT performance of different methods. It is clearly that the INC based MPPT generates a much smaller energy than that of other methods, which cannot distinguish the difference between GMPP and LMPP. In contrast, other meta-heuristic algorithms can make the PV system generate more energy thanks to their enhanced global searching ability. Moreover, the energy output obtained by MSSA is the highest among all the methods, which demonstrates its superior searching ability via an efficient local search and a global coordination. Note that the energy can be obtained directly from the power curve, thus only the power curve is provided in the next subsection for a concise illustration.
(a) (b)
(c) (d)
Figure 10. Step change of solar irradiation with PSC.
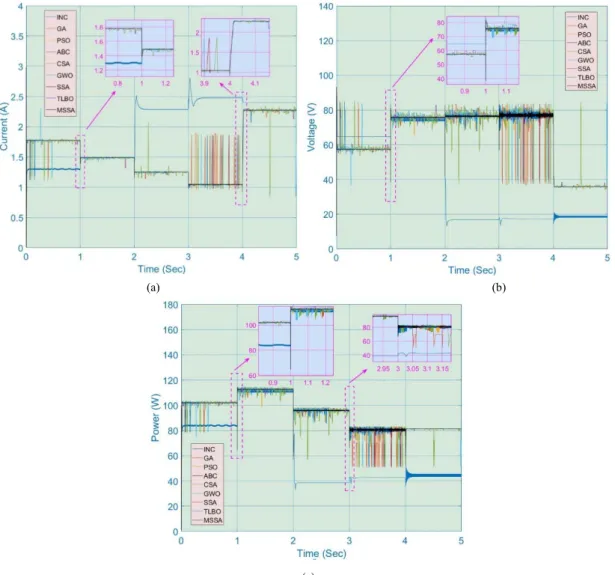
5.3 Step change in solar irradiation
To mimic the effect when a cloud rapidly passes over a PV array, a set of solar irradiation steps are applied on the PV array. As shown in Fig. 10, the step change occurs at every second interval. Throughout the test, the temperature keeps at 25℃.
Figure 11 provides the online optimization results of different methods for MPPT under step change irradiations. Similarly, all the meta-heuristic algorithms outperform INC as they could generate much higher energy under the same weather conditions. Similarly, the MSSA based MPPT can make the PV system generate the highest energy, which can increase 46.97% of output energy compared with that of INC. Moreover, as the solar irradiation suddenly changes, all of the output current, voltage, and power obtained by the meta-heuristic algorithms excluding MSSA present some oscillations. It reveals that the memetic computing framework with multiple parallel salp chains can significantly improve the ability of global and local exploration, which can lead to a high-quality optimum with a higher probability.
(a) (b)
(c)
Figure 11. PV system responses of seven methods obtained on the step change in solar irradiation with constant temperature. (a) Current, (b) Voltage, and Power.
5.3 Ramp change in both solar irradiation and temperature
Irradiation
(W
/m
In a typical sunny day, both the solar irradiation and temperature increase when approaching the midday and thereafter decrease towards the evening. To study the MSSA based MPPT performance under such scenario, a ramp change in both solar irradiation and temperature is emulated over a period of 5 s, as depicted in Fig. 12.
Figure 13 demonstrates the obtained performance of all algorithms under ramp change in both solar irradiation and temperature. It shows that the meta-heuristic algorithms except MSSA still easily produce severer power fluctuations even in the presence of the relatively slow ramp gradual change of weather condition. By implementing the regroup operation based global coordination, MSSA owning high convergence stability can effectively reduce the power fluctuations of PV system. Besides, MSSA can obtain the highest energy of the PV system among all the algorithms, which is in excess of 5.70% of that obtained by INC. This also verifies that MSSA can efficiently and effectively obtain a high quality optimum for real-time MPPT through an independent local search and a global coordination in virtual population.
(a) (b)
Figure 12. Gradual change in both solar irradiation and temperature. (a) Irradiation and (b) Temperature.
(a) (b)
(c)
Figure 13. PV system responses of seven methods obtained on thegradual change in both solar irradiation and temperature. (a) Current, (b) Voltage, and Power.
5.4 Field atmospheric data in Hong Kong
Ir radiat ion ( W /m 2) Te m p ( ° C)
To further study the MSSA based MPPT performance, it is tested by the field atmospheric data in Hong Kong (See Figure 14) from four typical days of four seasons in 2012, where the data interval is 10 min. Hong Kong is located at the subtropical region on the eastern side of the Pearl River estuary in south China. In Hong Kong, springs are rapidly changeable; Summers are hot and humid with occasional showers and thunderstorms; Autumns are generally sunny and dry; Winters are mild and usually start sunny then become cloudier towards February [59]. The detailed geographical position of the measurement device is illustrated in Fig. 15, which locates at 22.3 degrees north latitude and 114.2 degrees east longitude.
Figure 16 provides the power production of different algorithms for MPPT under four seasons in HongKong. It is obvious that all the meta-heuristic algorithms can generate much more energy than that of INC, in which the output energy obtained by MSSA is up to 118.57%, 108.08%, 112.16%, and 119.73% of that of INC in the spring, summer, autumn, and winter, respectively. From the whole simulation period, although the difference of each meta-heuristic algorithm is relatively tiny, MSSA still achieves the most satisfactory performance over that of other algorithms with the highest output energy in all seasons.
(a) (b)
Figure 14. Daily field atmospheric data in Hong Kong. (a) Solar irradiation and (b) Temperature.
Measurement device
Figure 15. The geographical position of the measurement device for solar irradiation and temperature in HongKong.
(a) (b) Ir radiat ion (W /m 2) Te m p ( ° C) 0 4 8 12 16 20 24 Time (Hour) 0 10 20 30 40 50 60 70 80 INC GA PSO ABC CSA GWO SSA TLBO MSSA 30 35 40 45 50 25 30 35 40 0 4 8 12 16 20 24 Time (Hour) 0 10 20 30 40 50 60 70 80 INC GA PSO ABC CSA GWO SSA TLBO MSSA 60 65 70 8 25 30 35 40 45
(c) (d)
Figure 16. Power productionof seven methods obtained on the typical day of HongKong. (a) Spring, (b) Summer, (c) Autumn, and (d) Winter.
5.5 Statistical studies
In order to quantitatively evaluate the power fluctuations of PV system, two indices [60,61] are introduced as follows: ∆𝑣 ∑ | | (11) ∆𝑣 max , ,…, | | (12) where ∆𝑣 and ∆𝑣 denote the average variability and the maximum variability of power output of PV system, respectively; t is the time period; Toper is the total operation period; and 𝑃 is the average power output of PV
system over the total operation period, respectively.
Table 7 gives the statistical results obtained by nine methods under four cases. One can readily find that MSSA owns the highest output energy and the smallest power variations (in bold) in all cases among all algorithms. In particular, the average variability of MSSA under step change in solar irradiation is only 33.56%, 80.17%, 84.35%, 88.99%, 71.85%, 82.91%, 66.04%, 84.35% to that of INC, GA, PSO, ABC, CSA, GWO, SSA, and TLBO, respectively. Besides, the output energy generated by MSSA in spring is 118.57%, 100.73%, 100.96%, 100.87%, 101.35%, 100.36%, 100.81%, and 100.22% to that of INC, GA, PSO, ABC, CSA, GWO, SSA, and TLBO, respectively. To sum up, MSSA can achieve the most satisfactory MPPT performance with the smallest power fluctuation.
Table 7Statistical results obtained by nine algorithms under four cases
Test Index INC GA PSO ABC CSA GWO SSA TLBO MSSA
Start-up Energy(10-6 kWꞏh) 6.9219 8.2740 8.4132 8.4007 8.4060 8.3887 8.3701 8.3320 8.4171 ∆𝒗𝐦𝐚𝐱(%) 0.6173 1.9572 0.0742 0.1047 0.0573 1.9154 1.6401 1.3484 0.0261 ∆𝒗𝐚𝐯𝐠(%) 0.0403 0.0148 0.0066 0.0074 0.0080 0.0086 0.0094 0.0123 0.0064 Step change in solar irradiation Energy(10-6 kWꞏh) 89.1534 130.5378 131.1098 131.033 130.719 130.843 130.8526 130.9785 131.0256 ∆𝒗𝐦𝐚𝐱(%) 56.5161 38.5988 38.4304 38.4529 38.5453 38.5087 38.5059 38.4689 38.4551 ∆𝒗𝐚𝐯𝐠(%) 0.0289 0.0121 0.0115 0.0109 0.0135 0.0117 0.0101 0.0115 0.0097 Ramp change in both solar irradiation and temperature Energy(10-6 kWꞏh) 153.7881 162.0980 162.5478 161.7704 162.5377 162.355 162.5070 162.3459 162.5495 ∆𝒗𝐦𝐚𝐱(%) 32.7632 31.0837 30.9976 31.1466 30.9996 31.0345 31.0054 31.0362 30.9973 ∆𝒗𝐚𝐯𝐠(%) 0.0267 0.0102 0.0089 0.0118 0.0085 0.0098 0.0084 0.0092 0.0082
Field atmospheric data in Hong Kong Spring Energy (kWꞏh) 0.3037 0.3575 0.3567 0.3570 0.3553 0.3588 0.3572 0.3593 0.3601 ∆𝒗𝐦𝐚𝐱(%) 245.09 124.20 142.43 139.17 159.57 138.28 139.80 139.23 137.58 ∆𝒗𝐚𝐯𝐠(%) 14.0297 14.0203 13.7675 13.9927 15.0213 13.9135 14.3554 14.0876 13.9923 Summer Energy (kWꞏh) 0.4538 0.4880 0.4854 0.4883 0.4902 0.4893 0.4886 0.4902 0.4905 ∆𝒗𝐦𝐚𝐱(%) 161.84 87.93 80.91 87.18 79.68 88.87 88.52 87.19 88.30 ∆𝒗𝐚𝐯𝐠(%) 9.9617 9.9847 11.0842 10.5370 10.2591 10.3998 10.1415 10.0304 9.6981 Autumn Energy (kWꞏh) 0.3843 0.4277 0.4310 0.4265 0.4305 0.4295 0.4295 0.4303 0.4325 ∆𝒗𝐦𝐚𝐱(%) 209.19 82.43 78.22 86.91 78.46 80.41 89.04 79.28 75.37 ∆𝒗𝐚𝐯𝐠(%) 13.6754 11.3672 10.6816 11.3706 10.5944 10.5189 10.8421 10.5390 10.47 Winter Energy (kWꞏh) 0.2708 0.3214 0.3238 0.3203 0.3221 0.3227 0.3221 0.3232 0.3262 ∆𝒗𝐦𝐚𝐱(%) 87.69 86.04 80.85 89.53 87.55 86.80 80.69 82.75 19.23 ∆𝒗𝐚𝐯𝐠(%) 9.46 9.08 8.73 8.98 8.82 8.54 8.58 8.42 8.40 0 4 8 12 16 20 24 Time (Hour) 0 10 20 30 40 50 60 70 80 INC GA PSO ABC CSA GWO SSA TLBO MSSA 12 64 66 68 70 72 74 25 30 35 40 0 4 8 12 16 20 24 Time (Hour) 0 10 20 30 40 50 60 70 INC GA PSO ABC CSA GWO SSA TLBO MSSA 12 52 54 56 58 60 62 16 20 25 30 35
DS1006 Board Solar irradiation S DS1104 Board Measured Signals D/A D/A A/D A/D Control Inputs
Hardware coupling between two platforms
Temperature T
Output voltage Vpv
D/A
A/D PV System (1)-(4), solar irradiation and temperature simulator
MSSA based MPPT algorithm Eq. (5)-(11)
Figure 17. The configuration of HIL experiment. 6. HIL Experiment
HIL experiment offers a crucial and reliable tool to evaluate and validate the complex/complicated real-time systems through embedding the complexity of the controlled system into the test platform [62], which has been adopted to justify the implementation feasibility of various MPPT strategies of PV systems [50,51].
A dSpace based HIL experiment is undertaken, which configuration and experiment platform are depicted in Fig. 17 and Fig. 18, respectively. In particular, MSSA based MPPT algorithm (5)-(11) is embedded on DS1104 board with a sampling frequency fc=10 kHz. Meanwhile, the PV system (1)-(4), as well as the solar irradiation and
temperature simulator are implemented on DS1006 board with a sampling frequency fs=100 kHz to emulate the PSC
and different atmospheric scenarios. Note that the solar irradiation and temperature are measured from the real-time simulation of the PV system on DS1006 board, which are then transmitted online to MSSA based MPPT algorithm on DS1104 board for the real-time calculation of output voltage Vpv. Lastly, the guaranteed measurement error of
DS1104 controller board is provided in Table 8.
Table 8. The error specification of DS 1104 controller [63]
Component Parameters
A/D converter D/A converter
Offset error ±5 mV ±1 mV Gain error Multiplexed channels: ±0.25% ±0.1% Parallel channels: ±0.5% Offset drift 40 μV/K 130 μV/K Gain drift 25 ppm/K 25 ppm/K
Signal-to-noise ratio Multiplexed channels: >80 dB >80 dB
Computer for
DS1104
DS1104
Computer for
DS1006
MSSA based MPPT
(Computer+DS1104)PV system
(Computer+DS1006)DS1006
(Temperature and
solar irradiation
simulator)
Figure 18. The hardware platform of HIL experiment.
6.1 HIL experiment results of start-up test
The simulation results and HIL experiment results obtained by start-up test are compared in Fig. 19, one can find that their curves are quite similar.
(a) (b)
(c)
Figure 19. The simulation results and HIL test results obtained under the start-up test. (a) Current, (b) Voltage, (c) Power, and (d) Energy.
6.2 HIL experiment results of step change in solar irradiation
The simulation results and HIL experiment results obtained by step change in solar irradiation is illustrated in Fig. 20. It is clear that their responses are very close.
Current (A) V oltag e (V) Power (W)
(a) (b)
(c)
Figure 20. The simulation results and HIL test results obtained under the step change in solar irradiation with constant temperature. (a) Current, (b) Voltage, and (c) Power.
(a) (b)
(c)
Figure 21. The simulation results and HIL test results obtained under the gradual change in both solar irradiation and temperature. (a) Current, (b) Voltage, and (c) Power. C urrent (A) V oltage (V ) Power (W) 0 1 2 3 4 5 Time (sec) 0 0.5 1 1.5 2 2.5 3 C urren t ( A) HIL Simulation 4 4.2 4.4 1.4 1.6 1.8 1.2 1.3 1.4 1.5 1.2 1.4 1.6 1.8 2 V oltage (V) P ower (W )
6.3 HIL experiment results of ramp change in both solar irradiation and temperature
In Fig. 21, the MPPT performance of simulation and HIL experiment under the ramp change in both solar irradiation and temperature is compared. Again, they have very similar responses and performance.
Lastly, the differences between the simulation results and HIL experiment results are mainly due to the following four reasons:
• Measurement disturbances: which might cause consistent oscillations in the HIL experiment. A filter can be employed to suppress such undesirable disturbances for MPPT performance enhancement;
• Discretization of HIL experiment and sampling holding: which may introduce additional amount of errors in comparison to that of the continuous control utilized in the simulation;
• Transmission delay: which usually leads to a degradation of MPPT performance during the signal transmission; • Unknown harmonics: which is resulted from the numerous small capacitors or inductors distributed between the transmission cables and dSpace device.
7. Discussions of Optimization Features for MPPT
7.1 Optimization efficiency improvement by combining SFLA for MPPT
Optimization efficiency: For a swarm-based optimization algorithm, its optimization efficiency for MPPT is
determined by its balance between local search and global search [64]. A proper balance between these two processes can effectively result in an accurate approximation of the GMPP for a PV system. More specifically, if it pays more attentions to the local search, it will rapidly converge to an optimum but easily trapped at a low-quality local optimum for MPPT. In contrast, a larger searching coefficient on the global search can effectively avoid the local optimum stagnation, but it will consume much more computation time to achieve an accurate approximation of the global optimum.
Improvement by combining SFLA: The original SSA only employs a leader (the first salp) to balance local
search and global search, in which the global search coefficient will gradually decrease as the iteration number increases. Hence, the original SSA is difficult to achieve a proper balance between local search and global search. In this paper, the population partition rule of SFLA is introduced in the global coordination in virtual population of MSSA. This operation by combing SFLA can effectively improve the solution’s diversity in each chain and maintain a proper balance between local search and global search during the optimization process. This can be also combined with other swarm-based optimization algorithms.
Therefore, if SLFA in combination with a swarm-based optimization algorithm can make a more proper balance between global search and local search compared with the original one, then its optimization efficiency will be improved in MPPT problem. Particularly, SLFA combined with PSO [65],[66] has verified that its optimization efficiency in MPPT of PV system can be effectively improved compared with the original PSO, like the efficiency improvement between the proposed MSSA and the original SSA.
7.2 Comparison between MSSA and other heuristic approaches for MPPT
Optimization framework: All the comparative heuristic approaches, including GA [31], PSO [32], ABC [33],
CSA [34], GWO [36], SSA [42], and TLBO [37], only employs a group of individuals for searching GMPP of the PV system. Compared with them, MSSA employs multiple parallel salp chains (multiple groups of individuals) for MPPT under the memetic computing framework, in which each group can independently implement a deep local search; and a regroup operation is designed to coordinate different groups. Hence, MSSA can rapidly obtain a high-quality optimum for MPPT with a higher convergence stability compared with other heuristic approaches.
Optimization performance: Based on the testing results given in Sections 5 and 6, MSSA can make the PV
system generate the largest energy than other approaches under different weather conditions and different seasons, as well as can result in the smallest power fluctuations of PV system.
8. Conclusions
Solar energy is a clean and inexhaustible energy resource which can effectively reduce the greenhouse gas emission caused by the use of fossil fuels, such that a cleaner electricity production could be achieved for the development of a greener society. This paper proposes a novel MSSA based MPPT technique for PV system under PSC, which contributions/novelties are summarized as follows:
(1) Compared with the original SSA, the proposed MSSA employs parallel salp chains for global exploration and local exploitation under the memetic computing framework, while a virtual population is used for the global coordination with regroup operation. Hence, MSSA can search a higher quality optimum with a faster speed and a more stable convergence.
(2) Comprehensive case studies and a dSpace based HIL experiment are undertaken to verify the effectiveness and advantages of MSSA for MPPT compared with other methods. Test results demonstrate that MSSA can outperform the other MPPT algorithms, which can not only make the PV system generate more energy under different weather conditions in different seasons, but also result in a smaller power fluctuation. In particular, the average variability of MSSA under step change in solar irradiation is only 33.56%, 80.17%, 84.35%, 88.99%, 71.85%, 82.91%, 66.04%, 84.35% to that of INC, GA, PSO, ABC, CSA, GWO, SSA, and TLBO, respectively.
Future studies will be focused on the following two aspects:
(a) Apply MSSA on a real PV panel to further validate its implementation feasibility;
(b) Incorporate MSSA based MPPT algorithm with PV inverter to construct an integrated grid-connected PV systems for solar energy supply.
Acknowledgments
The authors gratefully acknowledge the support of National Natural Science Foundation of China (51477055, 51667010, 51777078).
References
[1] Sequeira, T.N.; Santos, M.S. Renewable energy and politics: A systematic review and new evidence. Journal of Cleaner Production
2018,192: 553-568.
[2] Yang, B.; Jiang, L.; Wang, L.; Yao, W.; Wu, Q.H. Nonlinear maximum power point tracking control and modal analysis of DFIG based wind turbine. International Journal of Electrical Power & Energy Systems2016, 74: 429-436.
[3] Yuan, X.C.; Lyu, Y.J.; Wang, B.; Liu, Q.H.; Wu, Q. China's energy transition strategy at the city level: The role of renewable energy.
Journal of Cleaner Production 2018,205: 980-986.
[4] Yang, B.; Zhang, X.S.; Yu, T.; Shu, H.C.; Fang, Z.H. Grouped grey wolf optimizer for maximum power point tracking of doubly-fed induction generator based wind turbine. Energy Conversion and Management2017, 133: 427-443.
[5] Yang, B.; Yu, T.; Shu, H.C.; Dong, J.; Jiang, L. Robust sliding-mode control of wind energy conversion systems for optimal power extraction via nonlinear perturbation observers, Applied Energy 2018,210: 711-723.
[6] Liu, J.; Wen, J.Y.; Yao, W.; Long, Y. Solution to short-term frequency response of wind farms by using energy storage systems. IET Renewable Power Generation2016, 10(5): 669-678.
[7] Yang, B.; Yu, T.; Shu, H.C.; Zhang, X.S.; Qu, K.P.; Jiang, L. Democratic joint operations algorithm for optimal power extraction of PMSG based wind energy conversion system. Energy Conversion and Management2018, 159: 312-326.
[8] Liao, S.W.; Yao, W.; Han, X.N.; Wen, J.Y.; Cheng, S.J. Chronological operation simulation framework for regional power system under high penetration of renewable energy using meteorological data. Applied Energy2017, 203: 816-828.
[9] Chen, J.; Yao, W.; Zhang, C.K.; Ren, Y.; Jiang, L. Design of robust MPPT controller for grid-connected PMSG-Based wind turbine via perturbation observation based nonlinear adaptive control. Renewable Energy2019, 134: 478-495.
[10] Yang, B.; Yu, T.; Zhang, X.S.; Li, H.F.; Shu, H.C.; Sang, Y.Y.; Jiang, L. Dynamic leader based collective intelligence for maximum power point tracking of PV systems affected by partial shading condition. Energy Conversion and Management 2019, 179: 286-303.
[11] Paulo, A.F.; Porto, G.S. Evolution of collaborative networks of solar energy applied technologies. Journal of Cleaner Production 2018,
204: 310-320.
[12] Guta, D.D. Determinants of household adoption of solar energy technology in rural Ethiopia. Journal of Cleaner Production 2018, 204:
193-204.
[13] Hossain, M.; Mekhilef, S.; Olatomiwa, L.; et al. Application of extreme learning machine for short term output power forecasting of three grid-connected PV systems. Journal of Cleaner Production2017, 167: 395-405.
[14] Guilherme, Z.; Anderson, L.S.; Osiris, C.J. Hybrid photovoltaic module for efficiency improvement through an automatic water cooling system: A prototype case study. Journal of Cleaner Production2018, 196: 535-546.
[15] Müslüm, A.; Feyza, B.; Sandro, N.; Agis, M.P. Phase change material based cooling of photovoltaic panel: A simplified numerical model for the optimization of the phase change material layer and general economic evaluation. Journal of Cleaner Production2018, 189:
738-745.
[16] Farhan, H.; Prashant, B.; Sudhakar, K.; Rizalman, M. Performance and land footprint analysis of a solar photovoltaic tree. Journal of Cleaner Production2018, 187: 432-448.
[17] Mohamed, A.E.; Mostafa, M.A.; Abdulrahman, O.A. Energy analysis of hybrid solar tunnel dryer with PV system and solar collector for drying mint (MenthaViridis). Journal of Cleaner Production2018, 181: 352-364.
[18] Kandemir, E.; Cetin, N.S.; Borekci, S. A comprehensive overview of maximum power extraction methods for PV systems. Renewable and Sustainable Energy Reviews2017, 78: 93-112.
[19] Bayrak, F.; Ertürk, G.; Oztop, H.F. Effects of partial shading on energy and exergy efficiencies for photovoltaic panels. Journal of Cleaner Production2017, 164: 58-69.
[20] Mohapatra, A.; Nayak, B.; Das, P.; Mohanty, K.B. A review on MPPT techniques of PV system under partial shading condition. Renewable and Sustainable Energy Reviews 2017, 80: 854-867.
[21] Motahhir, S.; Chalh, A.; Ghzizal, A.E.; Derouich, A. Development of a low-cost PV system using an improved INC algorithm and a PV panel Proteus model. Journal of Cleaner Production2018, 204: 355-365.
[22] Tanaka, T.; Toumiya, T.; Suzuki, T. Output control by hill-climbing method for a small scale wind power generating system. Renewable Energy2014, 12(4): 387-400.
[23] Mohanty, S.; Subudhi, B.; Ray, P.K. A grey wolf-assisted Perturb & Observe MPPT algorithm for a PV system. IEEE Transactions on Energy Conversion2017, 32(1): 340-347.