A Study of Hierarchical and Flat Classification of
Proteins
Arthur Zimek, Institut f¨ur Informatik, Ludwig-Maximilians-Universit¨at M¨unchen, Germany
Fabian Buchwald, Fakult¨at f¨ur Informatik, Technische Universit¨at M¨unchen, Germany
Eibe Frank, Computer Science Department, University of Waikato, New Zealand
Stefan Kramer, Fakult¨at f¨ur Informatik, Technische Universit¨at M¨unchen, Germany
Abstract— Automatic classification of proteins using machine learning is an important problem that has received significant attention in the literature. One feature of this problem is that expert-defined hierarchies of protein classes exist and can potentially be exploited to improve classification performance. In this article we investigate empirically whether this is the case for two such hierarchies. We compare multi-class classification techniques that exploit the information in those class hierarchies and those that do not, using logistic regression, decision trees, bagged decision trees, and support vector machines as the underlying base learners. In particular, we compare hierarchical and flat variants of ensembles of nested dichotomies. The latter have been shown to deliver strong classification performance in multi-class settings. We present experimental results for synthetic, fold recognition, enzyme classification, and remote homology detection data. Our results show that exploiting the class hierarchy improves performance on the synthetic data, but not in the case of the protein classification problems. Based on this we recommend that strong flat multi-class methods be used as a baseline to establish the benefit of exploiting class hierarchies in this area.
Index Terms— protein classification, hierarchical classification, multi-class classification
I. INTRODUCTION
P
ROTEIN classification is a prominent problem in bioinfor-matics that can be approached using standard multi-class classification techniques from machine learning. However, in this domain, there is additional background knowledge in the form of expert-defined hierarchies of protein classes that can poten-tially be exploited to improve predictive performance. In fact, many practical multi-class classification problems are actually hierarchical classification problems: a set of classes can often be more appropriately understood as a set of sets of classes, where subsets comprise classes that are more similar to each other than to classes in other subsets. Given a hierarchy of classes, standard machine learning approaches may find it harder to discern similar classes than classes that are unrelated according to the classification system. Thus it can be beneficial to apply a recursive top-down approach to hierarchical classification: first, discriminate the subsets of classes at the top level of the hierarchy, and then recursively separate the classes (or sets of classes) in those subsets.Hierarchical problems are particularly prevalent in the domain of biology, due to the evolutionary development of biological objects: one often finds families of objects that share many prop-erties with each other but not with objects of other families. This is also true in the domain of proteins. Although they may differ widely in their details, they may share some characteristics in their
three-dimensional structure. One of the well-established structural classifications of proteins, SCOP [1], organizes the class hierarchy according to various criteria, including secondary structure con-tent (on the structural class level) and evolutionary relatedness (on the fold and superfamily level). The task infold recognitionis then to assign the correct fold to a protein of unknown structure based on the known sequence of amino acids. Thus, it is essentially a classification problem, with the classes on the second level of the SCOP hierarchy. Another established hierarchy of classes of a subset of proteins, the enzymes, is the enzyme nomenclature [3]. Enzymes are proteins that exhibit specific catalytic functions (e.g., alcohol dehydrogenase and glycerol dehydrogenase, among others). A hierarchy is given because enzymes can be classified into subtypes. At the highest level there is the type of enzyme, for example, oxidoreductases (EC 1). Considering this group there is then a certain type of oxidoreductases (EC 1.1: acting on the CH-OH group of donors), and of these there is a certain subtype with a particular chemical reaction scheme (EC 1.1.1: with NAD or NADP as acceptor). Another well-studied problem that is more complex than fold recognition,remote homology detection, aims for the classification into the correct superfamily without the help of sequence similarity.
While the development of machine learning methods for protein classification has made significant progress [4], [5], many ap-proaches to fold recognition and remote homology detection have been tested only in the binary classification setting. However, due to the existence of expert-defined class hierarchies for proteins, it is natural to consider hierarchical classification techniques [6], [7], [8], [9]. Our aim here is to investigate, for several typical protein classification datasets, whether it is indeed beneficial to exploit this expert knowledge when applied in conjunction with a strong multi-class classification technique. As the main tool for our experiments we use ensembles of nested dichotomies [10], a method for reducing multi-class problems to binary classification task that has been shown to be very competitive with other strong multi-class learning techniques. Nested dichotomies take class probability estimates of binary classification models built by a chosen base learner—we use logistic regression, C4.5 decision trees, bagged C4.5 decision trees, and support vector machines (SVMs) with Platt scaling [11]—and return probability estimates for all classes as output. A crucial feature of this method is that it can be easily adapted to make use of class hierarchies by constraining the nested dichotomies that are used. Thus we can perform a fair comparison of hierarchical and flat classification that enables us to measure the benefit of using a particular expert-defined class hierarchy. The primary aim of this paper is to provide such a comparison. Although we obtain results that Digital Object Indentifier 10.1109/TCBB.2008.104 1545-5963/$25.00 © 2008 IEEE
are competitive with those we could find in the literature, the development of new methods for protein classification is not the focus of this paper. However, the findings of our comparative study should prove useful in the development and evaluation of such techniques.
The paper is organized as follows. Section II describes the hierarchical and flat classification methods that we evaluated in our experiments. Section III has experimental results for synthetic, fold recognition, enzyme classification and remote homology data. Section IV has a discussion of our findings. In Section V we briefly review related work on hierarchical classification. Section VI has some concluding remarks.
II. HIERARCHICAL VS. FLATCLASSIFICATION
W
E consider learning problems where we are given a set ofinstances as input data that each exhibit a class label. The class label defines to which group of proteins the corresponding instance belongs. The aim is to build a classification model using machine learning techniques that can be used to predict the class label for a new instance (i.e. protein). With more than two groups of proteins this is a standard multi-class classification problem (see Figure 1 (a)). However, the interesting aspect of protein classification is that protein classes can be organized into a hierarchy, giving rise to a hierarchical classification problem.
A hierarchical classification problem can be viewed as a problem involving a large number of classes, where some subsets of classes are more closely related than others. As an example, consider the hierarchical classification problem in Figure 1 (b). The problem consists of three superclasses, a, b, and c. Each of these three superclasses contains three subclasses. The given hierarchy states that the subclasses from one superclass are more strongly related to each other than to subclasses of other superclasses. For instance, class 1 is related to class2, but not to4. In the following, we will call the classes without subclasses
leaf classes.1 A class associated with an internal node of a class hierarchy represents the set of all leaf classes in the tree below.
A. Basic Methods
In this study the aim is to investigate whether predictive performance can be improved by exploiting the class hierarchy. An alternative is to discard it and treat the problem as a standard multi-class classification problem, based on the set-up shown in Figure 1 (a). The problem can then be tackled with standard multi-class algorithms.
A straightforward approach to exploiting a given class hierar-chy is to place a standard multi-class classification model at each internal node of the tree, built from the corresponding portion of the training data associated with a node. In the following we will often refer to these internal classification models as “base classifiers”. We assume that these base classifiers deliver class probability estimates, so that we can obtain a probability of class membership for each of the subclasses at an internal node.
Given class probability estimators for all the internal nodes, it is straightforward to obtain probabilities for the leaf nodes. Because the subclasses at a particular node are disjoint and complete, the base classifiers’ probability estimates along a path from the root to
1We chose the term “leaf class” instead of “base class” to avoid confusion with the term “base classifiers”, as used below.
a leaf node can be multiplied to obtain class probability estimates for that leaf class.
To be more specific, consider a class hierarchy, for instance, the one shown in Figure 1 (b). Then we determine, for each internal nodei, the set of leaf classes in the leafs below that node, and define the classCiof that node as the set of its leaf classes. Let
Ci1 to Cimi be the mi subclasses of class Ci associated with node i. Moreover, let p(c ∈ Cij|x, c ∈ Ci) be the conditional probability distribution for the mi classes at node i, given an instancex, estimated by the base classifier at that node. Then the estimated class probability for class valuecis given by
p(c=C|x) = i∈int. nodes mi j=1 I(c∈Cij)p(c∈Cij|x, c∈Ci), (1)
where I is the indicator function, and the product is over all the internal nodes of the tree. Because of the indicator function, only those probabilities along the path to the corresponding leaf node forc contribute to the product. For Figure 1 (b), we have, for instance, p(c = 4|x) = p(c ∈ {4}|x, c ∈ {4,5,6})×p(c ∈ {4,5,6}|x). Thus, no other nodes need to be visited when the product is computed. In the following, this type of probabilistic hierarchical classifier will be denoted byHClass.
B. Ensembles of Nested Dichotomies
In addition to the above baseline methods for flat and hi-erarchical classification, we also tested ensembles of nested dichotomies (ENDs) [10]. ENDs are a general-purpose method for multi-class classification based on artificialbinaryhierarchical decompositions of the original multi-class problem. An example of an END for three classes is shown in Figure 2. ENDs have been shown empirically to deliver performance competitive with error-correcting output codes [12], a prominent binarization technique for improving classification performance in multi-class settings.
ENDs are closely related to the hierarchical approach dis-cussed above. The difference is that multiple artificial binary hierarchies—called “nested dichotomies”—are used instead of an expert-definedn-ary one. This ensemble of nested dichotomies is used to form predictions.
Although ENDs are based on artificial hierarchical structures, they are classified as flat classifiers in the context of this paper because they do not make use of an expert-defined hierarchy. However, we can constrain the construction of the binary hier-archies to be consistent with an expert-defined one, by ensuring that class-subclass relationships from the original hierarchy are maintained in the binary hierarchy. This yields a hierarchical classification method based on ENDs and provides us with a mechanism for testing the benefit of using a given expert-defined hierarchy for model building: we can simply compare the predic-tive performance of ensembles of unconstrained and constrained nested dichotomies (EN Dsand ECN Dsrespectively).
Figure 1 (c) shows a system of nested dichotomies that is consistent with then-ary hierarchy from Figure 1 (b). We learn an ensemble of these trees for prediction because the given tree is not the only possible binarization: the original n-ary class hierarchy can be represented by other binary trees in a valid manner. Hence we construct an ensemble model with a certain user-specified number of these trees. At prediction time, class probability estimates for a particular class are obtained from the
Fig. 1. Example of (a) a flat multi-class classification problem, (b) a class hierarchy exhibiting three superclassesa,b, andc, with three subclasses each, and (c) a valid binarization of then-ary class hierarchy from (b), where multi-class problems have been replaced by two-class problems. This is one possible ensemble member for an ensemble of constrained nested dichotomies (ECNDs) for this hypothetical classification problem.
Fig. 2. Example of an ensemble of nested dichotomies (END) for three classesa,b, andc. The first ensemble member contains two probabilistic binary classifiers, one for{a}vs.{b, c}, and one for{b}vs.{c}.
different trees in the ensemble according to Equation 1 and then simply averaged.
As there is no a priori reason to prefer one particular bina-rization, we consider them all to be equally likely. However, although constraining the set of trees based on a given hierarchy reduces the number of possible binarizations—from 2,027,025 to
81 in the above example—it is not possible to consider all of them. The approach we use in this study is to choose randomly among the possible binarizations with uniform probability. This approach has been shown to work well on standard multi-class classification problems from the UCI repository [10]. In that case, a relatively small number of randomly chosen ensemble members, namely 10 to 20, was found to be sufficient for close-to-optimum performance.
In our experiments, we compare standard unconstrained ENDs and ECNDs. We also consider a third approach, where we use the standard hierarchical classification approach from the previous subsection and apply unconstrained ENDs at each internal node of the n-ary tree. We will refer to this latter approach, where ensemble construction and model averaging is performed inside the expert-defined hierarchy, as hierarchies of ensembles of nested dichotomies (HEN Ds). It provides us with another method of evaluating the benefit of a given expert-defined hierarchy. An
overview of the learning schemes compared in this study is given in Table I.
III. EXPERIMENTS
I
N this section we describe experimental results obtained with the above flat and hierarchical classification methods. The first part focuses on fold recognition and enzyme classification, the second part on remote homology detection.A. Fold Recognition and Enzyme Classification
First, we present the results for fold recognition and en-zyme classification, using logistic regression, decision trees, and bagging as the base learners. In addition to the two protein classification datasets, we test the approaches on synthetic data to test hierarchical and flat classifiers under perfect conditions where the class hierarchy is reflected in the relative distribution of the classes in the feature space.
1) Datasets:
a) Synthetic Data: The synthetic data was created according to a predefined hierarchy of classes. This hierarchy consists of four levels. Each inner node branches into four subclasses, leading to 256 classes at the leaves. Each class is represented
TABLE I
SUMMARY OF DIFFERENT FLAT MULTI-CLASS AND HIERARCHICAL CLASSIFICATION SCHEMES.
Short-hand Hierarchy Full Name Used?
M ulti No Multi-class classifier
Summary
Native multi-class versions of decision trees and logistic regression, and pairwise coupling with Platt scaling for support vector machines
HClass Yes Hierarchical classifier
Summary
Probabilistic hierarchical classifier, where probabilistic multi-class classifiers reside in each internal node of the given hierarchy
EN D No Ensembles of nested hierarchies
Summary
Multiple random binary class decompositions of a multi-class problem
ECN D Yes Ensembles of constrained nested dichotomies
Summary
Multiple random binary class decompositions of a multi-class hierarchy, i.e., decompositions that respect the order of the classes in the original hierarchy
HEN D Yes Hierarchy of ensembles of nested dichotomies
Summary
One hierarchical classifier with ENDs in the internal nodes
by 40 instances, resulting in 10,240 instances in total. The instances are described by 40 numeric features. For each level of the hierarchy, one of these features is distributed according to Gaussian distributions with different means, with one Gaussian for each class. Additionally, there are nine other features per level that are governed by the same distribution with a probability of 0.8; but their remaining feature values are scattered across the complete range of possible values,[0,1]. Thus, we have 40 features, but only four of them reflect the true class distribution completely.
b) Ding & Dubchak - Fold Recognition: The second dataset we use is the fold recognition dataset provided by Ding and Dubchak [6], which is based on SCOP [1] (seehttp://www. nersc.gov/˜cding/protein). It consists of a training set of 320 proteins and a test set of 385 proteins. For the training set, Ding and Dubchak selected 27 folds which have at least seven proteins in the database. These 27 folds represent the major structural classesα,β,α/β, andα+β. The classification task is to predict the fold of a protein (level two of SCOP). For an independent test set, Ding and Dubchak selected 385 representatives from the PDB-40D [13]. This set contains the SCOP sequences that exhibit less than 40% pairwise sequence identity. The test sequences represent the same 27 folds as those in the training set. Proteins were excluded if they had a sequence identity of greater than 35% with any of the proteins in the training set. Note that 35% is still relatively high for fold recognition. Hence the test set contains proteins homologous to proteins in the training set [14], making it an easier target for alignment-based methods than for machine learning methods. Also note that the SCOP classification provided by Ding and Dubchak for their dataset is partially obsolete. Nevertheless, we used this data as it enables a comparison with other machine learning methods and is still used for that purpose [15], [16]. We also used the features introduced by Dubchaket al. [17] to
represent protein domains. In total, the proteins are described by 126 features. This feature set is widely used by other machine learning approaches and gives remarkably good results [18], [19], [20], [7].
c) BRENDA - Enzyme Classes: Our third dataset con-tains 10,253 enzymes from the BRENDA database (http: //www.brenda.uni-koeln.de), representing the ratios of the enzymatic main classes (as they are commonly estimated) in this subset. The representation is more abstract than in our second dataset: we only use the distribution of amino acids (the percentage of each of the 20 amino acids in the complete chain), and the percentages of three groups of amino acids (hydrophobic, hydrophilic, and neutral) [21], [22], since the distribution of hydrophilic and hydrophobic amino acids is characteristic for the 3D structure and the cell compartment. Thus, for this data we have a total of 26 features [23]. As class hierarchy we utilized the first three levels of the enzyme hierarchy. The enzyme classes at EC level 3 are the leaf classes, levels 2 and 1 are used as super-classes.2 We selected only those classes that contained at
least eight instances. The resulting dataset contains 115 different classes.
2) Methods: To perform the experiments we used the WEKA machine learning workbench [24], enhanced by the hierarchical classification methods discussed above. Ten ensemble members where used in each method based on ENDs. For the experiments in this section, we used logistic regression, unpruned C4.5 de-cision trees and bagged unpruned C4.5 dede-cision trees as stand-alone classifiers and as base learners for the other methods. For bagging, we used 10 iterations. In addition to the two groups of methods discussed earlier—one that does not use the class
2Note that although the suffixes of the third level indicate that classes are related (e.g., 1.1.1, 1.2.1, ...), the information from the first two levels (e.g., 1.1, 1.2, ...) is dominant. Therefore, the enzyme classification is in fact a tree and not a directed acyclic graph (DAG).
hierarchy at all and one that does—we also introduce a third group, namely one based on using an artificial class hierarchy that is constructed as adversely as possible with respect to the original hierarchy. In this adverse hierarchy, direct siblings exhibit the greatest possible distance in the original hierarchy. Details of the construction method are explained in the appendix of the paper.
We use two evaluation metrics: plain classification accuracy and misclassification cost. Both were estimated using stratified ten-fold cross-validation in the case of the first and third dataset, where no explicit train/test split was given. A symmetric cost matrix was defined based on the hierarchy of classes to compute the misclassification cost, giving higher costs to errors where the incorrect class is far away from the true class in the hierarchy. More specifically, the misclassification cost for a pair of classes,
yi and yj, was computed as the minimum number of edges between the leaves representingyi and yj in the class hierarchy, and the node representing their smallest common superclass. Considering the hierarchy depicted in Figure 1 (b), the misclassi-fication cost for confusing classes1and2would be1, for1and
4it would be2.
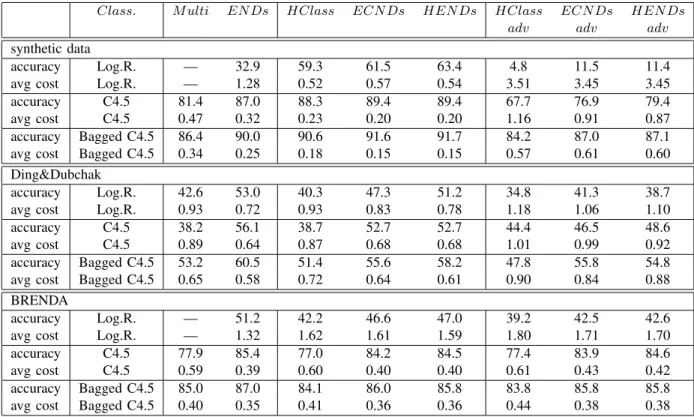
3) Results: The results of our experiments are summarized in Table II. The first two columns contain the results for methods that do not take the class hierarchy into account: the leaf classes are used to define a standard multi-class problem. The first column has results for the native multi-class methods (M ulti), i.e. plain logistic regression, C4.5 decision trees and bagged C4.5 decision trees. The second columns shows results for EN Ds, using the three different techniques as base classifiers. In the next three columns, results for hierarchical classification can be found. The first of these columns has results for the basic hierarchical approach, using the above three native multi-class classifiers in the internal nodes (HClass), and the next two columns have results for the two hierarchical variants ofEN Ds(ECN Dsand
HEN Ds). The last three columns contain the results of the same hierarchical methods applied to adversely constructed hierarchies. Note that, due to the large number of classes in the first and third dataset, logistic regression failed to terminate in a reasonable amount of time.
The table has results for plain classification accuracy as well as the average misclassification cost across all test instances. Cost-sensitive prediction was employed to generate values for the latter statistic: instead of predicting the class with maximum probability, this approach predicts the class with minimum expected mis-classification cost [24]. Because all the learning schemes we use produce class probability estimates, we can compute the expected misclassification cost for each prediction based on these estimated probabilities, and hence the class with minimum expected cost.
In Table II, we can observe several tendencies: first, hierarchical classification methods outperform EN Dsonly on the synthetic data, regardless of whether we consider classification accuracy or misclassification cost as the evaluation metric. For all the base classifiers used, the performance of EN Ds on the fold recognition and enzyme classification problems is consistently better than the performance of any of the hierarchical classifiers. The use of a given hierarchy helps only on the synthetic data, where feature space and class hierarchy were set up to match perfectly. This finding will be discussed in more detail below.
Logistic regression models are consistently outperformed by unpruned C4.5 decision trees, which are in turn consistently
TABLE III
COMPARISON OF PREDICTION ACCURACY FOR SEVERAL MACHINE LEARNING APPROACHES TO FOLD RECOGNITION ON THE DATA OFDING
ANDDUBCHAK. THE RESULTS ARE TAKEN FROMDING ANDDUBCHAK
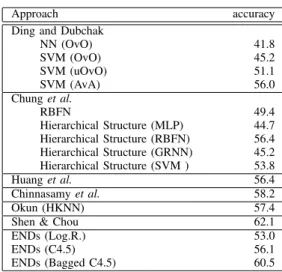
[6], CHUNGet al.[19], HUANGet al.[20], CHINNASAMYet al.[18], OKUN[16],ANDSHEN ANDCHOU[15]. THE RESULTS BYSHEN AND
CHOU WERE OBTAINED ON A DIFFERENT FEATURE SET.
Approach accuracy
Ding and Dubchak
NN (OvO) 41.8 SVM (OvO) 45.2 SVM (uOvO) 51.1 SVM (AvA) 56.0 Chunget al. RBFN 49.4 Hierarchical Structure (MLP) 44.7 Hierarchical Structure (RBFN) 56.4 Hierarchical Structure (GRNN) 45.2 Hierarchical Structure (SVM ) 53.8 Huanget al. 56.4 Chinnasamyet al. 58.2 Okun (HKNN) 57.4
Shen & Chou 62.1
ENDs (Log.R.) 53.0
ENDs (C4.5) 56.1
ENDs (Bagged C4.5) 60.5
outperformed by bagged C4.5 trees, and the use of adverse hi-erarchies harms performance in most cases. However, the impact of using the adverse hierarchy instead of the correct one is quite small on the enzyme classification problem, suggesting that the expert-defined hierarchy does not correspond well to the distri-bution of the data. Among the three hierarchical classification methods, the use of EN Ds in the internal nodes of a class hierarchy (HEN Ds) is the best option over a wide range of settings.
In Table III, we compare our results for the Ding and Dubchak data with results previously published in the literature. The approaches by Chunget al.[19], Huanget al.[20], Chinnasamy
et al.[18], and Okun [16] employ the same representation and test protocol that we adopted from Ding and Dubchak [6]. Shen and Chou [15] used the same test protocol, but with a different representation.3 As can be seen in the table, the END results, in particular with bagged decision trees as base classifiers, are as good as the best results so far.
B. Remote Homology Detection
In a second batch of experiments on the remote homology detection data obtained from Rangwala and Karypis [9], we again used variants of EN Ds as an instrument to investigate hierarchical and non-hierarchical classification of proteins, in this case using SVMs as base models. The sf95 dataset, introduced by Ieet al.[25], uses the remote homology detection framework of Jaakola et al. [26], but applies a high cut-off for sequence similarity, namely 95%. As a consequence, the dataset should be expected to contain examples that are nearly “duplicates”. Therefore, we also tested the methods on the sf40 dataset from Rangwala and Karypis, where the cut-off was set to 40%. To
3The results from Marsolo et al. [7] are not comparable because both a different representation and a different test protocol was used. However, the hierarchical classification method proposed by the authors is similar to
TABLE II
EXPERIMENTAL RESULTS ON THREE DATASETS.
Class. M ulti EN Ds HClass ECN Ds HENDs HClass ECN Ds HENDs
adv adv adv
synthetic data
accuracy Log.R. — 32.9 59.3 61.5 63.4 4.8 11.5 11.4
avg cost Log.R. — 1.28 0.52 0.57 0.54 3.51 3.45 3.45
accuracy C4.5 81.4 87.0 88.3 89.4 89.4 67.7 76.9 79.4
avg cost C4.5 0.47 0.32 0.23 0.20 0.20 1.16 0.91 0.87
accuracy Bagged C4.5 86.4 90.0 90.6 91.6 91.7 84.2 87.0 87.1
avg cost Bagged C4.5 0.34 0.25 0.18 0.15 0.15 0.57 0.61 0.60
Ding&Dubchak
accuracy Log.R. 42.6 53.0 40.3 47.3 51.2 34.8 41.3 38.7
avg cost Log.R. 0.93 0.72 0.93 0.83 0.78 1.18 1.06 1.10
accuracy C4.5 38.2 56.1 38.7 52.7 52.7 44.4 46.5 48.6
avg cost C4.5 0.89 0.64 0.87 0.68 0.68 1.01 0.99 0.92
accuracy Bagged C4.5 53.2 60.5 51.4 55.6 58.2 47.8 55.8 54.8
avg cost Bagged C4.5 0.65 0.58 0.72 0.64 0.61 0.90 0.84 0.88
BRENDA
accuracy Log.R. — 51.2 42.2 46.6 47.0 39.2 42.5 42.6
avg cost Log.R. — 1.32 1.62 1.61 1.59 1.80 1.71 1.70
accuracy C4.5 77.9 85.4 77.0 84.2 84.5 77.4 83.9 84.6
avg cost C4.5 0.59 0.39 0.60 0.40 0.40 0.61 0.43 0.42
accuracy Bagged C4.5 85.0 87.0 84.1 86.0 85.8 83.8 85.8 85.8
avg cost Bagged C4.5 0.40 0.35 0.41 0.36 0.36 0.44 0.38 0.38
make the comparison as precise as possible, we used the same test protocol as Rangwala and Karypis, i.e. the same training and test sets and the same kernel function for the SVMs.
More specifically, we used SVMs with the SW-PSSM ker-nel [27], which have been shown to work well on this task before. To this end we extended the WEKA workbench to enable import of precomputed kernel matrices.4To obtain probability estimates from the SVMs, Platt scaling [11] was performed by fitting logistic models to their output based on internal 10-fold cross-validation. Pairwise coupling [28] was applied to obtain multi-class probability estimates, which involves building an SVM for each pair of classes and post-processing the probability estimates obtained from each of these classifiers. For the results presented here, the complexity parameter C for the SVMs was left at the value one, the default in the WEKA implementation of the sequential minimization method [29] for fitting SVMs. As before, we used 10 ensemble members in each variant ofEN Dsthat we applied.
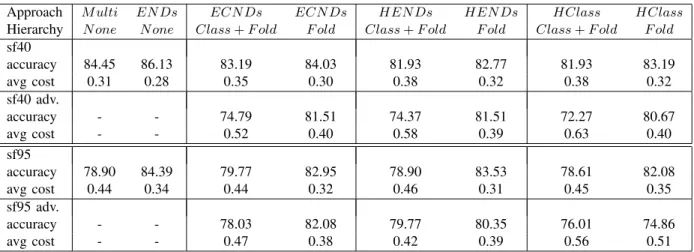
Table IV shows the results obtained. The first column has results for multi-class SVM-based classification using pairwise coupling. The second column has results for standard uncon-strained EN Ds. The table also has results for ECN Ds and
HEN Ds, as wellHClass, in each case used in conjunction with SVMs to solve the learning problems at the internal nodes of the hierarchies. For each classifier, we also report the average cost obtained using cost-sensitive prediction based on the minimum expected cost approach. Cost matrices were constructed as de-scribed in the previous subsection to reflect the given hierarchy in the cost structure. For the hierarchical methods, we report results
4We are grateful to H. Rangwala for providing us with the SW-PSSM matrices.
for two types of hierarchies, as in [27]: (a) protein classes and folds, and (b) folds only.
The results shown in Table IV largely confirm the observations made for the protein classification datasets investigated in the previous section. There is little, if any, benefit in exploiting the expert-defined hierarchies. This can be seen by compar-ing HClass to M ulti, and by comparing EN Ds to ECN Ds
and HEN Ds. Considering accuracy, there is only one win for
HClass vs M ulti, and there are no wins for the hierarchical variants of ENDs vs plain EN Ds. Considering the cost-based scenario the situation is similar: M ulti always achieves lower costs thanHClass. ECN Dsand HEN Ds achieve lower cost than EN Ds on the sf95 data when the fold-based hierarchy is used, but the outcome is reversed on the sf40 data.
In almost all cases an adversely constructed hierarchy produces worse results than an expert-defined one; the exception is the case ofHEN Ds on sf95 when used with hierarchies based on both protein classes and folds. Considering the expert-defined hierarchy, we can also see that the performance is always worse when using classes and folds, rather than using folds only. Moreover, the results show that using methods based on ENDs almost always produce a better outcome than pairwise coupling. Considering accuracy, plain EN Ds produce the best results and Table V compares their performance with results from the literature [9], [25] that are also based on 0/1 loss.5 We observe that our estimates are comparable to results that have previously been obtained on this data. It is interesting to see that the SVM-Struct-based results do not show an advantage for hierarchy-based approaches either.
5We compare to the “Scale & Shift” variants from [9] because they appear closely related to the scaling technique we apply.
TABLE V
COMPARISON OF ERROR RATE FOR SEVERAL MACHINE LEARNING APPROACHES TO REMOTE HOMOLOGY DETECTION ON THE DATA FROM
RANGWALA ANDKARYPIS.
Hierarchy sf40 sf95 Ranking Perceptron [25] None - 21.8
SVM-Struct [25] None - 20.7
SVM-Struct [25] F old - 20.4
MaxClassifier [9] None 21.0 14.7 “Direct K-way Class.” [9] None 20.5 13.5 Ranking Perceptron Sc. & Sh. [9] None 10.9 13.2 SVM-Struct Scale & Shift [9] None 13.4 12.4 SVM-Struct Scale & Shift [9] F old 14.7 12.4 SVM-Struct Scale & Shift [9] Class+F old 13.4 11.2 ENDs with SVMs and Platt Scaling None 13.9 15.6
When interpreting any of these results it is instructive to consider confidence intervals for the estimates. This is important because the test sets for sf40 and sf95 are both very limited in size. We calculated 95% confidence intervals for the error rate ofEN Dson the two datasets. For the sf95 data, with a test set of 346 instances, we obtained a confidence interval of [12.17%, 19.81%] given the observed error rate of 15.61%. For the sf40 data, with a test set of 238 instances, the interval is [10.05%, 18.84%] given the observed error rate of 13.87%. Intervals of similar size can be obtained based on the other results in Table V. Considering the substantial overlap in the intervals obtained in this fashion, it is not clear whether any of the observed differences actually correspond to genuine differences in performance.
IV. DISCUSSION
O
UR results for the artificial data show that recursive hi-erarchical classification can indeed improve classification performance, even if an ensemble-based technique is used as the base learner. However, it appears that strong multi-class techniques like ENDs eliminate the benefit of using the class hierarchy on the real-world datasets considered. Considering ensemble methods like ENDs, there are two possible reasons for this result. The first is that the restrictive effect of the hierarchy increases the similarity of the ensemble members and the resulting increased correlation of errors may outweigh the benefits of building potentially more accurate individual ensemble members. The second reason, which is not just applicable to ensemble methods, is that there is an interaction between the hierarchy and the data representation. If the hierarchy is meaningful, but not reflected in the feature space that is employed, it cannot enhance classification quality. Considering this point it is worthwhile to note that the hierarchies for proteins are “artificial” to a certain degree. For example, in SCOP, folds may or may not have inherited relations that are reflected in the sequence. Also, enzyme classes categorize functions of proteins, but the same function is often acquired by proteins of different ancestry. Thus, although similar function must somehow relate to similarities among proteins, one functional class, not to mention super-class, may contain proteins that differ considerably despite the fact that some subsets exhibit certain small similarities (like active sites). Although the features used in our experiments—as any feature space known for the representation of protein sequences— may reflect overall similarity to some degree, they may not reflect the relevant patterns specific for certain (super-)classes. However, if the hierarchy is adequate for representing overallclass similarity when expressed in the feature space (as in the synthetic dataset), the classification performance should at least not deteriorate. Thus, the relative performance of hierarchical and flat classification may indicate whether a feature space is appropriate for a certain class hierarchy and vice versa. Since the choice of an adequate feature representation is rarely obvious in practice, this result suggests that strong multi-class methods should be tested as baseline methods when class hierarchies are used in protein classification.
V. RELATEDWORK
T
HERE is a significant amount of work on hierarchical classification in machine learning, particularly in the area of document classification. We will review some of the relevant literature in the following. Kiritchenko [30] has an excellent, comprehensive, review of work in this area.Koller and Sahami [31] present results for recursive hierarchical classification with “hard” classifications at the internal nodes. Bayesian classifiers are built for these nodes, and feature selection is performed individually for each node. Increased accuracy compared to a flat classifier is observed for those Bayesian classifiers that admit modeling dependencies between features, and this is attributed to the localized feature selection. Note that decision trees and bagged decision trees perform feature selection implicitly.
Greiner et al. [32] also use recursive hierarchical classifica-tion with hard classificaclassifica-tions at the internal nodes and present preliminary results on a text classification problem. They use pairwise linear classification and a simple probabilistic classifier as the base learners. They do not observe improved performance when using the true hierarchy compared to the corresponding flat classifier or a “bogus” hierarchy. However, they do observe a small improvement in performance when using the hierarchy only at training time to smooth the estimates in the probabilistic classification model. Similarly, McCallum et al. [33] find that hierarchical smoothing works well when using naive Bayes on text classification problems.
Nget al.[34] tackle a hierarchical text categorization problem by assembling a set of linear classifiers into a hierarchy, but the hierarchy is not exploited when training the linear classifiers. Ruiz and Srinivasan [35] extend this approach by using multilayer perceptrons. They observed improved performance compared to a flat classifier. Weigendet al.[36] also use multilayer perceptrons but exploit the hierarchy at training time, and combine predic-tions probabilistically, as in this paper. They observe improved performance on a text categorization problem compared to a corresponding flat neural network.
Dumais and Chen [37] use a hierarchical classifier for web content, using support vector machines at the internal nodes, and evaluate both hard classification as well as probabilistic combination. Both methods perform equally well and result in small improvements on flat classification. A similar approach is used by Sunet al.[38]. D’Alessioet al.[39] use heuristic linear classifiers at the internal nodes and a hierarchical feature selection scheme. They observe improved performance compared to a flat classifier.
Chakrabati et al. [40] build a hierarchical collection of naive Bayes classifiers and combine them probabilistically. This method is used in conjunction with hierarchical feature selection. They conclude that the “hierarchy enhances accuracy in modest
TABLE IV
EXPERIMENTAL RESULTS ON REMOTE HOMOLOGY DETECTION DATA.
Approach M ulti EN Ds ECN Ds ECN Ds HEN Ds HEN Ds HClass HClass
Hierarchy N one N one Class+F old F old Class+F old F old Class+F old F old
sf40 accuracy 84.45 86.13 83.19 84.03 81.93 82.77 81.93 83.19 avg cost 0.31 0.28 0.35 0.30 0.38 0.32 0.38 0.32 sf40 adv. accuracy - - 74.79 81.51 74.37 81.51 72.27 80.67 avg cost - - 0.52 0.40 0.58 0.39 0.63 0.40 sf95 accuracy 78.90 84.39 79.77 82.95 78.90 83.53 78.61 82.08 avg cost 0.44 0.34 0.44 0.32 0.46 0.31 0.45 0.35 sf95 adv. accuracy - - 78.03 82.08 79.77 80.35 76.01 74.86 avg cost - - 0.47 0.38 0.42 0.39 0.56 0.51
amounts, but greatly enhances speed”. Larkey [41] investigates hierarchical classification of patents using naive Bayes and the k-nearest-neighbor classifier, but found no improvement on flat classification.
Chunget al. [19] use a hierarchical approach for the classifi-cation of proteins, similar to the basic method we use, but with “hard” classifications at the internal nodes instead of probabilistic assignments. We compared our results to their best results in the previous section (see Table III). They considered four different base classifiers (SVMs and three types of neural networks) and obtained improved accuracy in three cases and a degradation in one case when using a hierarchical approach instead of a flat one. Recently, several authors have investigated dedicated algo-rithms for learning large margin classifiers for hierarchical prob-lems. Cai and Hofmann [42] find that their generalized algorithm for training support vector machines improves on a flat multi-class support vector machine when evaluated on a patent categorization problem. Dekel et al. [43] present online and batch algorithms for learning hierarchical classifiers and show that they improve on “flattened” versions of these algorithms when applied to a text categorization dataset and a phoneme recognition problem. Rousu
et al.[44] propose an algorithm for learning a maximum margin Markov network and show that it improves on a flat support vector machine on two text categorization problems.
Recent work on the hierarchical classification of proteins is based on the application of margin-based meta-learning schemes that are used to combine the predictions of one-versus-rest binary classifiers. Melvin et al. [8] compare this type of technique to BLAST-based classification and standard one-vs-all classification and a calibrated version thereof. Rangwala and Karypis [9] investigate a very similar scheme but consider information from above and below the target level, as well as the target level itself. They compare to one-vs-all classification and native multi-class multi-classification and observe that, when considering plain and balanced classification error, “the use of hierarchical information leads to some improvements” on one of the four datasets they consider, which corresponds to a fold recognition problem.
A “multi-tiered” approach similar to HClass has also been used to test various feature subsets and native multi-class methods for hierarchical classification of proteins [7]. Different from a predecessor paper by a similar group of authors [6], this work
does not consider methods for the reduction of multi-class to binary classification problems.
VI. CONCLUSION
I
N this paper we have studied the relative performance of hierarchical and flat machine learning schemes for the clas-sification of proteins based on well-known expert-defined hier-archies. Our experiments were designed to evaluate the impact on classification performance when using this additional domain knowledge. As the main instrument for measuring the effect of hierarchical information we have used hierarchical and flat versions of ensembles of nested dichotomies, a technique for solving multi-class classification problems by binarization. We evaluated the performance of these methods on real-world protein classification data sets, as well as an artificial dataset where we could ensure that the class hierarchy is actually reflected in the data. We presented results based on (a) using no class hierarchy, (b) using the expert-defined hierarchy for the dataset at hand, and (c) using a class hierarchy that has been constructed adversely to the commonly accepted hierarchy.In general, one would expect that the learning task becomes easier for a hierarchical classification scheme if the structure of the class hierarchy is reflected by the similarity of the instances from the various classes in feature space. An appropriate class hierarchy can guide the learning algorithm to a good solution. Vice versa, an arbitrary structure of classes that is not related to the similarity of instances can increase the complexity of the clas-sification problem. This also applies to the hierarchical variants of ensemble classifiers: if the hierarchy is not sufficiently reflected in feature space there is little to be gained from exploiting it. In the case of ensemble classifiers there is the additional problem that constraining the set of possible ensemble members may simply result in a higher correlation of errors they make, thus degrading classification performance.
In our experiments we found that hierarchical classification improved classification performance on the artificial dataset con-sidered, but provided no clear benefit on the real-world protein classification datasets. In particular, ensembles of unconstrained nested dichotomies outperformed their hierarchical classification variants in almost all cases, regardless of the base classifier used, and delivered the best performance overall. Similar conclusions
can be drawn from our experiments with remote homology detection. Based on our observations we recommend that strong multi-class machine learning algorithms should be used as base-line methods when investigating the benefit of expert-defined hierarchies.
REFERENCES
[1] A. G. Murzin, S. E. Brenner, T. Hubbard, and C. Chothia, “SCOP a structural classification of proteins database for the investigation of sequences and structures,”J. Mol. Biol., vol. 247, pp. 536–40, 1995. [2] C. A. Orengo, A. Michie, S. Jones, D. T. Jones, M. B. Swindells, and
J. M. Thornton, “CATH – a hierarchic classification of protein domain structures,”Structure, vol. 5, no. 8, pp. 1093–108, 1997.
[3] Nomenclature Committee of the Int. Union of Biochemistry and Molec-ular Biology),Enzyme Nomenclature. Academic Press, 1992. [4] H. Saigo, J.-P. Vert, N. Ueda, and T. Akutsu, “Protein homology
detection using string alignment kernels,”Bioinformatics, vol. 20, no. 11, pp. 1682–89, 2004.
[5] C. Leslie, E. Eskin, A. Cohen, J. Weston, and W. Noble, “Mismatch string kernels for discriminative protein classification,”Bioinformatics, vol. 20, no. 4, pp. 467–76, 2004.
[6] C. H. Q. Ding and I. Dubchak, “Multi-class protein fold recognition using support vector machines and neural networks,” Bioinformatics, vol. 17, no. 4, pp. 349–58, 2001.
[7] K. Marsolo, S. Parthasarathy, and C. Ding, “A multi-level approach to scop fold recognition,” inProc. 5th IEEE Symposium on Bioinformatics and Bioengineering. IEEE Computer Society, 2005, pp. 57–64. [8] I. Melvin, E. Ie, J. Weston, W. S. Noble, and C. Leslie,
“Multi-class protein “Multi-classification using adaptive codes,”Journal of Machine Learning Research, vol. 8, pp. 1557–81, 2007.
[9] H. Rangwala and G. Karypis, “Building multiclass classifiers for remote homology detection and fold recognition.”BMC Bioinformatics, vol. 7, no. 1, p. 455, 2006.
[10] E. Frank and S. Kramer, “Ensembles of nested dichotomies for multi-class problems,” inProc. Twenty-first Int. Conf. on Machine Learning. ACM Press, 2004, pp. 84–95.
[11] J. C. Platt,Advances in Large Margin Classifiers. MIT Press, 1999, ch. Probabilistic outputs for support vector machines and comparison to regularized likelihood methods.
[12] T. G. Dietterich and G. Bakiri, “Solving multiclass learning problems via error-correcting output codes,” Journal of Artificial Intelligence Research, vol. 2, pp. 263–86, 1995.
[13] L. Lo Conte, B. Ailey, T. J. P. Hubbard, S. E. Brenner, A. G. Murzin, and C. Chothia, “SCOP: a structural classification of proteins database,”
Nucleic Acids Research, vol. 28, pp. 257–9, 2000.
[14] E. Bindewald, A. Cestaro, J. Hesser, M. Heiler, and S. C. E. Tosatto, “MANIFOLD: protein fold recognition based on secondary structure, sequence similarity and enzyme classification,” Protein Engineering, vol. 16, no. 11, pp. 785–9, 2003.
[15] H. Shen and K. Chou, “Ensemble classifier for protein fold pattern recognition,”Bioinformatics, vol. 22, no. 14, pp. 1717–1722, 2006. [16] O. Okun, “K-local hyperplane distance nearest-neighbor algorithm and
protein fold recognition,” Pattern Recognition and Image Analysis, vol. 16, no. 1, pp. 19–22, 2006.
[17] I. Dubchak, I. Muchnik, C. Mayor, I. Dralyuk, and S.-H. Kim, “Recog-nition of a protein fold in the context of the SCOP classification,”
PROTEINS: Structure, Function, and Genetics, vol. 35, pp. 401–7, 1999. [18] A. Chinnasamy, W. K. Sung, and A. Mittal, “Protein structure and fold prediction using tree-augmented na¨ıve Bayesian classifier,” inProc. Pac. Symp. Biocomputing. World Scientific, 2004, pp. 387–98.
[19] I.-F. Chung, C.-D. Huang, Y.-H. Shen, and C.-T. Lin, “Recognition of structure classification of protein folding by NN and SVM hierarchical learning architecture,” inICANN/ICONIP. Springer, 2003, pp. 1159–67. [20] C.-D. Huang, I.-F. Chung, N. R. Pal, and C.-T. Lin, “Machine learning for multi-class protein fold classification based on neural networks with feature gating,” inICANN/ICONIP. Springer, 2003, pp. 1168–75. [21] D. Voet and J. G. Voet,Biochemistry. John Wiley, 2004.
[22] H. Lodish, A. Berk, and P. Matsudaira,Molecular Cell Biology. W. H. Freeman, 2003.
[23] B. W¨agele, “Feature Transformationen f¨ur die Funktionsvorhersage auf Proteinen mittels Analyse der 3D Struktur,” Master’s thesis, Ludwig-Maximilians-Universit¨at M¨unchen/TU M¨unchen, 2005.
[24] I. H. Witten and E. Frank,Data Mining: Practical Machine Learning Tools and Techniques (2nd Edition). Morgan Kaufman, 2005.
[25] E. Ie, J. Weston, W. Noble, and C. Leslie, “Multi-class protein fold recognition using adaptive codes,” inProc. of the 22nd Int. Conf. on Machine learning (ICML 2005), L. D. Raedt and S. Wrobel, Eds. ACM Press, 2005, pp. 329–36.
[26] D. H. T. Jaakkola, M. Diekhans, “A discriminative framework for de-tecting remote protein homologies,”Journal of Computational Biology, vol. 7, no. 1-2, pp. 95–114, 2000.
[27] H. Rangwala and G. Karypis, “Profile based direct kernels for remote homology detection and fold recognition,” Bioinformatics, vol. 21, no. 23, pp. 4239–4247, 2005.
[28] T. Hastie and R. Tibshirani, “Classification by pairwise coupling,” in
Advances in Neural Information Processing Systems, vol. 10. The MIT Press, 1998.
[29] J. C. Platt,Fast training of support vector machines using sequential minimal optimization. MIT Press, 1999, pp. 185–208.
[30] S. Kiritchenko, “Hierarchical text categorization and its application to bioinformatics,” Ph.D. dissertation, School of Information Technology and Engineering, University of Ottawa, 2005.
[31] D. Koller and M. Sahami, “Hierarchically classifying documents using very few words,” inProc. 14th Int. Conf. on Machine Learning. Morgan Kaufmann, 1997, pp. 170–8.
[32] R. Greiner, A. Grove, and D. Schuurmans, “On learning hierarchical classifications,” 1997. [Online]. Available: http://www.cs.ualberta.ca/ ∼dale/papers/hier.ps.gz
[33] A. McCallum, R. Rosenfeld, T. M. Mitchell, and A. Y. Ng, “Improving text classification by shrinkage in a hierarchy of classes,” inProc. 15th Int. Conf. on Machine Learning. Morgan Kaufmann, 1998, pp. 359–67. [34] H. T. Ng, W. B. Goh, and K. L. Low, “Feature selection, perceptron learning, and a usability case study for text categorization,” inProc. 20th Annual Int. ACM SIGIR Conf. on Research and Development in Information Retrieval. ACM Press, 1997, pp. 67–73.
[35] M. E. Ruiz and P. Srinivasan, “Hierarchical text categorization using neural networks,”Inf. Retr., vol. 5, no. 1, pp. 87–118, 2002.
[36] A. S. Weigend, E. D. Wiener, and J. O. Pedersen, “Exploiting hierarchy in text categorization,”Inf. Retr., vol. 1, no. 3, pp. 193–216, 1999. [37] S. Dumais and H. Chen, “Hierarchical classification of web content,” in
Proc. 23rd Annual Int. ACM SIGIR Conf. on Research and Development in Information Retrieval. ACM Press, 2000, pp. 256–63.
[38] A. Sun, E.-P. Lim, and W. K. Ng, “Personalized classification for keyword-based category profiles,” in Proc. 6th European Conf. on Research and Advanced Technology for Digital Libraries. Springer, 2002, pp. 61–74.
[39] S. D’Alessio, M. Murray, R. Schiaffino, and A. Kershenbaum, “Cate-gory levels in hierarchical text categorization,” inProc. 3rd Conf. on Empirical Methods in Natural Language Processing (EMNLP-3), 1998. [40] S. Chakrabarti, B. Dom, R. Agrawal, and P. Raghavan, “Scalable feature selection, classification and signature generation for organizing large text databases into hierarchical topic taxonomies,”VLDB J., vol. 7, no. 3, pp. 163–78, 1998.
[41] L. Larkey, “Some issues in the automatic classification of U.S. patents,” inWorking Notes AAAI-98 Workshop on Learning for Text Categoriza-tion, 1998.
[42] L. Cai and T. Hofmann, “Hierarchical document categorization with support vector machines,” inProc. 13th ACM Int. Conf. on Information and Knowledge Management. ACM Press, 2004, pp. 78–87. [43] O. Dekel, J. Keshet, and Y. Singer, “Large margin hierarchical
classi-fication,” inProc. 21st Int. Conf. on Machine learning. ACM Press, 2004, pp. 209–16.
[44] J. Rousu, C. Saunders, S. Szedmak, and J. Shawe-Taylor, “Learning hierarchical multi-category text classification models,” inProc. 22nd Int. Conf. on Machine learning. ACM Press, 2005, pp. 744–51.
APPENDIX: CONSTRUCTION OF ADVERSE HIERARCHIES
In this appendix, we sketch how hierarchies that are “maxi-mally” different from existing hierarchies are constructed. The problem can be framed as a discrete optimization problem. We assume that the structure of the new hierarchy is identical to the structure of the given hierarchy. The goal is then to look for a new assignment of leaf classes, such that a scoring function is maximized.
For the definition of the scoring function, we use the same costs as for the cost-sensitive evaluation of our results (see the end of Section III.B): The distance between two leaf classes sharing a
common super-class in the original hierarchy is one, the distance between two classes sharing a common super-super-class is two, etc. A distance matrix is computed up-front for all pairs of leaf classes in the original hierarchy. The scoring function is then defined as the sum over all distances between pairs of leaf classes sharing a superclass in the new hierarchy.
We tested two stochastic approaches for the maximization of this score by assignments of leaf classes to the original hierarchical structure. In both cases, the starting point is a random permutation of the leaf classes. In the first variant, we “fill in” (i.e., assign) the leaf classes in the order of the random permuta-tion. In the second variant, the assignment is made greedily and in a more goal-oriented fashion: We assign the next leaf to the one super-class where the overall score is maximized. Although this step is done greedily, the whole procedure is still stochastic as it is based on a random sorting order of the leaf classes. Both approaches are repeated multiple times (depending on the dataset and the setting for 10 to 1,000 runs), and the overall maximum is chosen.