Procedia Engineering 118 ( 2015 ) 1162 – 1168
1877-7058 © 2015 Published by Elsevier Ltd. This is an open access article under the CC BY-NC-ND license (http://creativecommons.org/licenses/by-nc-nd/4.0/).
Peer-review under responsibility of organizing committee of the International Conference on Sustainable Design, Engineering and Construction 2015 doi: 10.1016/j.proeng.2015.08.459
ScienceDirect
International Conference on Sustainable Design, Engineering and Construction
Forecasting Short-term Electricity Demand in Residential Sector
Based on Support Vector Regression and Fuzzy-rough Feature
Selection with Particle Swarm Optimization
Hyojoo Son
a, Changwan Kim
a*
aDepartment of Arcitectural Engineeirng, Chung-Ang University, 84 Heukseok-ro, Dongjan-gu, Seoul, Korea
Abstract
The aim of this study is to provide a precise model for one-month-ahead forecast of electricity demand in residential sector. In this study, a total of 20 influential variables are taken into account including monthly electricity consumption, 14 weather variables, and 5 social variables. Based on support vector regression and fuzzy-rough feature selection with particle swarm optimization algorithms, the proposed method established a model with variables that relate to the forecast without ignoring some of these variables one may inevitably lead to forecasting errors. The proposed forecasting model was validated using historical data from South Korea. Its time period was from January 1991 to December 2012. The first 240 months were used for training and the remaining 24 for testing. The performance was evaluated using MAPE, MAE, RMSE, MBE, and UPA values. Furthermore, it was compared with that obtained from the artificial neural network, auto-regressive integrated moving average, multiple linear regression models, and the methods proposed in the previous studies, and found superior for every performance measure considered in this study. The proposed method has an advantage over the previous methods because it automatically determines appropriate and necessary variables for a reliable forecast. It is expected that the proposed model can contribute to more accurate forecasting of short-term electricity demand in residential sector. The ability to accurately forecast short -term electricity demand can assist power system operators and market participants in ensuring sustainable electricity planning decisions and secure electricity supply to the consumers. © 2015 The Authors. Published by Elsevier Ltd.
Peer-review under responsibility of organizing committee of the International Conference on Sustainable Design, Engineering and Construction 2015.
Keywords: Feature selection; Forecasting; Residential sector; Short-term electricity demand; Support vector regression
* Corresponding author. Tel.: +82-2-825-5726; fax: +82-2-812-4150. E-mail address: [email protected]
© 2015 Published by Elsevier Ltd. This is an open access article under the CC BY-NC-ND license (http://creativecommons.org/licenses/by-nc-nd/4.0/).
Peer-review under responsibility of organizing committee of the International Conference on Sustainable Design, Engineering and Construction 2015
1.Introduction
Short-term electricity demand forecasting plays a significant role in power system planning, including economic scheduling of generating capacity and scheduling of fuel p urchases, and power system management [1–8]. It is especially obvious that accurate electricity fo recasting has great importance to the residential sector, a major contributor to the peak loads in most electricity systems. Overestimating electricity demands misleads planners and wastes resources with expensive expansion plans. Such overestimation also increases operating costs, since electricity cannot be stored on a large scale unlike other energy sources [9,10]. But underestimation of electricity demands will result in failures and shortages [3]. Nevertheless, short-term electricity demand forecasting in the residential sector is a complex problem because its rise and fluctuation is caused by the difference in demand fro m month to month. In addition, the consumption is influenced by many nonlinear variables, such as weather conditions, economics, and demographics [11–14,3,15,7].
Several research studies have been conducted over the last decades to explore this comp lex problem of monthly electricity demand forecasting by means of multivariate time series analysis [16–32,7,33–35]. Several studies have assumed that the input and output series are stationary and applied statistical models [16,36,17,21–23,25,30,7]. However, real monthly electricity demand series as well as variables that may influence the electricity demand series have found to be stationary characteristic [17]. When one or more of the input and output series are have non-stationary characteristic, it is necessary to consider the sophisticated models which are capable of describing the nonlinear input and output series. In order to solve nonlinear time series problems, most research studies applied auto-regressive integrated moving average model [17,20] and artificial neural network model-based approaches [18,19,24,26,28,29,31–34]. The accuracy of the resulting models has ranged fro m 1.42% [34] to 10.98% [18] in terms of mean absolute percentage error. However, it is difficult to say whether these models have been sufficiently validated because the evaluation periods of the most research studies were within about ten years [18–20,29,31–34]. In addition, most of the previous studies have assumed that certain inputs among various weather variables and social variables have impact on the electricity demand series and fed these inputs to develop their models. A lthough some of selected variables may inevitably lead to forecasting errors, to our knowledge, there have been no research studies examining the method that can determine appropriate and necess ary variables for a reliab le forecast of monthly electricity demand in residential sector.
The aim of this study is to provide a precise model for one-month-ahead forecast of electricity demand in residential sector. Based on support vector regression and fuzzy-rough feature selection with particle swarm optimization algorithms, the proposed method automatically develops a forecasting model with variables that relate to the electricity demand series without ignoring some of these variables one may inevitably lead to forecasting errors. To evaluate the forecasting performance of the proposed method, we performed a co mprehensive co mparison of the prediction performance of the proposed method versus that of the artificial neural network, auto-regressive integrated moving average, multiple linear regression models, and the methods proposed in the previous studies. A data set covers the period fro m January 1991 to December 2012 was collected fro m South Korea and used for training and testing experiments. In Section 2, we present some materials on the proposed methodology. In Section 3, we described the data set and pre-processing. In Section 4, we present a discussion and analysis of the experimental results. Section 5 contains conclusions and suggestions for future research.
2.Methodolog y
2.1.Analysis steps
This study was conducted according to the procedure outlined in Fig. 1. In Step 1, support vector regression (SVR) and fu zzy-rough feature selection with particle swarm optimization (PSO) algorith ms were applied to select the most relevant variables fro m the 19 input variables. As a result, the nu mber of mu lti -dimensional input variab les was reduced. In Step 2, a forecasting model was developed by training the support vector regression model with the variables selected in the first step. In Step 3, the artificial neural network (ANN), auto-regressive integrated moving average (ARIMA), mu ltip le linear regression (MLR) models, and the methods proposed in the previous studies were trained. In Step 4, the forecasting performance of the ten models was compared.
Step 1: Select variables using
SVR and fuzzy-rough with
PSO algorithms
Step 2: Train SVR model with
selected variables
Step 3: Train ANN, ARIMA, MLR, and six models proposed in previous
studies
Step 4: Compare performance
between the proposed method and nine different
models
Fig. 1. Outline of procedure of the proposed method.
2.2.Support vector regression (SVR) and Fuzzy-rough feature selection with particle swarm optimization (PSO)
Monthly electricity demand has a cyclic trend caused by the difference in demand fro m month to month and season to season. Although the SVR model is capable of dealing with cyclic trend of time series, the application of SVR model has not yet been explored for the problem of electricity demand forecasting in residential sector [37]. In real applications in time series prediction, SVR algorithm has received extensive attention as a learning algorith m offering many theoretical advantages [38,39]. To build SVR-based forecasting model, feature selection and proper model parameter setting can improve the forecasting capability of SVR. In this study, under SVR formu lation, fuzzy-rough feature selection method [40] was adopted and modified to imp rove the forecasting capability of trained SVR model by searching and finding the optimal variable subset. This method is based on PSO algorithm which utilized fu zzy dependency degree as evaluation measure. The algorith m initiates by generating N numbers of particles randomly. Each particle indicates a s ubset of input variables. The best particles are obtained in all iterations and are called as global bests. Then, personal best of each particle is obtained and the best immediate neighbors for each particle are obtained. The velocity of the particle is updated and the position update rule is formu lated. The fitness of the particle is calculated and the termination condition is checked. Details of the fu zzy -rough feature selection method can be found in Cornelis and Gensen [41], Cornelis et al. [42], and Jensen and Shen [43] as well as details of the PSO algorithm can be found in Wang et al. [44] and Wang et al. [45].
The variables obtained by the SVR and fuzzy-rough with particle swarm optimization algorith ms in the feature selection step are passed to train SVR model for validation. With an RBF kernel, there are two parameters to be determined in the SVR model: the regularization parameter, C and the kernel parameter, Ɖ. In order to find the best (C, Ɖ) values, this study performed the “grid-search” approach proposed by Hsu et al. [46] and Wang et al. [47]. The grid search was performed as fo llo ws [46]: First, we selected a grid space with C (10-2, 10-1, …, 104, 105) and Ɖ (10-5, 10-4, …, 100, 101). Then, for each pair of C and Ɖ in this space, the RMSE was calculated for the test period. Finally, the pair (C, Ɖ) that yielded the smallest value of the RMSE was chosen, and that pair was used.
3.Data Set and Pre-processing
There are 20 related variables (as shown in Tab le 1) including monthly electricity consumption, 14 weather variables, and 5 social variables (economic and demographic factors). The co mprehensive list was developed fro m the literature [16–20,23–26,29–34]. The time period of data collection was January 1991 to December 2012. In this study, the monthly residential electricity consumption series and variab les that may influence the electricity demand are collected fro m the statistics published by the Korea Meteorological Ad min istration, Korean Statistical Information System, and Korea Energy Statistics Information System. In South Korea, monthly weather data was obtained from nine reg ional representative monitoring stations. Each mon itoring station was associated with a climate reg ion, and these climate reg ions represent areas of similar climate, and are therefore somewhat arbitrary. After data collection for 14 weather variables fro m each monitoring station, these 14 variab les were calcu lated by population-weighted average of the nine regions they represent. The reason why population has been selected as weighting factor is that climate influences the electric consumption through the response of people to weather. That is, depending on the coldness, or heat, of weather, people will increase or decrease the use of electric heating appliances or air conditioners. Thus, the higher the population, the higher the influence of weather conditions in electricity demand [12]. In other words, regional electricity demand is highly correlated with population [48]. Summary statistics are presented in Table 1.
T able 1. Summary statistics for the residential electricity consumption and 19 variables.
No. Variable name (Unit) Mean Std. deviation Minimum Maximum
1 Electricity consumption (MWh) 3,478,541.87 1,167,190.45 1,492,690.00 6,256,403.00 2* Mean temperature (°C) 13.40 9.11 -4.95 28.64 3* Maximum temperature (°C) 18.20 8.80 0.46 33.31 4* Minimum temperature (°C) 7.83 9.44 -9.84 23.77 5* Relative humidity (%) 63.47 8.50 45.04 82.66 6* Wind speed (m/s) 2.44 0.31 1.67 3.26 7* Rainfall (mm) 120.79 140.89 3.22 804.15 8* Daylight time (hr) 175.71 36.97 55.88 256.73
9* Global solar radiation (0.01MJ/m2) 38,151.02 11,000.99 16,889.65 63,613.40
10* Cooling degree days (degree-days) 10.47 24.46 0.00 147.09
11* Heating degree days (degree-days) 201.07 211.24 0.00 714.58
12* Total number of cooling degree days (degree-days)
10.29 24.49 0.00 147.09
13* T otal number of heating degree days (degree-days)
200.88 211.42 0.00 714.58
14* Vapor pressure (0.1hPa) 119.91 75.94 22.04 291.87
15* Air pressure (0.1hPa) 10,161.31 64.81 10,047.08 10,271.27
16 Real gross domestic product (billions of won)
191,076.33 44,693.43 103,141.20 273,719.10
17 Industrial production index 238.98 105.79 85.32 446.24
18 Population (million) 47,766.42 2,042.62 43,296.00 50,948.27
19 Consumer price index 165.60 36.28 100.00 228.97
20 Real electricity price (won/kWh) 47.32 5.88 38.10 69.53
Note. * indicates that it was calculated by population-weighted average of the nine regions they represent. Monthly data were interpolated assuming smooth changes from the quarterly data (real gross domestic product and population).
4.Results and Discussion
The performance of the proposed method was evaluated using the collected data set. The results obtained by the proposed method were co mpared with the results obtained by the artificial neural network, auto-regressive integrated moving average, multiple linear regression models, and the methods proposed in the previous studies. The experimental results are summarized in Table 2 and illustrated in Fig. 2. The first step of the procedure consisted of selecting the most relevant subset of variables fro m the set of 19 candidate variables. Based on support vector regression and fuzzy-rough feature selection with particle swarm optimization algorith ms, 11 variables including monthly electricity consumption, 8 weather variables, and 2 social variables were utilized for modeling the monthly electricity consumption. Shaded rows in bold text in Table 1 ind icate the selected variables by the proposed method for modeling the monthly electricity demand.
The performance was evaluated using mean absolute percentage error (MAPE), mean absolute error (MA E), root mean squared error (RMSE), mean bias error (M BE), and unpaired peak accuracy (UPA) values. MAE and RM SE values allow a term-by-term co mparison of the actual deviation between the forecasted value and actual value. Since the MAE and the RMSE are based on absolute errors, there is no absolute criterion for a “good” value for either of them. All that can be inferred fro m them is that the smaller the value of MA E or RM SE, the closer the pred icted values to the actual values. The MAPE, however, is scale independent, since it is based on relative errors; hence, it is more meaningful [49]. Positive and negative values of MBE repres ent overestimated and underestimated forecasted
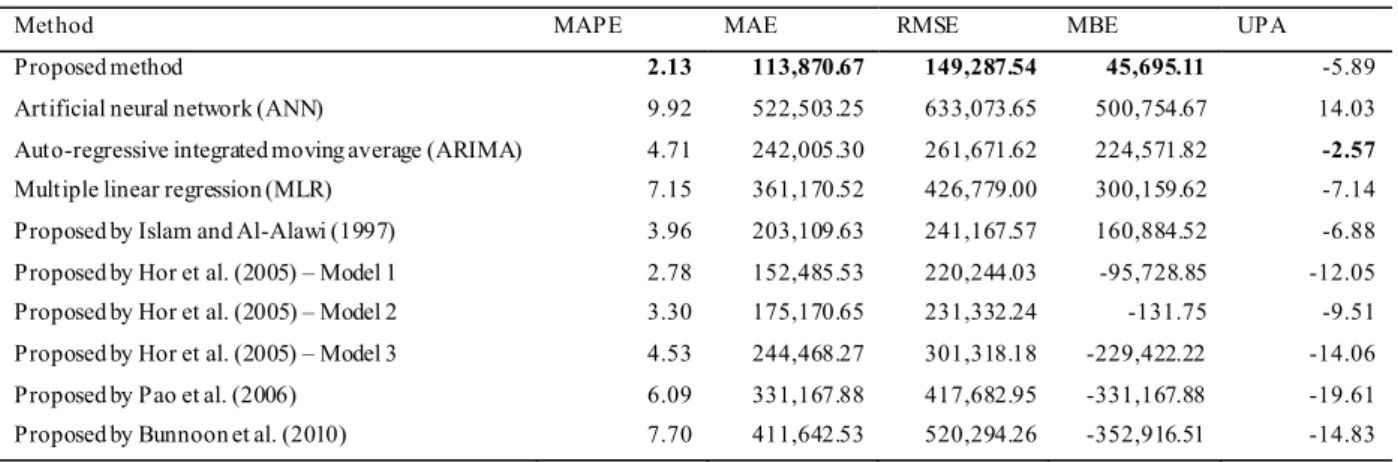
values, with a small value of MBE being desirable . The UPA value g ives a measure of model’s ability to capture peak demand, but does not pair the model forecasts with actual value in time or space. The perfo rmance statistics of the proposed model and nine different models are g iven in Table 3. The proposed method yields the highest performance among the ten models in terms o f MAPE, MA E, RM SE, and MBE values. At the peak point, the proposed method was ranked in the second position, yielding -5.89 in terms of UPA value. It means that the residential electricity demand at the peak point was underestimated by the proposed method with 5.89% error. T able 2. Comparison of ten different models.
Method MAPE MAE RMSE MBE UPA
Proposed method 2.13 113,870.67 149,287.54 45,695.11 -5.89
Artificial neural network (ANN) 9.92 522,503.25 633,073.65 500,754.67 14.03 Auto-regressive integrated moving average (ARIMA) 4.71 242,005.30 261,671.62 224,571.82 -2.57 Multiple linear regression (MLR) 7.15 361,170.52 426,779.00 300,159.62 -7.14 Proposed by Islam and Al-Alawi (1997) 3.96 203,109.63 241,167.57 160,884.52 -6.88 Proposed by Hor et al. (2005) – Model 1 2.78 152,485.53 220,244.03 -95,728.85 -12.05 Proposed by Hor et al. (2005) – Model 2 3.30 175,170.65 231,332.24 -131.75 -9.51 Proposed by Hor et al. (2005) – Model 3 4.53 244,468.27 301,318.18 -229,422.22 -14.06 Proposed by Pao et al. (2006) 6.09 331,167.88 417,682.95 -331,167.88 -19.61 Proposed by Bunnoon et al. (2010) 7.70 411,642.53 520,294.26 -352,916.51 -14.83 Note. T he values were rounded to four decimals places.
Graphical co mparison of the actual values (blue line) to the forecasted values (red line) by the proposed method fro m January 2011 to December 2012 is presented in Fig. 2. The time series of residential electricity consumption is also plotted in Fig. 2. The series presents a comp lex monthly and seasonal trends and strong fluctuations. Especially, these data exhibit a significant and persistent upward trend un til the end of 2012, main ly associated with the economic and demographic growth in the country. In addition, a cyclic annual pattern, which is correlated with the global climate changes throughout the year, is superimposed over these monthly and seasonal t rends. The amplitude of the collected values also reflects the different nu mber of days, working days, and holidays included in each month. The forecasted values (red line) by the proposed model are closer to the actual values. From the results, one could conclude that the forecasted values show relatively good agreement with the actual values and that the proposed method is feasible and reliable.
5.Conclusion
This study proposed a method to provide a precise model fo r one-month-ahead forecast of electricity demand in residential sector. The support vector regression and fuzzy-rough feature selection with particle swarm optimization algorith ms identified ten variables fro m a set of 19 candidate variables that may influence the electricity demand series and used to construct forecasting model. With fewer input variables, the proposed method was able to more accurately forecast the electricity demand in residential sector. Several interesting findings have been made in this study. Prior to this study there was relatively little understanding of feature selection method that significantly contribute the capability of electricity demand forecasting in residential sector. This study proposed the method that can identify relevant variab les for forecasting the electricity demand in residential sector with co mprehensive consideration of variables that may influence the electricity demand series. In addition, the empirical co mparison of the forecasting capability between the proposed method and the methods proposed in the previous studies c onfirmed that the proposed method is the best predictor of the monthly electricity demand in residential sector. Moreover, the proposed method has an advantage over the previous methods because it automatically determines appropriate and necessary variables for a reliab le forecast. It is expected that the proposed model can contribute to accurate forecasting of short-term electricity demand in residential sector. The ability to accu rately forecast short-term electricity demand can assist power system operators and market participants in ensuring sustainable electricity planning decisions and secure electricity supply to the consumers. This highly accurate forecasting method also has great potential for solving other forecasting problems in the construction industry.
Acknowledgements
This research was supported by Basic Science Research Program through the National Research Foundation of Korea (NRF) funded by the Ministry of Education (NRF-2013R1A1A 2A10058175).
References
[1] M.J. Thatcher, Modelling changes to electricity demand load duration curves as a consequence of predicted climate change for Australia, Energy 32 (2007) 1647–1659.
[2] V. Shrivastava, R.B. Misra, A novel approach of input variable selection for ANN based load forecasting, Proc. Joint Int. Conf. on Power System T echnology and IEEE Power India Conf., IEEE, New Delhi, India, 2008, pp. 1–5.
[3] K. Kavaklioglu, H. Ceylan, H.K. Ozturk, O.E. Canyurt, Modeling and prediction of T urkey’s electricity consumption using artificial neural
networks, Energy Conversion and Management 50 (2009) 2719–2727.
[4] H. Mao, X.-J. Zeng, G. Leng, Y.-J. Zhai, J.A. Keane, Short -term and midterm load forecasting using a bilevel optimization model, IEEE T ransactions on Power Systems 24 (2009) 1080–1090.
[5] J. Wang, W. Zhu, W. Zhang, D. Sun, A trend fixed on firstly and seasonal adjustment model combined with the ε–SVR for short-term forecasting of electricity demand, Energy Policy 37 (2009) 4901–4909.
[6] A. Azadeh, M. Saberi, A. Gitiforouz, An integrated simulation-based fuzzy regression-time series algorithm for electricity consumption estimation with non-stationary data, Journal of the Chinese Institute of Engineers 34 (2011) 1047–1066.
[7] F. Apadula, A. Bassini, A. Elli, S. Scapin, Relationships between meteorological variables and monthly electricity demand, Applied Energy 98 (2012) 346–356.
[8] X. Wang, Forecasting modeling and analysis of power engineering in China based on Gauss-Chebyshev formula, Systems Engineering Procedia 5 (2012) 131–136.
[9] H.R. Sadeghi Keyno, F. Ghaderi, A. Azade, J. Razmi, Forecasting electricity consumption by clustering data in o rder to decrease the periodic
variable’s effects and by simplifying the pattern, Energy Conversion and Management 50 (2009) 829–836.
[10] Z. Qiu, Electricity consumption prediction based on data mining techniques with particle swarm optimization, International Journal of Database T heory and Application 6 (2013) 153–164.
[11] H. Raman, N. Sunilkumar, Multivariate modelling of water resources time series using artificial neural networks, Hydrolo gical Sciences (40 (1995) 145–163.
[12] E. Valor, V. Meneu, V. Caselles, Daily air temperature and electricity load in Spain, Journal of Applied Meteorology 40 (2001) 1413–1421. [13] G. Altinay, E. Karagol, Electricity consumption and economic growth: Evidence from T urkey, Energy Economics 27 (2005) 849–856. [14] A. Aroonruengsawat, M. Auffhammer, Impacts of climate change on residential electricity consumption: Evidence from billing data,
National Bureau of Economic Research Conference Report, University of Chicago Press, Chicago, IL, pp. 311–342.
[15] L.G. Swan, V.I. Ugursal, Modeling of end-use energy consumption in the residential sector: A review of modeling techniques, Renewable and Sustainable Energy Reviews 13 (2009) 1819–1835.
[16] R.G. Quayle, H.F. Diaz, Heating degree day data applied to residential heating energy consumption, Journal of Applied Meteorology 19 (1980) 241–246.
[17] E.D. T serkezos, Forecasting residential electricitv consumption in Greece using monthly and quarterly data, Energy Econo mics (1992) 226–
232.
[18] S.M. Islam, S.M. Al-Alawi, K.A. Ellithy, Forecasting monthly electric load and energy for a fast growin utility using an artificial neural network, Electric Power Systems Research 34 (1995) 1–9.
[19] R.E. Abdel-Aal, A.Z. Al-Garni, Y.N. Al-Nassar, Modelling and forecasting monthly electric energy consumption in eastern Saudi Arabia using abductive networks, Energy 22 (1997) 911–921.
[20] S.M. Islam, S.M. Al-Alawi, Principles of electricity demand forecasting Part 2 Applications, Power Engineering Journal (1997) 91–95. [21] J.C. Lam, Climatic and economic influences on residential electricity consumption, Energy Conversion and Management 39 (1998) 623–629. [22] Y.Y. Yan, Climate and residential electricity consumption in Hong Kong, Energy 23 (1998) 17–20.
[23] C.-L. Hor, S.J. Watson, S. Majithia, Analyzing the impact of weather variables on monthly electricity demand, IEEE Transactions on Power Systems 20 (2005) 2078–2085.
[24] T. Yalcinoz, U. Eminoglu, Short term and medium term power distribution load forecasting by neural networks, Energy Conversion and Management 46 (2005) 1393–1405.
[25] S. Mirasgedis, Y. Sarafidis, E. Georgopoulou, D.P. Lalas, M. Moschovits, F. Karagiannis, D. Papakonstantinou, Models for mid-term electricity demand forecasting incorporating weather influences, Energy 31 (2006) 208–227.
[26] H.-T. Pao, Comparing linear and nonlinear forecasts for Taiwan’s electricity consumption, Energy 31 (2006) 2129–2141.
[27] G.K.F. T so, K.K.W. Yau, Predicting electricity energy consumption: A comparison of regression analysis, decision tree and neural networks, Energy 32 (2007) 1761–1768.
[28] J.C. Lam, H.L. T ang, D.H.W. Li, Seasonal variations in residential and commercial sector electricity consumption in Hong Kong, Energy 33 (2008) 513–523.
[29] P. Bunnoon, K. Chalermyanont, C. Limsakul, The comparison of mid term load forecasting between multi-regional and whole country area using artificial neural network, International Journal of Computer and Electrical Engineering 2 (2010) pp. 334–338.
[30] K. Pilli-Sihvola, P. Aatola, M. Ollikainen, H. T uomenvirta, Climate change and electricity consumption—Witnessing increasing or decreasing use and costs? Energy Policy 38 (2010) 2409–2419.
[31] N.R. Badurally Adam, M.K. Elahee, M.Z. Dauhoo, Forecasting of peak electricity demand in Mauritius using the non-homogeneous Gompertz diffusion process, Energy 36 (2011) 6763–6769.
[32] P.-C. Chang, C.-Y. Fan, J.-J. Lin, Monthly electricity demand forecasting based on a weighted evolving fuzzy neural network approach, Electrical Power and Energy Systems 33 (2011) 17–27.
[33] P. Bunnoon, The multi-point values of appropriate smoothing parameters λOpt. Of HP-filter for mid-term load forecasting based on neural
network, International Journal of Engineering and Technology 5 (2013) 3533–3543.
[34] P. Bunnoon, K. Chalermyanont, C. Limsakul, Multi-substation control central load area forecasting by using HP -filter and double neural networks (HP-DNNs), Electrical Power and Energy Systems 44 (2013) 561–570.
[35] Z. Chen, S. Yang, X. Wang, PLS-SVR optimized by PSO algorithm for electricity consumption forecasting, Applied Mathematics & Information Sciences 7 (2013) 331–338.
[36] L.M. Liu and D.M. Hanssens, Identification of multiple-input transfer function models, Communications in Statistics, Al1 (1982) 297–314. [37] W.-C. Hong, Electric load forecasting by seasonal recurrent SVR (support vector regression) with chaotic artificial bee colony algorithm,
Energy 36 (2011) 5568–5578.
[38] K.-R. Müller, A. Smola, G. Rätsch, B. Schölkopf, J. Kohlmorgen, V. Vapnik, Predicting time series with support vector machines, Proc. ICANN '97, Springer LNCS 1327, Berlin, Germany, 1997, pp. 999–1004.
[39] S.F. Crone, S. Lessmann, S. Pietsch, Forecasting with computational intelligence – An evaluation of support vector regression and artificial neural networks for time series prediction, Proc. 2006 Int. Joint Conf. on Neural Networks, IEEE, Vancouver, Canada, 2006, pp . 3159–3166. [40]] A. Moaref, V.S. Naeini, A particle swarm optimization based on a ring topology for fuzzy -rough feature selection, Proc. 2013 13th Iranian
Conf. on Fuzzy Systems, IEEE, Qazvin, Iran, 2013, pp. 1–6.
[41] C. Cornelis, R. Jensen, A noise-tolerant to fuzzy-rough feature selection, Proc. IEEE Int. Conf. on Fuzzy Systems, IEEE, Hong Kong, China, 2008, pp. 1398–1605.
[42] C. Cornelis, G.H. Martin, R. Jensen, D. Slezak, Feature selection with fuzzy decision reducts, Proc. 3rd Int. Conf. on Rough Sets and Knowledge, Chengdu, China, 2008, pp. 284–291.
[43] R. Jensen, Q. Shen, New approaches to fuzzy-rough feature selection, IEEE Transactions on Fuzzy Systems 17 (2009) 824–838.
[44] X. Wang, J. Yang, R. Jensen, X. Liu, Rough set feature selection and rule induction for prediction of malignancy degree in brain glioma, Computer Methods and programs in Biomedicine 83 (2006) 147–156.
[45] X. Wang, J. Yang, X. Teng, W. Xia, R. Jensen, Feature selection based on rough sets and particle swarm optimization, Pat tern Recognition Letters 28 (2007) 459–471.
[46] C.-W. Hsu, C.-C. Chang, C.-J. Lin, A practical guide to support vector classification. T echnical Report, National Taiwan University, Taipei, T aiwan, 2003.
[47] J. Wang, X. Wu, C. Zhang, Support vector machines based on K-means clustering for real-time business intelligence systems, International Journal of Business Intelligence and Data Mining 1 (2005) 54–64.
[48] D.J. Sailor, J.R. Munoz, Sensitivity of electricity and natural gas consumption to climate in the U.S.A. – Methodology and results for eight states, Energy 22 (1997) 987–998.