R E S E A R C H A R T I C L E
Open Access
A cluster analysis of chronic obstructive
pulmonary disease in dusty areas cohort
identified three subgroups
Suhyun Kim
1, Myoung-Nam Lim
2, Yoonki Hong
3, Seon-Sook Han
3, Seung-Joon Lee
3and Woo Jin Kim
3*Abstract
Background:Chronic obstructive pulmonary disease (COPD) is a heterogeneous disease with variable clinical manifestations, structural changes, and treatment responses. In a cohort study, we performed a baseline cluster analysis to identify the subgroups of COPD and to assess the clinical outcomes of each subgroup during a 1-year follow-up.
Methods:We analyzed dusty areas cohort comprising 272 patients with COPD. The main factors with the highest
loading in 15 variables were selected using principal component analysis (PCA) at baseline. The COPD patients were classified by hierarchical cluster analysis using clinical, physiological, and imaging data based on PCA-transformed data. The clinical parameters and outcomes during the 1-year follow-up were evaluated among the subgroups.
Results:PCA revealed that six independent components accounted for 77.3% of variance. Three distinct subgroups
were identified through the cluster analysis. Subgroup 1 included younger subjects with fewer symptoms and mild airflow obstruction, and they had fewer exacerbations during the 1-year follow-up. Subgroup 2 comprised subjects with additional symptoms and moderate airflow obstruction, and they most frequently experienced exacerbations requiring hospitalization during the 1-year follow-up. Subgroup 3 included subjects with additional symptoms and mild airflow obstruction; this group had more female patients and a modest frequency of exacerbations requiring hospitalization.
Conclusions:Cluster analysis using the baseline data of a COPD cohort identified three distinct subgroups with different clinical parameters and outcomes. These findings suggest that the identified subgroups represent clinically meaningful subtypes of COPD.
Keywords:Chronic pulmonary obstructive disease, Phenotypes, Dusty areas
Background
A recent consensus definition proposed that a chronic ob-structive pulmonary disease (COPD) phenotype is “a single or combination of disease attributes that describe differences between individuals with COPD as they relate to clinically meaningful outcomes (symptoms, exacerba-tions, response to therapy, rate of disease progression, or death)”[1]. COPD heterogeneity has been broadly charac-terized as an emphysema- and airway-predominant
disease, and some of these phenotypes, such as upper lobe-predominant emphysema and the “frequent exacer-bator” subtype, have important consequences for clinical management [2–4]. Other factors, including low body mass index (BMI), severity of symptoms, and quality of life, are also important in COPD [1]. Clinical management in accordance with the subtype will improve the outcomes.
We hypothesized that the COPD cohort of Korea comprises discrete groups of subjects with different clinical characteristics associated with different outcomes. To test this hypothesis, we used clustering to identify COPD subgroups and then determined the relationships
among pulmonary function decline, exacerbation
* Correspondence:[email protected]
3Department of Internal Medicine and Environmental Health Center, Kangwon National University, Chuncheon, Korea
Full list of author information is available at the end of the article
frequency, and progression of symptoms over 1 year. Some of the results of this study have been previously re-ported in the form of abstracts [5].
Methods
Study design and data collection
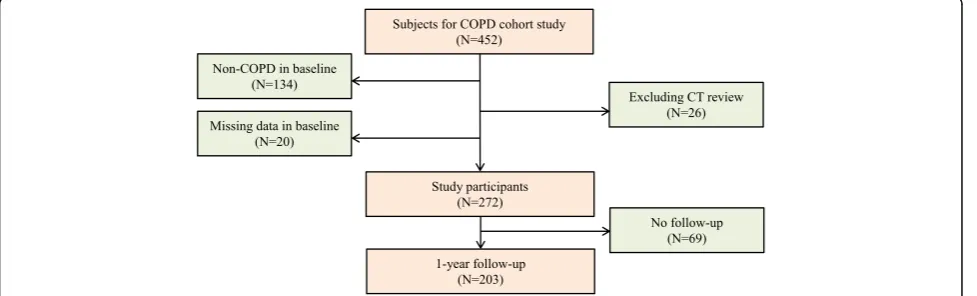
Data from a cohort comprising 272 patients diagnosed with COPD, who were residing in dusty areas in Korea, were analyzed. Patients were selected from a Korean COPD cohort, which was developed to observe the lon-gitudinal outcomes of COPD subjects living near cement plants. The methods for recruiting patients with COPD in dusty areas (CODA) cohort have been published pre-viously [6]. Briefly, the inclusion criteria for COPD were age > 40 years and post-salbutamol forced expiratory volume in 1 s/forced vital capacity (FEV1/FVC) <0.7. We excluded subjects with bronchiectasis and lung dam-age caused by tuberculosis. Initially, 272 patients were selected from 452 subjects living near cement plants, and 203 patients who completed the 1-year follow-up were included for outcome analysis (Fig. 1). All patients were evaluated at enrollment using a medical interview, physical examination, spirometry, laboratory tests, and computed tomography (CT) scan. The initial question-naire included demographics, disease history, residence location, environmental exposure, and self-reported exacerbation history. Exacerbations were defined as follows: hospitalization with systemic steroids and/or an-tibiotics due to worsening symptoms (dyspnea, cough, or sputum) or medication change with steroid medica-tion and/or antibiotics at the outpatient clinic [7]. The intensity and duration of respiratory symptoms, such as cough, sputum, dyspnea, and wheezing, were evaluated. Dyspnea was evaluated using the modified Medical Research Council Dyspnea (mMRC) scale. Health-related quality of life was evaluated by calculating the total score on the patient-reported COPD assessment test (CAT). Patients were questioned regarding their his-tory of direct exposure to biomass using the following
question: “For cooking and/or heating, have you ever been exposed to fuels such as wood and charcoal?” Posi-tive exposure to biomass was defined as direct exposure for 10 years.
The volumetric CT scans were performed using a method reported in previous studies [7, 8], as summa-rized below. Volumetric CT scans were taken at full inspiration and expiration using a first-generation
dual-source CT system (Somatom Definition, Siemens
Healthcare, Forchheim, Germany). Whole-lung images were extracted automatically using in-house software, and the attenuation coefficient of each pixel was calcu-lated. From the CT data, the volume fraction (%) of the lung below −950 Hounsfield Unit at full inspiration was calculated automatically (emphysema index, EI). The ratio of mean lung density on expiration and inspiration was calculated. Airway dimensions, including wall area (WA), lumen area, and WA% (ie, WA/[WA + lumen area] × 100), were measured near the origin of the right apical and left apico-posterior segmental bronchi. To identify the extent of emphysema and changes in airway disease quantitatively, we employed the most frequently used methods, the EI for emphysema extent, and WA% to assess airway disease [9, 10].
This study adhered to the clinical practice guidelines and tenets of the Declaration of Helsinki. It has been ap-proved by the Institutional Review Board of Kangwon National University Hospital (KNUH) 2012–06-007. All participants provided written informed consent.
Patients were classified into “ABCD” categories ac-cording to their respiratory symptoms as per the mMRC and CAT scores and according to their future risk due to either a recent history of COPD exacerbation or pre-dicted FEV1%, as recommended by the Global Initiative for Chronic Obstructive Lung Disease (GOLD) [11].
Statistical analysis
The main factors with the highest loading in 15 variables were selected using principal component analysis (PCA)
at baseline. COPD patients were classified through hier-archical cluster analysis using clinical, physiological, and imaging data based on PCA-transformed data. The clin-ical parameters and outcomes during the 1-year follow-up were evaluated among the subgrofollow-ups.
Factor analysis was performed using the following var-iables: body mass index (BMI), cigarette smoking amount, mMRC score, CAT score, white blood cells (WBCs) with polymorphonuclear neutrophils (PMNs), eosinophils, interleukin (IL)-6, C-reactive protein (CRP), uric acid, EI, FEV1, FVC, and FEV1/FVC. In order to select the number of important factors, we chose values that has a factor loading greater than 0.6 and a eigenvalue was greater than 1. Oblimin method was used in the square rotation. The similarity of data was calculated using the principal factors that were identified by PCA-transformed data. We per-formed a hierarchical cluster analysis using Ward’s method with squared Euclidean distance based on the similarity of data by factor analysis score. We then compared the baseline characteristics and changes after 1 year in FEV1, mMRC and CAT scores, and
ex-acerbations according to the subgroups derived
through the cluster analysis and 2011 GOLD COPD grouping system. Quantitative variables were com-pared using an analysis of variance model, and quali-tative variables were compared using the chi-square test (SAS ver. 9.3, Cary, NC). All analyses were per-formed with the level of significance set at p< 0.05.
Results
Factor analysis and cluster analysis for the identification of COPD subgroups
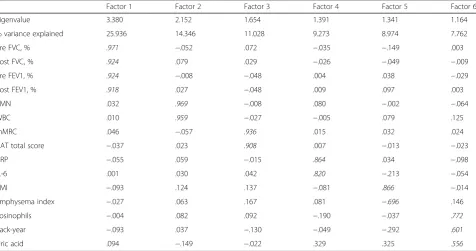
The Kaiser–Meyer–Olkin (KMO) value was 0.593, and the p-value of Bartlett’s test of sphericity was <0.001 (p = 0.000). KMO index for each variable was more than 0.5 except that index for uric acid was 0.500. The six factors that significantly contributed to explaining the relationships among the 15 variables accounted for 77.3% of the information. The following representative variables were chosen based on relatively high factor loading: pre- and post-bronchodilator FEV1% and FVC% (for factor 1); WBCs with PMNs (for factor 2); mMRC and total CAT scores (for factor 3); CRP and IL-6 values (for factor 4); BMI and EI (for factor 5); and eosinophils, cigarette smoking amount, and uric acid (for factor 6) (Table 1 and Additional file 1: Table S1). After excluding uric acid, the results were similar.
Basal characteristics of COPD subgroups
Three distinct subgroups were identified using the clus-ter analysis (Table 2). Subgroup 1 included the youngest patients, with a mean age of 70.2 years having mild air-flow obstruction. Their mMRC and CAT scores were the best, and they had the lowest values of IL-6 and CRP. Subgroup 2 comprised more male patients and had the oldest patients, with a mean age of 76.6 years having more severe airflow obstruction. Their mMRC and CAT scores were the worst, and their pre- and
post-Table 1Correlations of the 15 original variables with the six main factors derived from the factor analysis in the 272 COPD subjects
Factor 1 Factor 2 Factor 3 Factor 4 Factor 5 Factor 6
Eigenvalue 3.380 2.152 1.654 1.391 1.341 1.164
% variance explained 25.936 14.346 11.028 9.273 8.974 7.762
Pre FVC, % .971 −.052 .072 −.035 −.149 .003
Post FVC, % .924 .079 .029 −.026 −.049 −.009
Pre FEV1, % .924 −.008 −.048 .004 .038 −.029
Post FEV1, % .918 .027 −.048 .009 .097 .003
PMN .032 .969 −.008 .080 −.002 −.064
WBC .010 .959 −.027 −.005 .079 .125
mMRC .046 −.057 .936 .015 .032 .024
CAT total score −.037 .023 .908 .007 −.013 −.023
CRP −.055 .059 −.015 .864 .034 −.098
IL-6 .001 .030 .042 .820 −.213 −.054
BMI −.093 .124 .137 −.081 .866 −.014
Emphysema index −.027 .063 .167 .081 −.696 .146
Eosinophils −.004 .082 .092 −.190 −.037 .772
Pack-year −.093 .037 −.130 −.049 −.292 .601
Uric acid .094 −.149 −.022 .329 .325 .556
FEV1forced expiratory volume in one second,FVCforced vital capacity,PMNpolymorphonuclear neutrophil,mMRCmodified Medical Research Council Dyspnea Scale,CATCOPD Assessment Test,BMIbody mass index
bronchodilator FEV1% and FVC% were the most severe among the three clusters. Nearly 90% of these patients had a history of smoking, the BMI values were the low-est, and the IL-6 and CRP values were the highest. In
addition, they had the most severe emphysema, as deter-mined from the CT scan. Subgroup 3 comprised more female patients with mild airflow obstruction and mod-est mMRC and CAT scores. More than 40% of the
Table 2Baseline characteristics of 272 COPD subjects according to the three subgroups
Total 1(n= 158) 2(n= 48) 3(n= 66) p-value†
Demographics
Gender, Male 217(79.8) 129(81.7) 43(89.6) 45(68.2) 0.0129
Age 72.8 ± 7.3 70.2 ± 6.9 76.6 ± 4.8 75.5 ± 6.7 <.0001
Smoking 0.0005
Current 72(26.5) 50(31.6) 13(27.1) 9(13.6)
Former 128(47.0) 69(43.7) 30(62.5) 29(43.9)
Never 72(26.5) 39(24.7) 5(10.4) 28(42.4)
Pack-year 17.8 ± 22.8 18.5 ± 23.3 22.9 ± 22.2 12.7 ± 19.0 0.0468
BMI 23.1 ± 3.2 23.0 ± 2.7 21.9 ± 3.3 24.6 ± 3.3 <.0001
Height 160.1 ± 8.6 160.9 ± 8.5 160. 7 ± 7.8 157.7 ± 9.1 0.0311
Biomass exposure 95(35.5) 62(40.0) 16(34.0) 17(25.8) 0.1254
Physiology
Stage <.0001
Mild 147(54.4) 88(55.7) 8(16.7) 52(78.8)
Moderate 108(39.7) 65(41.1) 29(60.4) 14(21.2)
Severe 16(5.9) 5(3.2) 11(22.9) 0(0.0)
Pre FEV1, L 1.72 ± 0.57 1.87 ± 0.54 1.34 ± 0.48 1.82 ± 0.53 <.0001
Pre FEV1, % 75.7 ± 20.7 77.8 ± 18.5 60.9 ± 16.5 88.4 ± 18.2 <.0001
Pre FEV1/FVC 59.8 ± 9.0 61.5 ± 8.2 53.9 ± 9.4 61.4 ± 8.2 <.0001
Post FEV1, L 1.82 ± 0.56 1.98 ± 0.51 1.45 ± 0.48 1.89 ± 0.53 <.0001
Post FEV1, % 79.8 ± 19.7 82.3 ± 16.7 65.9 ± 17.5 91.4 ± 17.3 <.0001
PostFEV1/FVC 58.8 ± 8.4 60.3 ± 7.4 52.8 ± 9.6 61.2 ± 6.1 <.0001
FEV1, reversibility% 52(19.1) 29(18.4) 10(20.8) 13(19.7) 0.9207
Emphysema index(%) 7.7 ± 7.3 6.6 ± 5.3 15.7 ± 10.0 4.1 ± 4.1 <.0001
Mean wall area of Airway(%) 69.4 ± 5.0 69.0 ± 5.3 69.1 ± 4.4 70.0 ± 4.7 0.3535
Symptoms
mMRC 1.49 ± 1.15 0.85 ± 0.80 2.48 ± 1.01 2.18 ± 1.02 <.0001
0/1/2/3/4 55/112/46/43/16 52/87/13/3/3 2/6/13/21/6 1/19/20/19/7 <.0001
CAT total 17.3 ± 9.6 12.5 ± 7.9 26.3 ± 7.5 21.5 ± 8.4 <.0001
Comorbidities
Diabetes mellitus 42(15.7) 27(17.4) 8(17.4) 7(10.6) 0.1147
MI 11(4.3) 5(3.3) 1(2.3) 5(7.8) 0.0885
Heart failure 3(1.1) 1(0.7) 1(2.1) 1(1.5) 0.6696
Cerebrovascular 4(1.5) 0(0.0) 2(4.3) 2(3.0) 0.5035
Peptic ulcer 23(8.6) 14(9.0) 4(8.5) 5(7.6) 0.5848
Systemic inflammation index
IL-6 2.6 ± 3.7 2.0 ± 3.2 4.7 ± 5.1 2.4 ± 2.7 <.0001
IL-8 16.8 ± 17.8 15.4 ± 16.7 20.5 ± 24.7 17.4 ± 14.5 0.2154
CRP 0.3 ± 0.6 0.1 ± 0.2 0.7 ± 1.2 0.2 ± 0.3 <.0001
mMRCmodified Medical Research Council Dyspnea Scale,MIMyocardial infarction
patients in this group were never-smokers, and their pre-and post-bronchodilator FEV1%, FVC%, pre-and BMI were the best. The extent of emphysema in subgroup 3 was the lowest among the three clusters. However, biomass expos-ure among the three clusters was the same. In addition, the incidence of comorbidities, including diabetes, cardio-vascular, cerebrocardio-vascular, and peptic ulcer disease, and the mean WAs of the airways from the volumetric CT scans, were the same among the three clusters. The proportion of bronchodilator responders who showed >200 mL and >12% increases in FEV1 with bronchodilators was ap-proximately 20% in the three clusters.
COPD subgroups according to the GOLD“ABCD” classification
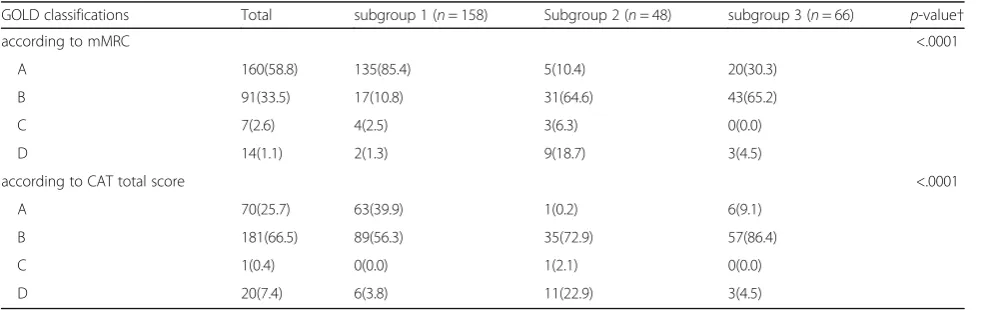
The GOLD“ABCD” categories according to the respira-tory symptoms as per the mMRC and CAT scores were different (Table 3). The classification into GOLD “ABCD”categories as per the mMRC scores resulted in most patients being placed in the A group (58.8%, 35.5%, 2.6%, and 1.1% for the A, B, C, and D groups, re-spectively), whereas as per the CAT scores, most patients were placed in the B group (25.7%, 66.5%, 0.4%, and 7.4%, for the A, B, C, and D groups, respectively). When classified according to the CAT scores, subgroup 1 had less symptoms (39.9% in the A and C groups) and less severe diseases (96.2% in the A and B groups), according to the GOLD classification. Most of the patients (95.8%) in subgroup 2 had additional symptoms (the B and D groups), and 25% had more severe diseases (the C and D groups), according to the GOLD classification. A total of 90.9% of the patients in subgroup 3 had additional symptoms (the B and D groups, especially 86.4% in group B), according to the GOLD classification.
Follow-up data of the three COPD subgroups
One-year follow-up data were available for 203 subjects (Additional file 1: Table S2 and Table 4). During the
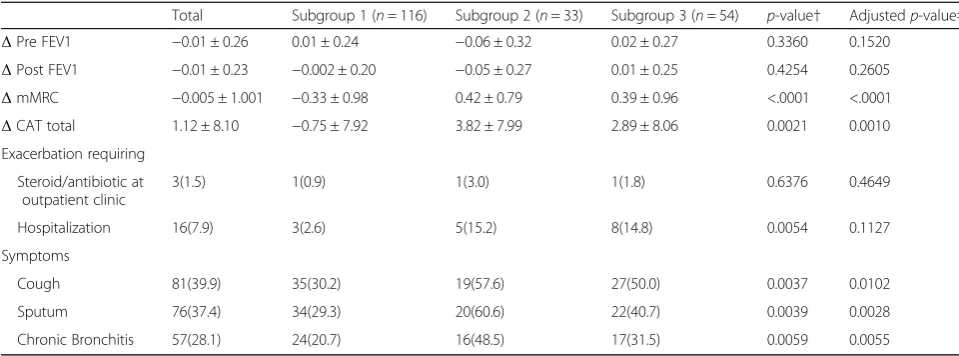
1-year follow-up, 2.6% of patients in subgroup 1 experi-enced exacerbations requiring hospitalization, and they exhibited no decline of FEV1. They had few symptoms at the 1-year follow-up; only 30% complained of cough or sputum production, and their mMRC or CAT scores were not aggravated. Patients in subgroup 2 and 3 experienced more frequent exacerbations requiring hospitalization (15.2% and 14.8% respectively). Patients in subgroup 2 showed the most rapid decline of FEV1 (60 mL) although the result was not statistically signifi-cant. Patients in subgroup 2 showed the greatest wors-ening of symptom scores, both in terms of mMRC and CAT scores. Subgroup 3 had modest exacerbations re-quiring hospitalization (14.8%), which was significantly higher than the other mild disease group (subgroup 1), and modest symptoms, with symptom progression ac-cording to the mMRC and CAT scores; however, there was no decline in FEV1.
Discussion
In this study, we identified three distinct subgroups of COPD through a cluster analysis of 272 patients with CODA cohort. We also demonstrated that the frequency of exacerbations requiring hospitalization, progress of respiratory symptoms, and changes in the mMRC and CAT scores in 1 year varied among these subgroups. Among the three subgroups, subjects with mild COPD were divided into two subgroups (subgroups 1 and 3), according to the number of symptoms. According to the GOLD classification of airflow limitation severity (based on post-bronchodilator FEV1), subgroup 1 (mild disease group) included younger patients who had fewer symp-toms, and subgroup 3 (the other mild disease group) in-cluded a majority of female patients with more respiratory symptoms. However, subgroup 3 reported more exacerbations requiring hospitalization and more symptom progression during the 1-year follow-up than subgroup 1. Subgroup 2 (moderate disease group)
Table 3COPD subgroups according to the GOLD“ABCD”classification
GOLD classifications Total subgroup 1 (n= 158) Subgroup 2 (n= 48) subgroup 3 (n= 66) p-value†
according to mMRC <.0001
A 160(58.8) 135(85.4) 5(10.4) 20(30.3)
B 91(33.5) 17(10.8) 31(64.6) 43(65.2)
C 7(2.6) 4(2.5) 3(6.3) 0(0.0)
D 14(1.1) 2(1.3) 9(18.7) 3(4.5)
according to CAT total score <.0001
A 70(25.7) 63(39.9) 1(0.2) 6(9.1)
B 181(66.5) 89(56.3) 35(72.9) 57(86.4)
C 1(0.4) 0(0.0) 1(2.1) 0(0.0)
D 20(7.4) 6(3.8) 11(22.9) 3(4.5)
included subjects with additional respiratory symptoms; this group had more frequent exacerbations requiring hospitalization during the 1-year follow up than sub-group 1 did.
There have been several reports on the various pheno-types of COPD in Western countries in order to identify more homogeneous subgroups [12–16]; however, there have been few of such reports from Asian countries [17]. In the Korean Obstructive Lung Disease (KOLD) cohort, three clusters with the following phenotypes were identi-fied: cluster 1 included subjects with moderate-to-severe airflow obstruction and bronchodilator reversibility, cluster 2 included subjects with moderate airflow ob-struction without bronchodilator reversibility, and clus-ter 3 included subjects with severe airflow obstruction without bronchodilator reversibility [17]. In the KOLD cohort, in terms of risk factors, cluster 3 patients showed more severe airflow obstruction and hyperinflation, had greater emphysematous change in the CT scan, and smoked less [17]. Conversely, in the present study, cu-mulative smoke exposure (pack-years) was the highest in subgroup 2 (moderate disease group with additional symptoms) compared with the milder subgroups. How-ever, the three subgroups of the present study had a similar biomass exposure, which has previously been re-ported to result in phenotypic differences [18]. Hong et al. suggested that the airway phenotype of COPD was more common in females, and females are more suscep-tible to the damaging effects of biomass smoke, thereby leading to the development of airway disease [8]. In the present study, subgroup 3 included more female pa-tients, a large number of never-smokers, and a small percentage of emphysema cases; however, they showed no differences in airway wall thickness or biomass smok-ing history. Cho et al. used clinical and genetic charac-teristics to cluster patients with COPD in the National
Emphysema Treatment Trial Genetics Ancillary Study cohort with severe emphysema: 1) emphysema predom-inance, 2) milder severity and bronchodilator responsive-ness, 3) discordant lung function/CT emphysema and airway severity, and 4) airway predominance [14]. In the present study, subgroup 2 exhibited severe emphysema and the lowest FEV1, and approximately 20% of the pa-tients were bronchodilator responders; this value was not different among the three subgroups. Furthermore, no difference in airway wall thickness was observed among the subgroups. Regarding the 1-year follow-up, an average of 60 mL of FEV1 decline was noted in sub-group 2, but this value was not significantly different among the subgroups. However, the mMRC and CAT scores improved only in subgroup 1, which exhibited fewer symptoms, such as cough, sputum production, and chronic bronchitis, during the 1-year follow-up. The PCA variables were the ones that changed differently according to subgroups. This may have influenced the results. For example, FEV1, was included in the PCA variables, and patient with better lung function showed more lung function decline in the previous report [19]. However, subgroup 2, which have worse lung function showed more decline in the current study. We did not compare the treatment history; therefore, we could not identify which subgroup would benefit from bronchodi-lators and/or inhaled corticosteroid (ICS) treatment. Lee et al. suggested that the response to long-acting beta2-agonist and ICS treatment varied with the COPD subtype, and the obstruction-dominant COPD patients
exhibited the best response compared with the
emphysema-dominant patients who had the worst re-sponse [20].
Most recently, Castaldi et al. evaluated 10,192 subjects from the COPD Gene cohort: (1) relatively smoking-resistant individuals, (2) individuals with mild upper
Table 4The differences between baseline and one-year follow-up among the three subgroups (n= 203)
Total Subgroup 1 (n= 116) Subgroup 2 (n= 33) Subgroup 3 (n= 54) p-value† Adjustedp-value‡ ΔPre FEV1 −0.01 ± 0.26 0.01 ± 0.24 −0.06 ± 0.32 0.02 ± 0.27 0.3360 0.1520
ΔPost FEV1 −0.01 ± 0.23 −0.002 ± 0.20 −0.05 ± 0.27 0.01 ± 0.25 0.4254 0.2605 ΔmMRC −0.005 ± 1.001 −0.33 ± 0.98 0.42 ± 0.79 0.39 ± 0.96 <.0001 <.0001 ΔCAT total 1.12 ± 8.10 −0.75 ± 7.92 3.82 ± 7.99 2.89 ± 8.06 0.0021 0.0010 Exacerbation requiring
Steroid/antibiotic at outpatient clinic
3(1.5) 1(0.9) 1(3.0) 1(1.8) 0.6376 0.4649
Hospitalization 16(7.9) 3(2.6) 5(15.2) 8(14.8) 0.0054 0.1127
Symptoms
Cough 81(39.9) 35(30.2) 19(57.6) 27(50.0) 0.0037 0.0102
Sputum 76(37.4) 34(29.3) 20(60.6) 22(40.7) 0.0039 0.0028
Chronic Bronchitis 57(28.1) 24(20.7) 16(48.5) 17(31.5) 0.0059 0.0055
†pvalues correspond to comparisons between the 3 subgroups using Chi-square test or ANOVA, as appropriate
zone-predominant emphysema and airflow obstruction, (3) individuals with airway-predominant disease, and (4) individuals with severe obstruction and emphysema [4]. These clusters were strongly associated with known COPD-associated variants [21]. The COPD Gene study reported that the severe subgroup had older and more male patients, and the severe emphysema group showed the most frequent exacerbations and the worst symp-toms [4]. This was similar to our study in that the sub-group with a relatively severe stage of disease and additional symptoms (subgroup 2) showed the most se-vere emphysema and the most frequent exacerbations. In addition, this subgroup had more male and relatively older patients, the lowest BMI, and the highest IL-6 and CRP values compared with the mild disease subgroups.
Garcia-Aymerich identified three clusters in 342 pa-tients who were hospitalized for the first time because of an exacerbation of COPD and proposed clinically rele-vant COPD subtypes [13]. Interestingly, these three clus-ters relatively correspond to our subgroups in terms of their clinical features and follow-up outcomes, such as subsequent hospitalizations. According to the ‘ Pheno-type and Course of COPD (PAC-COPD)’ study group [13], one cluster displayed the worst status in most of the respiratory domains of the disease, such as exercise capacity, more frequent hospitalizations due to COPD, and the highest all-cause mortality; these features corres-pond well with our subgroup 2. The remaining two clus-ters of the PAC-COPD study group were characterized by a milder respiratory status, which closely resembles our subgroups 1 and 3; one subtype of the milder clus-ters had a higher prevalence of obesity, cardiovascular disease, diabetes and higher levels of systemic inflamma-tory markers. In the present study, however, the more severe stage group (subgroup 2) showed the highest IL-6 and CRP values but the lowest BMI, whereas the incidences of comorbidities was not different among the three clusters.
The present study included patients with relatively mild stages of COPD. The mild-severity group was di-vided into two subgroups according to the symptoms. The subgroup with additional symptoms, among the subjects with mild airway obstruction, experienced more exacerbations, requiring hospitalization during the 1-year follow-up. These findings may provide an important understanding of COPD phenotypes in terms of progno-sis of symptoms and may also demonstrate the import-ance of the early management of COPD [22]. Moreover, the results of the present study suggest that the COPD classification system of the Korean COPD guideline is reasonable for the prediction of disease prognosis in Korean COPD patients. The Korean guideline classified the COPD patients into three groups, combining the GOLD C and D groups into one group (group “da”)
[23]. In the present study, the subgroup with additional symptoms and a relatively severe stage of disease (sub-group 2) showed the most frequent exacerbations requiring hospitalization and the most progressive symp-toms, according to the mMRC and CAT scores. Subgroup 2 mostly met the criteria for group B; how-ever, 25% of them showed features of groups C and D, according to the GOLD classification. Subgroup 1 in-cluded the youngest patients with mild symptoms and mild severity; this group seldom had acute exacerbations or symptom progression. Subgroup 1 mostly met the cri-teria for group B, but 40% showed group A characteris-tics, according to the GOLD classification. Subgroup 3 included more female patients with a lower smoking history and showed the mild severity but with more symptoms and acute exacerbations than subgroup 1 did. Subgroup 3 exclusively included group B patients, ac-cording to the GOLD classification.
additional long-term follow-up and multinational studies using exposure metrics are warranted.
Conclusions
Three distinct subgroups were identified using a cluster analysis of dusty areas cohort in Korea. Subgroup 1 sub-jects were younger, and they exhibited fewer symptoms with mild airway obstruction and fewer exacerbations during the 1-year follow-up. Subgroup 2 subjects had moderate airway obstruction, more severe respiratory symptoms, and the most frequent exacerbations requiring hospitalization during the 1-year follow-up. Subgroup 3, which included more female patients, experienced more symptoms, with mild airway obstruction and more frequent exacerbations requiring hospitalization than the other mild disease subgroup (subgroup 1).
Additional file
Additional file 1:A cluster analysis of chronic obstructive pulmonary disease in dusty areas cohort identified three subgroups. The Additional file 1 contains two additional tables of study data results:Table S1. Correlation structure of the variables.Table S2.Follow-up demographics of 203 COPD subjects according to the three subgroups. (DOCX 29 kb)
Abbreviations
BMI:Body mass index; CAT: COPD assessment test; CODA: COPD in dusty areas; COPD: Chronic obstructive pulmonary disease; FEV1: Forced expiratory volume in 1 s; FVC: Forced vital capacity; GOLD: Global Initiative for Chronic Obstructive Lung Disease; ICS: Inhaled corticosteroid; KOLD: Korean Obstructive Lung Disease; mMRC: Modified Medical Research Council Dyspnea scale; PCA: Principal component analysis; PMN: Polymorphonuclear neutrophil
Acknowledgements
We thank Seul Kee Kim for technical assistance.
Funding
This study was supported by a grant from the Ministry of Environment, Republic of Korea (Environmental Health Center of Kangwon National University Hospital).
Availability of data and materials
The datasets used and/or analysed during the current study are available from the corresponding author on reasonable request.
Notation of prior abstract publication/presentation
The abstract was submitted and presented at the“Asian Pacific Society of Respirology 2016”held on 12–15 November 2016 Queen Sirikit National Convention Center in Bangkok.
Authors’contributions
WJK takes responsibility for the veracity and completeness of the data and the data analyses. The author developed the design and concept, approved the statistical plan, had full access to the data, interpreted the data, wrote the article, and was responsible for decisions with respect to publication. SK was a study investigator who approved the statistical plan, interpreted the study data, wrote and reviewed drafts of the manuscript, and approved the final version of the manuscript. MNL performed statistical analysis and interpreted the study data. YH, SSH, and SJL contributed to developing the study protocol, were study investigators, interpreted the study data, and reviewed. All authors have read and approved the final manuscript.
Ethics approval and consent to participate
The study protocol was approved by the ethics institutional review boards of participating centers (Institutional Review Board of Kangwon National University Hospital (KNUH) 2012–06-007). Written informed consent was obtained from all the participants.
Consent for publication
Not applicable (The manuscript does not contain any individual persons’ data).
Competing interests
The authors declare that they have no competing interests.
Publisher’s Note
Springer Nature remains neutral with regard to jurisdictional claims in published maps and institutional affiliations.
Author details
1Department of Internal Medicine, Seoul Medical Center, Seoul, Korea. 2
Kangwon National University Data Analytics Center, Chuncheon, Korea. 3Department of Internal Medicine and Environmental Health Center, Kangwon National University, Chuncheon, Korea.
Received: 22 May 2017 Accepted: 6 December 2017
References
1. Han MK, Agusti A, Calverley PM, Celli BR, Criner G, Curtis JL, Fabbri LM, Goldin JG, Jones PW, MacNee W. Chronic obstructive pulmonary disease phenotypes: the future of COPD. Am J Respir Crit Med. 2010;182(5):598–604. 2. Hurst JR, Vestbo J, Anzueto A, Locantore N, Müllerova H, Tal-Singer R, Miller
B, Lomas DA, Agusti A, MacNee W. Susceptibility to exacerbation in chronic obstructive pulmonary disease. N Engl J Med. 2010;363(12):1128–38. 3. Ziegler-Heitbrock L, Frankenberger M, Heimbeck I, Burggraf D, Wjst M,
Häussinger K, Brightling C, Gupta S, Parr D, Subramanian D. The EvA study: aims and strategy. Eur Respir J. 2012;40(4):823–9.
4. Castaldi PJ, Dy J, Ross J, Chang Y, Washko GR, Curran-Everett D, Williams A, Lynch DA, Make BJ, Crapo JD. Cluster analysis in the COPDGene study identifies subtypes of smokers with distinct patterns of airway disease and emphysema. Thorax. 2014;69:415–22.
5. Kim WJ, Lim M-N, Hong Y. Cluster analysis in a COPD cohort identifies three distinct COPD subgroups. Respirology. 2016;21(S3):114.
6. Hong Y, Kwon J-W, Lee S-A, Han YJ, Moon JY, Kim HY, Han S-S, Lee S-J, Kim WJ. Methodology of an observational cohort study for subjects with chronic obstructive pulmonary disease in dusty areas near cement plants. J Pulm Respir Med. 2014;4:169.
7. Hahm CR, Lim MN, Kim HY, Hong S-H, Han S-S, Lee S-J, Kim WJ, Hong Y. Implications of the pulmonary artery to ascending aortic ratio in patients with relatively mild chronic obstructive pulmonary disease. J Thorac Dis. 2016;8(7):1524–31.
8. Hong Y, Ji W, An S, Han S-S, Lee S-J, Kim WJ. Sex differences of COPD phenotypes in nonsmoking patients. Int J Chron Obstruct Pulmo Dis. 2016; 11:1657–62.
9. Nakano Y, Muro S, Sakai H, Hirai T, Chin K, Tsukino M, Nishimura K, Itoh H, Paré PD, Hogg JC. Computed tomographic measurements of airway dimensions and emphysema in smokers: correlation with lung function. Am J Respir Crit Care Med. 2000;162(3):1102–8.
10. Hasegawa M, Nasuhara Y, Onodera Y, Makita H, Nagai K, Fuke S, Ito Y, Betsuyaku T, Nishimura M. Airflow limitation and airway dimensions in chronic obstructive pulmonary disease. Am J Respir Crit Care Med. 2006;173(12):1309–15.
11. Vestbo J, Hurd SS, Agustí AG, Jones PW, Vogelmeier C, Anzueto A, Barnes PJ, Fabbri LM, Martinez FJ, Nishimura M. Global strategy for the diagnosis, management, and prevention of chronic obstructive pulmonary disease: GOLD executive summary. Am J Respir Crit Care Med. 2013;187(4):347–65. 12. Pinto LM, Alghamdi M, Benedetti A, Zaihra T, Landry T, Bourbeau J.
Derivation and validation of clinical phenotypes for COPD: a systematic review. Respir Res. 2015;16(1):50.
validation of clinically relevant chronic obstructive pulmonary disease (COPD) subtypes. Thorax. 2011;66(5):430–7.
14. Cho MH, Washko GR, Hoffmann TJ, Criner GJ, Hoffman EA, Martinez FJ, Laird N, Reilly JJ, Silverman EK. Cluster analysis in severe emphysema subjects using phenotype and genotype data: an exploratory investigation. Respir Res. 2010;11(1):1.
15. Burgel PR, Paillasseur J, Caillaud D, Tillie-Leblond I, Chanez P, Escamilla R, Perez T, Carré P, Roche N. Clinical COPD phenotypes: a novel approach using principal component and cluster analyses. Eur Respir J. 2010;36(3):531–9. 16. Pistolesi M, Camiciottoli G, Paoletti M, Marmai C, Lavorini F, Meoni E,
Marchesi C, Giuntini C. Identification of a predominant COPD phenotype in clinical practice. Respir Med. 2008;102(3):367–76.
17. Jo K, Ra S, Chae E, Seo J, Kim N, Lee J, Kim E, Lee Y, Kim T, Huh J. Three phenotypes of obstructive lung disease in the elderly. Int J Tuberc Lung Dis. 2010;14(11):1481–8.
18. Camp PG, Ramirez-Venegas A, Sansores RH, Alva LF, McDougall JE, Sin DD, Paré PD, Müller NL, Silva CIS, Rojas CE. COPD phenotypes in biomass smoke-versus tobacco smoke-exposed Mexican women. Eur Respir J. 2014;43(3):725–34.
19. Bhatt SP, Soler X, Wang X, Murray S, Anzueto AR, Beaty TH, Boriek AM, Casaburi R, Criner GJ, Diaz AA, et al. Association between functional small airway disease and FEV1 decline in chronic obstructive pulmonary disease. Am J Respir Crit Care Med. 2016;194(2):178–84.
20. Lee J-H, Lee YK, Kim E-K, Kim T-H, Huh JW, Kim WJ, Lee JH, Lee S-M, Lee S, Lim SY. Responses to inhaled long-acting beta-agonist and corticosteroid according to COPD subtype. Respir Med. 2010;104(4):542–9.
21. Rennard SI, Locantore N, Delafont B, Tal-Singer R, Silverman EK, Vestbo J, Miller BE, Bakke P, Celli B, Calverley PM. Identification of five chronic obstructive pulmonary disease subgroups with different prognoses in the ECLIPSE cohort using cluster analysis. Ann Am Thorac Soc. 2015;12(3):303–12.
22. Lee JY, Rhee CK, Jung KS, Yoo KH. Strategies for Management of the Early Chronic Obstructive Lung Disease. Tuberc Respir Dis. 2016;79(3):121–6. 23. Hwang YI, Park YB, Oh YM, Lee JH, Kim TH, Yoo KH, Yoon HK, Rhee CK, Kim
DK, Shin KC. Comparison of Korean COPD guideline and GOLD initiative report in term of acute exacerbation: a validation study for Korean COPD guideline. J Korean Med Sci. 2014;29(8):1108–12.
• We accept pre-submission inquiries
• Our selector tool helps you to find the most relevant journal
• We provide round the clock customer support
• Convenient online submission
• Thorough peer review
• Inclusion in PubMed and all major indexing services
• Maximum visibility for your research
Submit your manuscript at www.biomedcentral.com/submit