IJEDR1804057
International Journal of Engineering Development and Research (
www.ijedr.org
)
301
Utilization of Response Surface Methodology for
the Optimization of Refractory Bricks Production
1Shehu M. S., 2Lamido, S. I. 3Nyam, T.
Department of Chemical Engineering, Kaduna Polytechnic, Kaduna, Nigeria.
_____________________________________________________________________________________________________ Abstract— This research work was carried out to investigate the application of response surface methodology (RSM) for the optimization of refractive bricks production using Box-Behnken design. The optimum response of refractory bricks produced from local raw materials (clay, kaolin and saw dust) that can retain thermal heat was validated experimentally using the optimum parameters obtained. The produced refractory bricks were characterized at its best optimum condition. The optimum parameters obtained for the refractory bricks are temperature of 870.58 °C, time of 6.5 hrs and composition of 8% sawdust. The ANOVA analysis shows that the model is significant and well represents the experimental data. The characterization of the produced fire bricks show that the firing shrinkage and porosity are 1.67 % - 2.87% and 11.63% - 22.69% respectively while the bulk density decreases with increase in composition (5 - 15%) of saw dust from 1.799 - 2.327g/ m3. The cold crushing strength of the sample without sawdust gave the highest value of 5022.61 KN/m3 while sample with sawdust (8%) gave 3002.87KN/m3.
Index Terms—RSM, ANOVA, OPTIMISATION, BOX-BEHNKEN, REFRACTORY BRICKS
_____________________________________________________________________________________________________
I.INTRODUCTION
Refractories are materials that are resistant to high temperature, used predominantly as furnace linings for elevated temperature materials processing and other applications in which thermomechanical properties are critical [1]. The principal raw materials used in the production of refractories are: the oxides of silicon, aluminum, magnesium, calcium and zirconium and some non-oxide refractories like carbides, nitrides, borides, silicates and graphite [2]. Clay basically constituent: clay matter (Al2O3.2SiO2.2H2O), felspathic or micaceous matter (K2O. Al2O3.6SiO2), quartz (SiO2), ferric oxide (Fe2O3) and Lime (CaO). When heated to a temperature ranging from 450-650°C, the clay matter is decomposed into its separate constituents, thus silica, alumina and water [3,4]. Refractories find most of their applications in industries such as iron and steel, cement, glass, non-ferrous metals, petro-chemicals, fertilizer, chemicals, ceramics and thermal power-stations [5]. Estimates have shown that between 50-80% of the refractories produced worldwide are being utilized by the iron and steel industry which is considered to be the largest consumer [6]. Production of refractories in Nigeria is still at its infant stage as the country heavily rely on importation of the product [7] despite the abundant clay deposits all over the country that can be utilize for the production of refractories [8]. The classification of refractory materials is based on: chemical composition (acid, basic and special), method of implementation (shaped and unshaped), method of manufacture (fused and sintered), and porosity content (porous and dense). The properties of these materials include resistant to heat, different degrees of mechanical stress and strain, corrosion from liquids and gases, and mechanical abrasion at elevated temperature [9]. The colour and physical outcome of fired bricks largely depend on the chemical composition of clay material, the firing temperature, as well as the oxidation or reduction condition in the kiln. When an adequate supply of air (oxygen) is circulated within the kiln, oxidation occurs, impacting a red or dark brown colour to the bricks. Thus, reduction conditions occur when the oxygen supply is inadequate which result to an orange, yellow, blue or grey colour on the bricks [10]. Clay brick firing process involves six stages, these include: evaporation, dehydration, oxidation, vitrification, flashing and cooling [11,12]. The quality of bricks depends on the range of temperature required for firing at each stage, whereas the type of clay material, the size and “coring” of the fired bricks determine the temperature required [10,12,13].
Optimization of parameters is one of the most important stages in the development of an efficient and economic production of high value products. The traditional “one-factor-at-a-time approach” is time consuming, and moreover the interactions between independent variables are not considered. Response surface methodology (RSM) is an effective optimization tool wherein many factors and their interactions can be identified with fewer experimental trials [14].
RSM has been widely used in various fields including food process operations, new product development, biotechnology-media composition, and bioprocessing such as enzymatic hydrolysis and fermentation [14]. The RSM is a collection of mathematical and statistical techniques for designing experiments, building models, evaluating the effects of factors, and searching optimum condition of factors for desired responses. The optimization process of this methodology involves studying the response of statistically designed combinations, estimating the coefficients by fitting it in mathematical model that fits best the experimental conditions, predicting the response of the fitted model, and checking the adequacy of the model. Central composite design (CCD) and Box-Behnken design (BBD) are amongst the most commonly used in various experiments [15,16].
IJEDR1804057
International Journal of Engineering Development and Research (
www.ijedr.org
)
302
II.METHODOLOGY`Sample Collection
Clay mix with saw dust and kaolin at varing preparations were used for the production of the refractory bricks. The clay sample was collected from the deposit site at Maraban Jos, Kaduna State, North – West Nigeria, Kaolin is the Kankara Kaolin of Katsina state where as the saw dust was collected from Station Market, Kaduna State.
Sample Preparation
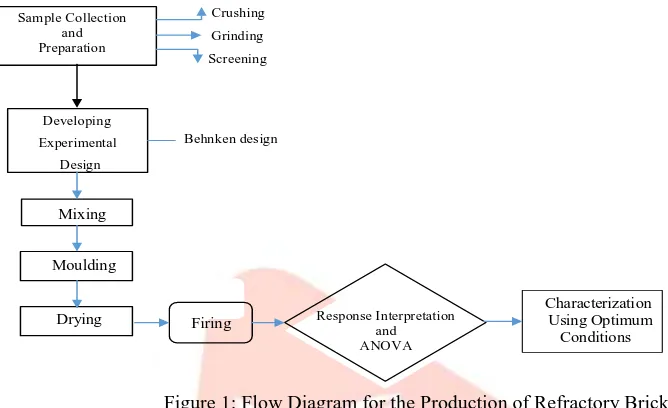
The clay sample was dried in the sun for two weeks, crushed, grounded and sieved. The saw dust was also dried, sieved and graded to suitable size. The brick samples were produced from blending of the clay with, 10% kaolin and 10% of saw dust, 15% saw dust and 5% of kaolin, and finally 5% saw dust and 15% of kaolin respectively. The method employed in making the bricks is depicted in Figure 1.
Grinding Screening Sample Collection
and Preparation
Crushing
Developing
Behnken design Experimental
Design
Mixing
Moulding
Drying Firing Response Interpretation
and ANOVA
Characterization Using Optimum
Conditions
Figure 1: Flow Diagram for the Production of Refractory Bricks.
Experimental Matrix Design
The input variables, process parameters, and the output responses for both modeling and correlation studies are selected based on literature. Hydration experimentation was executed based on the experimental matrix defined using RSM Box – Behnken design approach. The relationship between the output responses (reactivity) and the input process variables (temperature, firing time and clay composition) are defined using RSM modeling approach.
The experimental design was developed using RSM centre cubic design, produced by STATISTICA version 10-software. The design has 16 factorial points, 8 axial points and 6 central points to enable an estimation of process variability.
The experimental matrix was designed based on assigning the extreme points (operating window) as the +/- Alpha value, refer to Table 1. Based on the defined extreme point values, the software then assigns the high and low settings for the factorial points. This was to ensure the modeling could be performed covering the widest range of operating window possible for respective parameters. Because of this the values of factorial points were not nicely rounded.
Table 1: Coded and uncoded levels of the independent variables
III.RESULTS
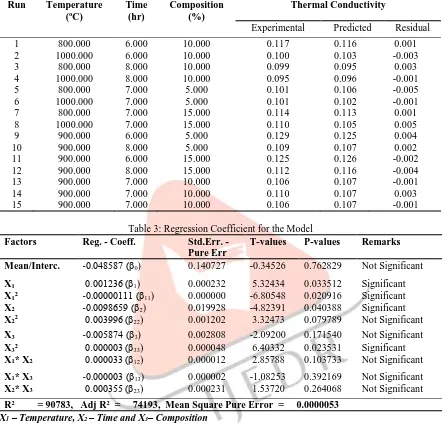
The design of this experiment is based on Box-Benkhen Design having 3 factors and 15 runs as shown in Table 2 using STATISTICA Version 10.0 Software package for implementing RSM methodology. The results for the thermal conductivity for each experimental run of the input parameters (i.e., temperature, time and composition) are also shown in Table 2. Also, the difference between the experimental and predicted values which is the residual and it shows a minute difference for the response parameter at the design points and all the three variables in the uncoded form are given in the same table.
Polynomial Modeling of Refractory Bricks Production
The experimental parameters, ranges and levels of the independent variables investigated in this study are shown in Table 2. The 15 designed experimental runs were conducted and the results analysed with STATISTICA V10. The following quadratic model equations (Equation 1), in uncoded terms, are the equations that correlates the thermal conductivity of the refractory brick to various process parameters as presented in Table 3.
The thermal conductivity equation in term of uncoded factor is given below in Equation 4.1 as:
𝒀 = −𝟎. 𝟎𝟒𝟖𝟓𝟖𝟕 + 𝟎. 𝟎𝟎𝟏𝟐𝟑𝟔𝐗𝟏− 𝟎. 𝟎𝟎𝟗𝟖𝟔𝟓𝟗 𝐗𝟐− 𝟎. 𝟎𝟎𝟓𝟖𝟕𝟒𝑿𝟑− 𝟎. 𝟎𝟎𝟎𝟎𝟎𝟏𝟏𝟏𝐗𝟏𝟐+ 𝟎. 𝟎𝟎𝟑𝟗𝟗𝟔 𝐗𝟐𝟐+
𝟎. 𝟎𝟎𝟎𝟎𝟎𝟑𝑿𝟑𝟐+ 𝟎. 𝟎𝟎𝟎𝟎𝟑𝟑𝐗𝟏∗ 𝐗𝟐− 𝟎. 𝟎𝟎𝟎𝟎𝟎𝟑𝐗𝟏∗ 𝑿𝟑+ 𝟎. 𝟎𝟎𝟎𝟑𝟓𝟓𝐗𝟐∗ 𝑿𝟑 (1)
By eliminating the non-significant effects, Equation 1 is truncated to:
IJEDR1804057
International Journal of Engineering Development and Research (
www.ijedr.org
)
303
The value of coefficient of determination (R2) for the model is 90783 and adjusted R2 was 74193. The P-value of the parameters where also investigated (i.e., Temperature and Time) all have significant effect on the thermal conductivity with P-values less than 0.05 (P-value < 0.005) (i.e., probability error value) as shown in Table 2. Also, the quadratic terms of Temperature and Composition all have significant effects on the response parameter with P-values < 0.005.While the quadratic effect of time, the linear effect of composition, the interaction effect of temperature and time, temperature and composition, and finally time and composition are not too significant effect on the thermal conductivity for the current study.
Table 2: Box Behnken Design for the Production of Refractory Bricks Run Temperature
(oC)
Time (hr)
Composition (%)
Thermal Conductivity
Experimental Predicted Residual
1 800.000 6.000 10.000 0.117 0.116 0.001
2 1000.000 6.000 10.000 0.100 0.103 -0.003
3 800.000 8.000 10.000 0.099 0.095 0.003
4 1000.000 8.000 10.000 0.095 0.096 -0.001
5 800.000 7.000 5.000 0.101 0.106 -0.005
6 1000.000 7.000 5.000 0.101 0.102 -0.001
7 800.000 7.000 15.000 0.114 0.113 0.001
8 1000.000 7.000 15.000 0.110 0.105 0.005
9 900.000 6.000 5.000 0.129 0.125 0.004
10 900.000 8.000 5.000 0.109 0.107 0.002
11 900.000 6.000 15.000 0.125 0.126 -0.002
12 900.000 8.000 15.000 0.112 0.116 -0.004
13 900.000 7.000 10.000 0.106 0.107 -0.001
14 900.000 7.000 10.000 0.110 0.107 0.003
15 900.000 7.000 10.000 0.106 0.107 -0.001
Table 3: Regression Coefficient for the Model Factors Reg. - Coeff. Std.Err. -
Pure Err
T-values P-values Remarks
Mean/Interc. -0.048587 (β0) 0.140727 -0.34526 0.762829 Not Significant
X1 0.001236 (β1) 0.000232 5.32434 0.033512 Significant
X12 -0.00000111 (β11) 0.000000 -6.80548 0.020916 Significant
X2 -0.0098659 (β2) 0.019928 -4.82391 0.040388 Significant
X22 0.003996 (β22) 0.001202 3.32473 0.079789 Not Significant
X3 -0.005874 (β3) 0.002808 -2.09200 0.171540 Not Significant
X32 0.000003 (β33) 0.000048 6.40332 0.023531 Significant X1* X2 0.000033 (β12) 0.000012 2.85788 0.103733 Not Significant X1* X3 -0.000003 (β13) 0.000002 -1.08253 0.392169 Not Significant X2* X3 0.000355 (β23) 0.000231 1.53720 0.264068 Not Significant R2 = 90783, Adj R2 = 74193, Mean Square Pure Error = 0.0000053
Where; X1 – Temperature, X2 – Time and X3– Composition
Analysis of Variance (ANOVA)
Statistical analysis of the design model was performed using STATISTICA V10 to estimate the ANOVA and check the adequacy of the model. The results of ANOVA for fitting the quadratic response surface model by mean square method and also checking the adequacy of the model are summarized in Table 4. The coefficients of the response surface model as provided by equation 1 in uncoded factor were also evaluated. The significance of each parameter of the model is checked using P-values and confidence, which shows the interaction strength of each parameter. From Table 4, the parameters with P-value < 0.05 demonstrates high significance in predicting the response values which indicates the suitability of the model, also the high F-value low P-F-value indicates the high significance of the fitted model. Also, the Lack of Fit P-F-value which is not significant indicates that it fits into the designed model as shown in Table 4.
Response Surface Analysis and Pareto Chart
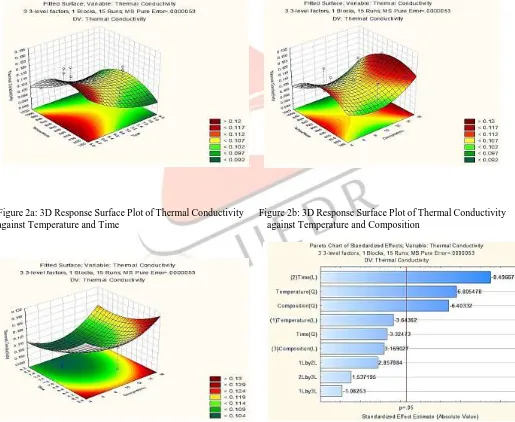
The effects of process variables on the response variable can be better elaborated by visualization using response surface plots and pareto chart. Figure 2a shows the effect of temperature and time on thermal conductivity. The quadratic effect of temperature is more dominant than that of time. Figure 2b is a saddle plot where there is no overall minimum or maximum, it is a case where the quadratic effect of temperature is more dominant than that of the composition. In Figure 2c, the thermal conductivity keeps decreasing up to 7hr 20mins of heating before it gradually increases and this was achieved at a composition of 10%.
IJEDR1804057
International Journal of Engineering Development and Research (
www.ijedr.org
)
304
is the quadratic term of composition, though it’s a bit close to the quadratic term of temperature. While all other parameters are not significant, and their P-value is the below the datum P = 0.005.Table 4: ANOVA for Polynomial Quadratic Model
Figure 2a: 3D Response Surface Plot of Thermal Conductivity Figure 2b: 3D Response Surface Plot of Thermal Conductivity against Temperature and Time against Temperature and Composition
Figure 2c: 3D Response Surface Plot of Thermal Conductivity Figure 3: Pareto Chart of the Standardized Effect of against Time and Composition Thermal Conductivity Response
Optimization and Validation of the Model
Numerical optimization technique based on desirability function was carried out to determine the workable optimum conditions for maximizing the produced brick thermal conductivity. In order to provide an ideal case for thermal conductivity, the goal for
Factors Sum of Square
Degree of Freedom
Mean Square
F-value P-value Remarks
X1 0.000071 1 0.000071 13.27594 0.067758 Not Significant
X12 0.000247 1 0.000247 46.31453 0.020916 Significant
X2 0.000385 1 0.000385 72.19336 0.013570 Significant
X22 0.000059 1 0.000059 11.05386 0.079789 Not Significant
X3 0.000054 1 0.000054 10.04273 0.086805 Not Significant
X32 0.000219 1 0.000219 41.00251 0.023531 Significant
X1* X2 0.000044 1 0.000044 8.16750 0.103733 Not Significant
X1* X3 0.000006 1 0.000006 1.17187 0.392169 Not Significant
X2* X3 0.000013 1 0.000013 2.36297 0.264068 Not Significant
Lack of Fit 0.000105 3 0.000035 6.54734 0.135365 Not Significant Pure Error 0.000011 2 0.000005
Total SS 0.001252 14
IJEDR1804057
International Journal of Engineering Development and Research (
www.ijedr.org
)
305
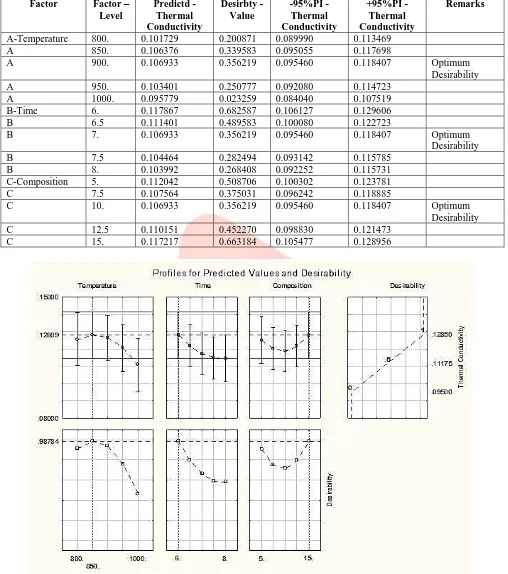
temperature, time and composition was set in range based upon requirements of the thermal conductivity. The result of the factor settings and optimization, predicted responses at the current level of each factor (uncoded) in the model are presented in Table 5 and Figure 4. respectively.Table 5: RSM Optimization Result for the Model Factor Factor –
Level
Predictd - Thermal Conductivity
Desirbty - Value
-95%PI - Thermal Conductivity
+95%PI - Thermal Conductivity
Remarks
A-Temperature 800. 0.101729 0.200871 0.089990 0.113469
A 850. 0.106376 0.339583 0.095055 0.117698
A 900. 0.106933 0.356219 0.095460 0.118407 Optimum
Desirability
A 950. 0.103401 0.250777 0.092080 0.114723
A 1000. 0.095779 0.023259 0.084040 0.107519
B-Time 6. 0.117867 0.682587 0.106127 0.129606
B 6.5 0.111401 0.489583 0.100080 0.122723
B 7. 0.106933 0.356219 0.095460 0.118407 Optimum
Desirability
B 7.5 0.104464 0.282494 0.093142 0.115785
B 8. 0.103992 0.268408 0.092252 0.115731
C-Composition 5. 0.112042 0.508706 0.100302 0.123781
C 7.5 0.107564 0.375031 0.096242 0.118885
C 10. 0.106933 0.356219 0.095460 0.118407 Optimum
Desirability
C 12.5 0.110151 0.452270 0.098830 0.121473
C 15. 0.117217 0.663184 0.105477 0.128956
Figure 4: RSM Optimization Plot of Thermal Conductivity against Temperature, Time and Composition
Optimum Input Parameter and Refractory Brick Production
The optimum parameters of the temperature, time and composition in the coded and uncoded form are shown in Table 6. Equation 3 is use to convert the coded parameters to the uncoded parameters.
𝑋 =𝑍𝑖−𝑍∗
∆𝑍 (3)
IJEDR1804057
International Journal of Engineering Development and Research (
www.ijedr.org
)
306
Table 6: Inputs Values to Convert from Coded to Uncoded form for the three Optimum Variable Factors.Factors Coding Xi Z* ∆Z Zi
Temperature (oC) X1 -0.237780 900 100 876.222
Time (hr) X2 -0.554488 7 1 6.44512
Composition (%) X3 0.206809 10 5 11.034043
Table 7: Regression Summary of Optimum Parameters for Refractory Brick Production. Factors Optimum parameters (coded) Optimum Parameters (uncoded)
Temperature (oC) -0.237780 876.222
Time (hr) -0.554488 6.44512
Composition (%) 0.206809 11.034043
Table 6 shows the input values for converting the optimum coded values to their respective uncoded factors as expressed in Equation 3. The optimum parameters of 876.222 oC temperature, 6.44512 h time and 11.034043 % composition were obtained and these optimum factors were inputted in Equation 2 to obtain 0.118617 as the response.
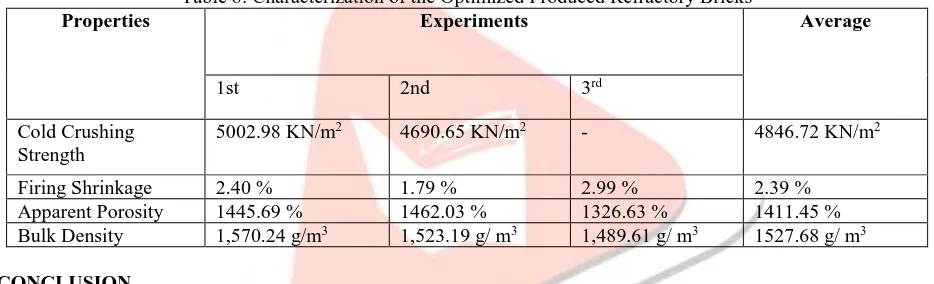
Characterization of the Optimized Produced Refractory Bricks
To validate the optimization, a confirmatory test was carried out by producing the refractory brick at these optimum values of temperature, time and percentage composition. And the experiment was repeated three times.
The following results were obtained from averaging the results of the experiment: cold crushing strength is 4846.72 KN/m2; firing shrinkage, is 2.39 %; for apparent porosity, is 1411.45; for bulk density, is 1527.68 g/m3. And therefore, the model has been validated.
Table 8: Characterization of the Optimized Produced Refractory Bricks
Properties Experiments Average
1st 2nd 3rd
Cold Crushing Strength
5002.98 KN/m2 4690.65 KN/m2 - 4846.72 KN/m2
Firing Shrinkage 2.40 % 1.79 % 2.99 % 2.39 %
Apparent Porosity 1445.69 % 1462.03 % 1326.63 % 1411.45 %
Bulk Density 1,570.24 g/m3 1,523.19 g/ m3 1,489.61 g/ m3 1527.68 g/ m3
IV.CONCLUSION
The optimization of refractory bricks production through the application of response surface methodology from locally sourced clay was successfully carried out. Optimum model parameters such as temperature 875.222 oC, time 6.44512 h and composition of 11.034043 % respectively were used for the production of the optimized refractory bricks. The refractory bricks produced at optimum conditions shows characteristics are within the allowable limits for refractory bricks in terms of light weight, moderate porosity, minimum shrinkage and medium strength to reduce thermal conductivity.
The coefficient of determinant (R2) is 90.783 % which shows that the model equation has a very good fit to the experimental data.
With the results obtained, it could be concluded that the refractory bricks produced at optimum conditions have a low thermal conductivity of 0.11791 W/m.K which can withstand high temperature for greater energy efficiency and less capital spent. REFERENCES
[1]. Lee W.E. 2000, Comprehensive Composite Materials, Volume 4, 2000 Elsevier Science Ltd., Pg. 363-385, https://doi.org/10.1016/B0-08-042993-9/00099-1
[2]. McEwan, N., Courtney,T., Parry, R.A. and Knupfer, P., 2011. A Cost-Effective Refractory Raw Material for Refractories in Various Metallurgical Applications, Southern African Institute of Mining and Metallurgy, Johannesburg, 6–9 March 2011 359.
[3]. Diop M. B., Grutzeck M., Molez L. 2011. Comparing the Performances of Bricks Made with Natural Clay and Clay Activated by Calcination and Addition of Sodium Silicate. Appl Clay Sci 54: 172-178.
[4]. Oti J. E., Kinuthia J. M. 2012. Stabilised Unfired Clay Bricks for Environmental and Sustainable Use. App Clay Sci 58: 52-59.
[5]. Erwan G. J. H. and Cord F., 2014, Raw Material Challenges in Refractory Application, http://www.vivis.de/phocadownload/Download/2014_mna/2014_mna_489_502_guguen.pdf
IJEDR1804057
International Journal of Engineering Development and Research (
www.ijedr.org
)
307
[8]. Musa, U., Aliyu M. A., Mohammed, I. A. 2012. A Comparative Study on the Refractory Properties of Selected Clays in North Central Nigeria. Academic Research International ISSN-L: 2223-9553, ISSN: 2223-9944 Vol. 3, No. 1. www.journals.savap.org[9]. Sadik. C., El-Amrani, I-E. , Albizane, A. 2014. Recent advances in silica-alumina refractory: A review. Journal of Asian Ceramic Societies, 2(2), 83-96. doi/10.1016/j.jascer.2014.03.001www.elsevier.com/locate/jascer
[10]. Aramide, F.O. 2012. Effect of Firing Temperature on Mechanical Properties of Fired Masonry Bricks Produced from Ipetumodu Clay. Leonardo j scipp: 70-82.
[11]. Kornmann M. 2007. Clay Bricks and Rooftiles, manufacturing and properties. (2nd ed.), CTTB, Paris.
[12]. Brick Industry Association (BIA). 2006. Manufacturing of Bricks. Technical notes on brick construction-brick industry association, Virginia, USA. http://www.gobricksoutheast.com/downloads/bia-technote.pdf
[13]. Merschmeyer G. 2000. Firing of clay bricks and tiles-wall building. Technical brief, German appropriate technology exchange, Eschborn Germany
[14]. S.H.A.Rahman,J.P.Choudhury,A.L.Ahmad,andA.H. Kamaruddin, 2007. “Optimization studies on acid hydrolysis of oil palm empty fruit bunch fiber for production of xylose,”Bioresource Technology, vol. 98, no. 3, pp. 554–559.
[15] G. E. P. Box, W. G. Hunter, and J. S. Hunter, 1978. Statistic for Experimenters, John Wiley & Sons, New York, NY, USA. [16] C.-H. Dong, X.-Q. Xie, X.-L. Wang, Y. Zhan, and Y.-J. Yao, 2009 .“Application of Box-Behnken design in optimisation for polysaccharides extraction from cultured mycelium of Cordyceps sinensis,”Food and Bioproducts Processing,vol.87,no.2,pp.139–144.