www.nat-hazards-earth-syst-sci.net/15/1859/2015/ doi:10.5194/nhess-15-1859-2015
© Author(s) 2015. CC Attribution 3.0 License.
Flash flood occurrence and relation to the rainfall hazard in a
highly urbanized area
K. Papagiannaki, K. Lagouvardos, V. Kotroni, and A. Bezes
Institute of Environmental Research and Sustainable Development, National Observatory of Athens, Athens, Greece
Correspondence to: K. Papagiannaki ([email protected])
Received: 2 April 2015 – Published in Nat. Hazards Earth Syst. Sci. Discuss.: 8 May 2015 Revised: 22 July 2015 – Accepted: 2 August 2015 – Published: 19 August 2015
Abstract. The paper examines the flash flood events that oc-curred over a decade in the Attica prefecture, the most urban-ized region of Greece, with the aim of identifying triggering rainfall thresholds, as well as assessing the effect of rainfall upon the magnitude of the induced damages. The analysis incorporates rainfall records from a network of 28 surface meteorological stations and information on the spatial distri-bution of the flash flood events that is derived from the active database of damaging weather events maintained by the at-mospheric modelling group of the National Observatory of Athens. The main findings concern firstly the relation be-tween the flash flood impact, as measured by the fire service operations in flooded properties, and precipitation in various time intervals. In the period 2005–2014, 48 damaging flash flood events occurred in the target area and caused more than 3500 fire service operations in flooded properties. Most of the events are associated with maximum accumulated rainfall of more than 20 mm in 24 h and 3 mm in 10 min. However, the flash flood impact intensity, as measured by the number of the fire service operations per event, increases significantly above the levels of 60 mm in 24 h and 10 mm in 10 min. Sec-ondly, graphs of rainfall intensity versus duration are devel-oped for 15 sub-areas of Attica in order to define rainfall in-tensity thresholds for flood triggering at a more local level. It is shown that conclusions regarding the reliability of the estimated thresholds should take into account the represen-tativity of the rain gauges, which is determined by the local network’s density, the gauges’ location and record length.
1 Introduction
Flooding caused by heavy rainfall is a weather-related hydro-logical hazard associated with significant economic losses, human fatalities and adverse effects to society and the ecosystem. Even though floods do not appear with the catas-trophic power of other natural hazards, such as earthquakes, their overall impact on society and the economy is very seri-ous. In Europe, numerous floods and flash floods occur each year, accounting for 40 % of the total economic damages due to natural hazards for the period 1989–2008 (CRED, 2009). The societal impact of flash floods varies and depends on the hazard intensity and the vulnerability of the affected area as measured by its topographic and demographic features, the quantity and quality of the materials exposed, the anthro-pogenic interventions and the effectiveness of the prevention measures taken by the local authorities (Tsakiris, 2014). In-terestingly, extreme flash floods in the Mediterranean coun-tries tend to be greater in magnitude compared to the inner continental countries (Gaume et al., 2009), while they occa-sionally produce catastrophic damages (Llasat et al., 2013; Lastoria et al., 2006). Furthermore, analysis of the spatial distribution of flood events in Mediterranean countries has shown that the urbanized environment increases vulnerabil-ity and flood risks (Llasat et al., 2009).
are difficult to assess, such as the land development that lim-its water infiltration and increases run-off (Du et al., 2015; Kandilioti and Makropoulos, 2012) and population density associated with the amount of people and property exposed to risk (Amaro et al., 2010; Llasat et al., 2009). Recently, Barbería et al. (2014) discussed rainfall intensity thresholds in conjunction with regional vulnerability indicators, namely the population density, which is directly linked to the type of urbanization and the land use (Llasat et al., 2009). This study investigates the correlation between several rainfall param-eters and the number of requests received by the meteoro-logical services related to insurance claims, which have been already proved to be a good indicator of social impact in the study of Amaro et al. (2010). The urban area discussed is the city of Barcelona, and results for the period 2008–2011 show that there is a statistically significant correlation be-tween short-duration rainfall intensities and the requests re-lated to insurance claims. The high value of this study is that it successfully introduces an alternative measure of the mate-rial damages, namely the number of insurance claims, com-pared to monetary measures such as the compensations paid by the implicated authorities and the insurance companies (Llasat et al., 2008; Lastoria et al., 2006; Jonkman, 2005), which may constitute a better indicator of the impact inten-sity of the event but are rather hard to find and often cover only part of the overall damage.
As mentioned before, Barbería et al. (2014) also assess the rainfall intensity factor as an indicator of the flash flood hazard. The authors suggest specific thresholds of precipita-tion and relate them to the impact intensity of the flash flood events. In search of the flood-triggering factors, other studies have also used the accumulated rainfall and/or the rainfall in-tensity as main indicators of the flash flood occurrence and magnitude. Cannon et al. (2008) and Guzzetti et al. (2008) developed rainfall intensity–duration thresholds for the oc-currence of debris flows, landslides and floods. This method-ology was later adapted by Diakakis (2012) to examine the role of storm totals, peak and average rainfall intensity, and moisture conditions in flood triggering in northeast Attica, in Greece, for the period 1993–2008. The author found a signif-icant correlation between peak storm intensity and flood trig-gering and presented rainfall thresholds above which flood-ing is highly probable. Bracken et al. (2008) studied a semi-arid area in south-east Spain and found that floods in the pe-riod 1997–2003 have been more highly related to the total rainfall than to the intensity of a storm, although intensity controls the nature and timing of the flood process.
Rainfall thresholds have been also proposed as indicators of early warnings of flash floods. Martina et al. (2006) intro-duced a methodology for issuing flood warnings by directly comparing the quantitative precipitation forecast to a criti-cal rainfall threshold value, incorporating initial soil mois-ture conditions as well as expected costs, without the need of real-time meteorological and hydrological forecasting mod-els. In Norbiato et al. (2009) flash flood warning
methodolo-gies are based on hydrological models, but they also integrate the flash flood guidance (FFG) method, that is, the rainfall threshold approach on which the US National Weather Ser-vice relies for issuing warnings (Georgakakos, 2006). FFG refers to the volume of rain of a given duration necessary to cause minor flooding of small streams (Carpenter et al., 1999). Price et al. (2011a, b) recognized that flash floods are among the costliest natural hazards around the globe and used lightning data to better understand and predict flash floods in the Mediterranean. Over the highly urbanized area of Athens, flash flood forecasting has been explored based on an integrated hydro-meteorological system by Koussis et al. (2003), with promising results.
The present paper contributes to the research on the im-pact and triggering factors of flash floods in Greece and the Mediterranean, introducing an analysis of the flash flood events that occurred during the 10-year period 2005–2014 in the Attica basin, the most urbanized and densely populated region of the country. The main targets are to detect system-atically affected areas within Attica, define and assess flash flood hazard indicators, and discern flash flood patterns and possible rainfall thresholds related to the occurrence of flash floods as well as to the magnitude of the adverse impact. The possibility of using the estimated rainfall thresholds to estab-lish alert systems to warn communities of impending floods is also discussed.
For the analysis, the database of high-impact weather events developed by the atmospheric modelling group of the National Observatory of Athens (NOA) was used (Papagian-naki et al., 2013). The database provides information about all the high-impact weather events that have occurred since 2001 and is systematically updated. The number of the fire service operations during flooding events is also incorpo-rated in the analysis and studied in relation to the rainfall parameters, in search of a reliable impact indicator that is systematically and officially recorded. In the context of the present analysis, regional vulnerability to the flash flood haz-ard is partly addressed by examining the frequency of flood-ing events in conjunction with the amount of rainfall needed for a place to flood and by discussing the relevance of topo-graphic and vulnerability-related factors, namely the popula-tion density, to the frequency of flooding events.
dis-Figure 1. Map of the Greek target area (Athens and suburbs) and locations of the 28 surface meteorological stations. Stations are named by the municipalities they are located in. (Created us-ing QGIS and SRTM-v3 elevation data. Projection GGRS87. Area easting: 450 000–500 000 m. Area northing: 4 180 000–4 230 000 m. Copyright NOA-IERSD.)
cussed. The analysis concerns the entire target area as well as 15 additional sub-areas, thus providing evaluation of the rainfall thresholds for flood triggering at a more local level. Finally, in Sect. 5 (Concluding remarks), main conclusions and future perspectives are given.
2 Data collection
The target area comprises the city of Athens, which is the capital of Greece, and the suburbs, which are subdivided in municipalities. From a geographical point of view, the target area – hereafter called Athens-suburbs – depicted in Fig. 1, is located in the centre of the Attica region, in the central-east of the Greek mainland, bordering the southern part of the Aegean Sea and surrounded by four mountains: Aigaleo and Parnitha in the west-north-west, and Penteli and Hymettus in the east-south-east. Two rivers flow through the Athens plain. The large one, the river Kifissos, is the main water stream of Athens, follows a NNE-SSW flow direction and has pro-duced serious flooding events in the past. Since 2002, it has been systematically monitored to prevent unpredictable over-flows. The second and smaller river, Ilissos, is found in the east part and has been built up to a great extent.
In what concerns the frequency and magnitude of dam-ages caused by weather-related hazards, Attica is by far the most affected region in the country (Papagiannaki et al., 2013; Diakakis et al., 2012), suffering particularly from flash floods, which cause at times serious damages. Accord-ing to the latest report of the Hellenic Association of
In-surance Companies (HAIC, 2015), the 13 most damaging flash flood events that occurred in Greece during the period 1993–2014 caused economic losses of about EUR 93 million, most of which correspond to claims for compensations in Attica. Vulnerability of the Attica prefecture to flash floods is highlighted in the study of Papagiannaki et al. (2013), which introduced the database of high-impact weather events that have occurred in Greece since 2001, followed by the spatial and temporal distribution of the events for the pe-riod 2001–2011. A simplified version of the database is available online on the site of the atmospheric modelling group of the National Observatory of Athens (http://www. meteo.gr/weather_cases.asp). A geographical presentation of the recorded weather events is also available online (http:// www.meteo.gr/meteoplus/weatherevents.cfm). The database is systematically updated with every new weather event that generates damages in Greece and includes so far more than 300 cases, which are classified according to their weather and impact intensity. According to the updated database, dur-ing the period 2001–2014, 91 flash flood events affected At-tica, 48 of which occurred in the Athens-suburbs area, caus-ing buildcaus-ings, infrastructure and vehicle damages; large-scale transport disruption; flooded road; and in some cases hu-man fatalities. The database, besides the weather and impact classification, also encloses detailed information for each weather event, namely their geographical distribution, the location and type of damages, meteorological data, and de-tailed references in the press. Thus, it has been used for the purposes of the present analysis in order to define the flash flood events that occurred in the target area and the location of the respective damages.
To address the vulnerability of the specific areas affected by flash floods within the Athens-suburbs region, weather and impact indicators are both incorporated in the present analysis. Meteorological data used in the analysis derive from 28 surface meteorological stations (Fig. 1) spread in the Athens-suburbs region. The atmospheric modelling group of the National Observatory of Athens operates 18 of these sta-tions, while the rest are operated by the Laboratory of Hy-drology and Water Resources Management of the National Technical University of Athens (NTUA) and rainfall mea-surements are freely available to the public. The meteoro-logical stations provide 10 min observations of various me-teorological parameters such as temperature, pressure, hu-midity, wind velocity and direction, rain and rain intensity. Based on the availability of rain observations from the NOA and NTUA meteorological station networks in Athens, the present analysis is limited to the 10-year period 2005–2014.
the operations in flooded properties derive from the Statisti-cal Department of the Hellenic Fire Service and concern the entire Attica region for the period 2003–2013. For the year 2014, the respective data have been found in press articles; thus they may deviate from the official ones, being underesti-mated only to a small degree. Even though the number of op-erations during an event concerns the entire region of Attica, the description of the events included in the database is ex-tensive enough to reproduce with high certainty the map with the specific areas affected during each event. The data pro-vided by the fire service are exhaustive, while all the events with more than 10 operations have been included in the NOA database and, thus, are considered in the present analysis. The amount of fire service operations per event derives from the aggregation of the number of operations per day that took place during the days of an event. It should be noted that one operation may concern more than one building; thus the ac-tual number of flooded properties is not known. Judging from the respective press that usually reports the number of citi-zens’ calls, the amount of flooded properties can be as much as 4 times greater than the number of operations in the same event. However, due to the uncertainty in the actual number of properties, this study uses the number of operations which is systematically recorded and therefore highly reliable.
3 Methodological issues 3.1 Specification of sub-areas
In order to account for the regional characteristics and vulnerability (Barberia et al., 2011), specific sub-areas within the Athens-suburbs region are also studied separately. Methodological issues concern the division of the Athens-suburbs region into sub-areas that can be considered to be adequately covered by a group of specific rain gauges, the specification of the particular areas that were influenced by each flash flood event and the specification of the most rep-resentative rain gauges for each flash flood event. Difficulties emerge due to the spatial distribution and the short lifetime of some of the gauges that result in lack of good representa-tion at municipality level. Thus, an optimum exploitarepresenta-tion of the existing rain gauges is required in order to match gauges with sub-areas and then with the flash flood events.
The division of the Athens-suburbs region in secondary areas follows geographical criteria and is guided by the lo-cation of mountains and river streams, and an important cri-terion for the determination of each sub-area is the presence of rain gauges located within its perimeter. As Fig. 2 shows, the shaped sub-areas are covered by three to five gauges. The name of each sub-area derives from the respective munici-pality that covers the major part of it. The formation of the sub-areas based on the above-mentioned criteria rather than the administrative boundaries of the municipalities enables the analysis to be as effective as possible based on a
suffi-cient number and spatial distribution of gauges. In what con-cerns the specification of the areas influenced by each flash flood event, as explained in Sect. 2, the descriptive informa-tion included in the NOA database of weather-related events has been used.
3.2 Maximum precipitation and fire service data
In the context of the present analysis, impact indicators are studied in conjunction with hazard parameters. Following the concept of the most recent and relevant articles (Barbería et al., 2014; Diakakis, 2012), precipitation parameters have been used in the analysis, namely the rain records in vari-ous time intervals. For each event, the absolute maximum precipitation is calculated based on the observations of the representative rain gauges. Maximum precipitation in differ-ent time intervals is then correlated to the number of the fire service operations per event in order to assess the effect of the rainfall intensity on the magnitude of the societal impact. The statistical dependence is measured with Spearman’s rank correlation coefficient,ρ, which does not assume normality of data. Also, distributions of the frequency of the operations by month and by rainfall level are presented to complement the discussion.
A methodological limitation is the fact that the number of the fire service operations per event, which is given as a total for the entire target area, cannot be distributed to the spe-cific sub-areas affected in each case. Thus, the local impact intensity cannot be measured by the number of operations. Instead, local vulnerability is assessed firstly based on the frequency of damaging flash flood events per area and sec-ondly by the examination of the hazard intensity related to the flood occurrence in each specified area.
3.3 Rainfall thresholds
calcu-Figure 2. Division of Athens-suburbs region in 15 sub-areas. The representative rain gauges in each sub-area are also shown with red (NOA stations) and green (NTUA stations) bullets. (Created us-ing QGIS and SRTM-v3 elevation data. Projection GGRS87. Area easting: 450 000–50 0000 m. Area northing: 4 180 000–4 230 000 m. Copyright NOA-IERSD.)
lated as the maximum moving sum, through time steps of 10, 30 and 60 min, and 2, 3, 12 and 24 h respectively.
4 Urban flash flood analysis
During the period 2005–2014, 48 flash flood events occurred in the Athens-suburbs region and caused more than 3500 fire service operations in flooded properties. The maps in Fig. 3a and b highlight the spatial distribution of flash flood events in the Athens-suburbs region and population density respec-tively. Both maps display the distribution at a municipality level due to the respective availability of population data. Comparison between the two maps leaves no doubt as to the importance of the population distribution to the regional vulnerability. The municipality of Athens, which is the most densely populated area, with around 17 000 inhabitants per km2, was the most frequently affected area, with 20 events recorded during the study period. High population density is naturally related to intense urbanization, which results in an increase in impervious surface and, consequently, in total run-off volumes. Besides that, the geographical location of Athens also contributes to the increased vulnerability to the rainfall hazard. Athens is located in the centre of the Attica basin, where run-off from the higher sloped areas end.
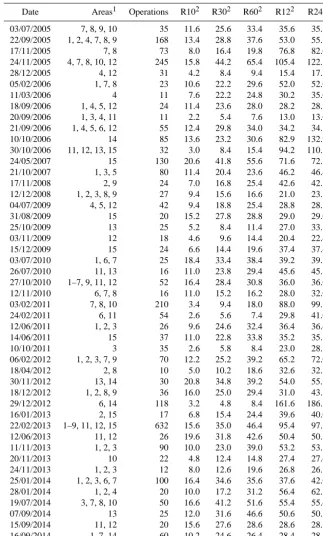
4.1 Relation between hazard and impact indicators Table 1 includes the areas affected by each flash flood, fol-lowing the numbering of the specific sub-areas shown in Fig. 2, the number of the fire service operations and the
Figure 3. (a) Number of flash flood events for each one of the 15 sub-areas of the Athens-suburbs region. (b) Population density (people per sq. km of land area). (Created using QGIS and SRTM-v3 elevation data. Projection GGRS87. Area easting: 450 000– 500 000 m. Area northing: 4 180 000–4 230 000 m. Copyright NOA-IERSD.)
maximum precipitation (in mm) in various time intervals per event. Most of the events affected as many as 6 sub-areas, and only 3 out of the 48 events were actually spread over a large part of the Athens-suburbs region.
damag-Table 1. Areas affected, number of fire service operations and rainfall (in mm, at various accumulation durations) per flash flood event.
Date Areas1 Operations R102 R302 R602 R122 R242
03/07/2005 7, 8, 9, 10 35 11.6 25.6 33.4 35.6 35.6
22/09/2005 1, 2, 4, 7, 8, 9 168 13.4 28.8 37.6 53.0 55.2
17/11/2005 7, 8 73 8.0 16.4 19.8 76.8 82.0
24/11/2005 4, 7, 8, 10, 12 245 15.8 44.2 65.4 105.4 122.8
28/12/2005 4, 12 31 4.2 8.4 9.4 15.4 17.2
05/02/2006 1, 7, 8 23 10.6 22.2 29.6 52.0 52.0
11/03/2006 4 11 7.6 22.2 24.8 30.2 35.0
18/09/2006 1, 4, 5, 12 24 11.4 23.6 28.0 28.2 28.2
20/09/2006 1, 3, 4, 11 11 2.2 5.4 7.6 13.0 13.0
21/09/2006 1, 4, 5, 6, 12 55 12.4 29.8 34.0 34.2 34.2
10/10/2006 14 85 13.6 23.2 30.6 82.9 132.9
30/10/2006 11, 12, 13, 15 32 3.0 8.4 15.4 94.2 110.8
24/05/2007 15 130 20.6 41.8 55.6 71.6 72.2
21/10/2007 1, 3, 5 80 11.4 20.4 23.6 46.2 46.4
17/11/2008 2, 9 24 7.0 16.8 25.4 42.6 42.6
12/12/2008 1, 2, 3, 8, 9 27 9.4 15.6 16.6 21.0 23.2
04/07/2009 4, 5, 12 42 9.4 18.8 25.4 28.8 28.8
31/08/2009 15 20 15.2 27.8 28.8 29.0 29.0
25/10/2009 13 25 5.2 8.4 11.4 27.0 33.6
03/11/2009 12 18 4.6 9.6 14.4 20.4 22.4
15/12/2009 15 24 6.6 14.4 19.6 37.4 37.4
03/07/2010 1, 6, 7 25 18.4 33.4 38.4 39.2 39.2
26/07/2010 11, 13 16 11.0 23.8 29.4 45.6 45.6
27/10/2010 1–7, 9, 11, 12 52 16.4 28.4 30.8 36.0 36.0
12/11/2010 6, 7, 8 16 11.0 15.2 16.2 28.0 32.0
03/02/2011 7, 8, 10 210 3.4 9.4 18.0 88.0 99.6
24/02/2011 6, 11 54 2.6 5.6 7.4 29.8 41.0
12/06/2011 1, 2, 3 26 9.6 24.6 32.4 36.4 36.4
14/06/2011 15 37 11.0 22.8 33.8 35.2 35.2
10/10/2011 3 35 2.6 5.8 8.4 23.0 28.8
06/02/2012 1, 2, 3, 7, 9 70 12.2 25.2 39.2 65.2 72.0
18/04/2012 2, 8 10 5.0 10.2 18.6 32.6 32.6
30/11/2012 13, 14 30 20.8 34.8 39.2 54.0 55.2
18/12/2012 1, 2, 8, 9 36 16.0 25.0 29.4 31.0 43.8
29/12/2012 6, 14 118 3.2 4.8 8.4 161.6 186.2
16/01/2013 2, 15 17 6.8 15.4 24.4 39.6 40.0
22/02/2013 1–9, 11, 12, 15 632 15.6 35.0 46.4 95.4 97.6
12/06/2013 11, 12 26 19.6 31.8 42.6 50.4 50.8
11/11/2013 1, 2, 3 90 10.0 23.0 39.0 53.2 53.2
20/11/2013 10 22 4.8 12.4 14.8 27.4 27.4
24/11/2013 1, 2, 3 12 8.0 12.6 19.6 26.8 26.8
25/01/2014 1, 2, 3, 6, 7 100 16.4 34.6 35.6 37.6 42.0
28/01/2014 1, 2, 4 20 10.0 17.2 31.2 56.4 62.2
19/07/2014 3, 7, 8, 10 50 16.6 41.2 51.6 55.4 55.4
07/09/2014 13 25 12.0 31.6 46.6 50.6 50.8
15/09/2014 11, 12 20 15.6 27.6 28.6 28.6 28.8
16/09/2014 1, 7, 14 60 10.2 24.6 26.4 28.4 28.8
24/10/2014 1–4, 9, 12, 15 500 14.0 35.6 43.6 71.8 74.0
1For numbering see Fig. 2.2Maximum precipitation per event in various time intervals: 10, 30 and 60 min; 12 and
24 h.
ing flash flood events during which less than 20 mm of R24 was recorded and three events with R10 less than 3 mm.
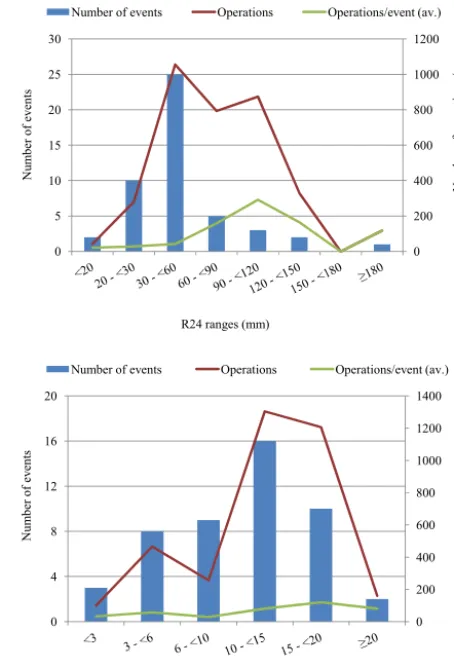
To better comprehend the role of the hazard magnitude, Fig. 5a and b display the number of events and operations for
0 20 40 60 80 100 120 140 160 180 200
25 50 75 100
M ax 2 4 h r ai n -R 2 4 ( m m )
Fraction of data (% of total events)
0 5 10 15 20 25
25 50 75 100
M ax 1 0 m in r ai n -R 1 0 ( m m )
Fraction of data (% of total events)
Figure 4. Quantile distribution plots for (a) the maximum 24 h ac-cumulated rain (R24) and (b) the maximum 10 min acac-cumulated rain (R10) observations (in mm).
average number of operations per event, is much higher for R24 above 60 mm. On average, 42 operations per event have been recorded for R24 between 30 and 60 mm, while 160 operations per event correspond to R24 between 60 and 90 mm, 291 operations per event to R24 between 90 mm and 120 mm, and 165 operations per event to R24 between 120 and 150 mm. Therefore, the rainfall hazard, when examin-ing the entire Athens-suburbs region, increases significantly above the level of 60 mm for R24. Furthermore, the distri-bution and impact of flash flood events based on the level of R10 (Fig. 5b) show that the most common R10 records are in the range of 10–15 mm, while the impact intensity increases significantly above 10 mm. Particularly for R10 range 15– 20 mm, the average number of operations per event was over 120 for the examined period.
In what concerns the temporal distribution, Fig. 6 shows that autumn was the season with the highest frequency of flash flood events, as well as with the highest number of fire service operations, followed by winter. Autumn in Greece is actually the season with the highest frequency of rain-fall and the highest accumulated rainrain-fall, particularly in what concerns the mainland (Jansa et al., 2014; Lagouvardos and Kotroni, 2007; Kotroni et al., 1999; Lagouvardos et al.,
0 200 400 600 800 1000 1200 0 5 10 15 20 25 30 N u m b er o f o p er at io n s / N u m b er o f o p er at io n s/ ev en t N u m b er o f ev en ts
R24 ranges (mm)
Number of events Operations Operations/event (av.)
0 200 400 600 800 1000 1200 1400 0 4 8 12 16 20 N u m b er o f o p er at io n s / N u m b er o f o p er at io n s/ ev en t N u m b er o f ev en ts
R10 ranges (mm)
Number of events Operations Operations/event (av.)
Figure 5. Number of events, fire service operations and average number of operations per event for various ranges of maximum (a) 24 h (R24) and (b) 10 min (R10) accumulated rain (in mm).
1996). This is in accordance with previous analysis of histor-ical floods in Greece, which concluded that autumn was the season with the richest flood record for the period 1880–2010 (Diakakis et al., 2012). The high impact of February flash floods is mostly due to one event that occurred in 2013 and provoked more than 600 operations. Similarly, one event that occurred in October of 2014 caused 500 operations. Over-all, the highest R24 record was 186 mm, observed during an event that caused 118 operations by the fire service and had a quite low R10 (3.2 mm in 10 min). Actually, the correlation between R24 and R10 is weak (ρ=0.32, p< 0.05), while most of the high R10 values relate to R24 being less than 70 mm.
0 200 400 600 800 1000 1200 0 2 4 6 8 10
1 2 3 4 5 6 7 8 9 10 11 12
N u m b er o f o p er at io n s N u m b er o f ev en ts Month
Number of events Operations
Figure 6. Monthly distribution of the number of flash flood events that occurred in the Athens-suburbs region and fire service opera-tions.
Table 2. Correlation (Spearman’s rank coefficient,ρ) between the number of the fire service operations and the maximum rainfall in various time intervals.
Maximum rainfall R24 R12 R60 R30 R10
(time interval) (24 h) (12 h) (60 min) (30 min) (10 min)
Operations
Athens-suburbs 0.61∗∗∗ 0.58∗∗∗ 0.40∗∗ 0.37∗∗ 0.31∗
Athens city 0.85∗∗ 0.85∗∗ 0.85∗∗ 0.83∗∗ 0.69∗
∗p< 0.05,∗∗p< 0.01,∗∗∗p< 0.001.
best represents the magnitude of the impact, at least when considering only the flooded properties, is reasonable since the calculation concerns the entire Athens-suburbs region, which includes, however, areas of unique regional vulnera-bility that may respond differently to rainfall of the same in-tensity. These differences, however, tend to become smoother as the accumulation period increases and the various small-scale intensities are normalized.
The significance of the regional vulnerability should be further studied by focusing on the sub-areas of the Athens-suburbs region. However, what is known with certainty is the number of operations per event as well as the areas the event affected, while the exact allocation of the operations is not known. Therefore, to minimize the uncertainty in the esti-mated results, we attempted to study separately only the city of Athens, focusing on the events that affected the centre, south and east of the municipality of Athens together. This is actually the most populated region in Attica and Greece, ex-hibiting also the highest frequency of damaging flash flood events, while the network of rain gauges is denser compared to the other areas examined. Some of the events incorporated in the specific analysis have also affected surrounding areas, thus there might be an overestimation of the assigned num-ber of operations. However, when focusing on these neigh-bouring areas together, the number of operations is strongly correlated with all the durations of accumulated
precipita-tion (ρ0.69–0.85), the R10 included. Correlation results are included in Table 2. It is obvious that analysis on a more lo-cal slo-cale permits better capturing the effect of the volume of rainfall to the magnitude of impact and allows for considera-tion of short-duraconsidera-tion rainfall in the examinaconsidera-tion of the flash flood impact, as long as a sufficient network of rain gauges exists.
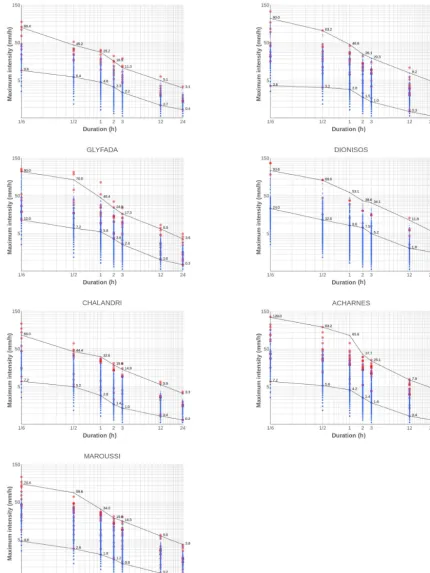
4.2 Rainfall intensity thresholds for flood triggering, at regional level
The results of the previous section raise the question of whether rainfall intensity thresholds can be defined above which flooding is probable or even certain for some areas and of whether short-duration rain intensities can reliably indicate risk of flooding. For that, the entire time series of precipitation records (not only of the flood events) for differ-ent accumulation durations have been used and the respective peak rainfall intensities are plotted, following the methodol-ogy introduced by Cannon et al. (2008) and Diakakis (2012). Graphs of rainfall intensity versus duration have been devel-oped for each one of the sub-areas specified in Fig. 2 and il-lustrate the peak rainfall intensities recorded by the most rep-resentative rain gauges. Flash flood occurrence is highlighted in red. As expected, rainfall intensity is falls as accumulation duration increases. The goal is to distinguish, if possible, two clear thresholds (denoted by the black lines in Fig. 7) that di-vide the graph into three parts: (a) the lower one includes peak intensity values that did not lead to flooding throughout the studied period; (b) the middle part includes peak inten-sities that either did or did not lead to flooding; and (c) the upper part includes peak intensities that always led to flood-ing.
Results vary considerably depending on the area examined and the local vulnerability, as well as on the density, location and record length of the representative rain gauges. Graphs on which extremely low rainfall intensities are shown to cor-respond to flood occurrence indicate a poor relationship be-tween the flooding event and one or more of the rain gauges that represent the studied area. One reason for this inconsis-tency may be the long distance of the gauge from the flooded area; it is even possible for a flash flood to be caused by the run-off of distant intensive rainfall occurring in higher terrain around the affected area.
rainfall intensity values. Contrariwise, areas such as Holar-gos and Glyfada are obviously not well represented by the existing rain gauges since their graphs present a wide and inconsistent spread of peak intensities. Low representativity is related either to the small operation record of rain gauges or to the local density of stations, in some cases too low to cover adequately the entire area. It is also possible that some areas demonstrate particular vulnerability in some places that are prone to flooding even for low rainfall intensity. To cap-ture the specific local sensitivities to rainfall, it is obvious that a denser network of rain gauges is required. This applies in the areas of Chalandri and Maroussi, and it is even more necessary for Acharnes, Penteli and Dionisos due to the to-pographic features of the mountainous areas.
The areas of Ampelokipoi and Athens centre, opposite of what we would expect for the most intensively urbanized ar-eas, present a high rainfall intensity threshold above which flooding is likely to occur. Specifically, in the area of Am-pelokipoi no damaging flash flood occurred for a peak inten-sity less than 29 mm h−1for 10 min duration or 9 mm h−1for 1 h duration. Even though distribution of population has been found to be relevant to the frequency of flash flood events, it can only partly explain the flash flood thresholds. The thresh-old value – in other words the hazard intensity needed for a place to flood – may also be related to other factors, such as the drainage system effectiveness and the preparedness of the local authorities (Barrera-Escoda and Llasat, 2015). There-fore, there is not one simple answer to what the key drivers are behind vulnerability of an area. For highly urbanized ar-eas like the centre of Athens there is land cover and popula-tion density on the one hand, while on the other hand, as dis-cussed also by Brody et al. (2012), a more coordinated sys-tem of flood mitigation infrastructure due to greater resources may exist. Although the centre of Athens is not likely to flood if rainfall intensity is less than 22.8 mm h−1for 10 min dura-tion or 9.6 mm h−1for 1 h duration, it floods for intensities, of 63.3 mm h−1for 10 min duration or 24.4 mm h−1for 1 h du-ration, that are lower than the respective intensities for which other areas flood, showing a lower resistance of the system. Low threshold values above which flooding is most proba-ble could indicate some limits in the existing infrastructure to cope with the growth of population and materials exposed and, in any case, confirm the necessity for additional protec-tion measures and for the development of an effective warn-ing system.
According to the European Environmental Agency (EEA, 2010), the improvement of forecasting and early-warning systems is seen as the most effective way to mitigate the ef-fects of flash floods. Early warning for flash floods is pro-vided in Greece, based on the weather forecasts, and it is communicated via the media. However, not only the spatial scale of the numerical weather prediction models but also the uncertainty in the quantitative precipitation forecasts do not allow for the risk estimation at local level. For that reason, a dense network of automatic surface meteorological stations
providing real-time 10 min accumulated rainfall and inten-sity observations could constitute a supplementary tool for early warning. Standardization of regional rainfall thresholds in several time intervals could therefore be a very useful tool during a rainfall event. Evidently, what is required in order to produce reliable thresholds on a local level is a denser net-work of rain gauges as well as long-period data. According to the rain intensity–duration graphs produced in the present study, the rainfall thresholds for flood triggering for the areas around Athens city and Hymettus could be used for the needs of an early-warning system, while for the other areas under examination a denser rain gauge network is required in order to obtain more robust results.
5 Concluding remarks
The objective of this study was to perform an analysis of the flash flood occurrence in an urbanized region, in an effort to identify triggering rainfall thresholds, as well as the ef-fect of the rainfall hazard indicators to the magnitude of the induced impact, considering factors that influence the local vulnerability, such as the population distribution and the ge-ographical features. A major contribution of this paper is that it provides extensive information on the flash flood events of a 10-year period, at the very local level of the most highly urbanized area of Greece, the urban part of the Attica pre-fecture. This information is considered particularly useful in the context of an integrated approach of the assessment and management of flood risks (EEA, 2010). Moreover, the syn-thesis of flash flood impact data and complete rainfall records allows the investigation of local rainfall thresholds related to the occurrence of damaging flooding.
The most robust results in what concerns the rainfall inten-sity thresholds have been produced for the centre of Athens, the area that suffers most from damaging flash flood events. The respective rain gauges have been found to be representa-tive of the area, and the estimated thresholds indicate that the city centre manages to resist very low rainfall intensities, but its resistance has a certain limit above which flooding seems to be the most probable scenario. It is in the authors’ future plans to evaluate in practice the rainfall thresholds estimated and improve their reliability by the increase in the precipita-tion data series, as well as the expansion of the meteorologi-cal network.
Consideration of the local particularities led to conclusions regarding the rainfall hazard at a local level and the impli-cation of urbanization for the coping capacity. The analy-sis showed that reliability of these thresholds depends a lot on the representativity of the existing rain gauge network in terms of density, location and record length. The ongoing ex-pansion of the network operated by the National Observatory of Athens ensures the future collection of long-term data, which will enhance the accuracy of defined rainfall thresh-olds associated with flooding and will permit further assess-ment of changes in the communities’ exposure and resiliency.
Acknowledgements. This research has been partly financed by the “Development Proposals of Research Entities – KRIPIS” framework, which is funded by National Programme “Competitive-ness and Entrepreneurship”, Action: “THESPIA – Development of synergistic and integrated methods and tools for monitoring, management and forecasting of Environmental parameters and pressures”. The authors acknowledge the Hellenic Fire Service for the provision of statistical data on the operations made due to harmful weather events. Finally the Laboratory of Hydrology and Water Resources Management of the National Technical University of Athens is acknowledged for the supply of precipitation measure-ments from 10 stations in the study area.
Edited by: B. D. Malamud
Reviewed by: M. Mergili and one anonymous referee
References
Amaro, J., Gayà, M., Aran, M., and Llasat, M. C.: Pre-liminary results of the Social Impact Research Group of MEDEX: the request database (2000–2002) of two Meteoro-logical Services, Nat. Hazards Earth Syst. Sci., 10, 2643–2652, doi:10.5194/nhess-10-2643-2010, 2010.
Barberia, L., Amaro, J., Aran, M., and Llasat, M. C.: Social impact analysis of two heavy rain events in Catalonia: 14 and 15 July 2001 and 3 April 2002, Plinius Conference on Mediterranean Storms, Disasters and Climate Change: knowing how to adapt, Savona, Italy, 7–9 September 2011, Programme Book, contribu-tion 13–57, 2011.
Barbería, L., Amaro, J., Aran, M., and Llasat, M. C.: The role of different factors related to social impact of heavy rain events:
considerations about the intensity thresholds in densely pop-ulated areas, Nat. Hazards Earth Syst. Sci., 14, 1843–1852, doi:10.5194/nhess-14-1843-2014, 2014.
Barrera-Escoda, A. and Llasat, M. C.: Evolving flood patterns in a Mediterranean region (1301–2012) and climatic factors – the case of Catalonia, Hydrol. Earth Syst. Sci., 19, 465–483, doi:10.5194/hess-19-465-2015, 2015.
Bracken, L. J., Cox, N. J., and Shannon, J.: The relationship be-tween rainfall inputs and flood generation in south–east Spain, Hydrol. Process., 22, 683–696, doi:10.1002/hyp.6641, 2008. Brody, S. D., Blessing, R., Sebastian, A., and Bedient, P.:
Delineat-ing the reality of flood risk and loss in Southeast Texas, Natural Hazards Review, 14, 89–97, 2012.
Cannon, S. H., Gartner, J. E., Wilson, R. C., Bowers, J. C., and Laber, J. L.: Storm rainfall conditions for floods and de-bris flows from recently burned areas in southwestern Col-orado and southern California, Geomorphology, 96, 250–269, doi:10.1016/j.geomorph.2007.03.019, 2008.
Carpenter, T., Sperfslage, J., Georgakakos, K., Sweeney, T., and Fread, D.: National threshold runoff estimation utilizing GIS in support of operational flash flood warning systems, J. Hydrol., 224, 21–44, 1999.
CRED: Disaster data: A balanced perspective, CRED Crunch, Cen-tre for Research on the Epidemiology of Disasters, Issue No. 17, Brussels, 2009.
Diakakis, M.: Rainfall thresholds for flood triggering. The case of Marathonas in Greece, Nat. Hazards, 60, 789–800, doi:10.1007/s11069-011-9904-7, 2012.
Diakakis, M., Mavroulis, S., and Deligiannakis, G.: Floods in Greece, a statistical and spatial approach, Nat. Hazards, 62, 485– 500, doi:10.1007/s11069-012-0090-z, 2012.
Du, S., Shi, P., Van Rompaey, A. and Wen, J.: Quantifying the im-pact of impervious surface location on flood peak discharge in urban areas, Nat. Hazards, 76, 1457–1471, doi:10.1007/s11069-014-1463-2, 2015.
EEA: Mapping the impacts of natural hazards and technological ac-cidents in Europe, European Environmental Agency, Technical report No. 13/2010, Copenhagen, doi:10.2800/62638, 2010. Gaume, E., Bain, V., Bernardara, P., Newinger, O., and Barbuc, M.:
A compilation of data on European flash floods, J. Hydrol., 367, 70–78, 2009.
Georgakakos, K.: Analytical results for operational flash flood guidance, J. Hydrol., 317, 81–103, doi:10.1016/j.jhydrol.2005.05.009, 2006.
Guzzetti, F., Peruccacci, S., Rossi, M., and Stark, C. P.: The rainfall intensity–duration control of shallow landslides and debris flows: an update, Landslides, 5, 3–17, doi:10.1007/s10346-007-0112-1, 2008.
HAIC: Natural Hazards and Riots in Greece 1993–2014, Hellenic Association of Insurance Companies, Athens, 2015.
Jansa, A., Alpert, P., Arbogast, P., Buzzi, A., Ivancan-Picek, B., Kotroni, V., Llasat, M. C., Ramis, C., Richard, E., Romero, R., and Speranza, A.: MEDEX: a general overview, Nat. Hazards Earth Syst. Sci., 14, 1965–1984, doi:10.5194/nhess-14-1965-2014, 2014.
Kandilioti, G. and Makropoulos, C.: Preliminary flood risk as-sessment: the case of Athens, Nat. Hazards, 61, 441–468, doi:10.1007/s11069-011-9930-5, 2012.
Kotroni, V., Lagouvardos, K., Kallos, G., and Ziakopoulos, D.: Se-vere flooding over central and southern greece associated with pre-cold frontal orographic lifting, Q. J. Roy. Meteor. Soc., 125, 967–991, doi:10.1002/qj.49712555511, 1999.
Koussis, A., Lagouvardos, K., Mazi, K., Kotroni, V., Sitzmann, D., Lang, J., Zaiss, H., Buzzi, A., and Malguzzi, P: Flood Forecasts for Urban Basin with Integrated Hydro-Meteorological Model, J. Hydrol. Eng., 8, 1–11, 2003.
Lagouvardos, K. and Kotroni, V.: TRMM and Lightning Observa-tions of a Low-Pressure System over the Eastern Mediterranean, B. Am. Meteorol. Soc., 88, 1363–1367, doi:10.1175/bams-88-9-1363, 2007.
Lagouvardos, K., Kotroni, V., Dobricic, S., Nickovic, S., and Kal-los, G.: The storm of October 21–22, 1994, over Greece: Obser-vations and model results, J. Geophys. Res.-Atmos., 101, 26217– 26226, doi:10.1029/96jd01385, 1996.
Lastoria, B., Simonetti, M. R., Casaioli, M., Mariani, S., and Mona-celli, G.: Socio-economic impacts of major floods in Italy from 1951 to 2003, Adv. Geosci., 7, 223–229, 2006,
http://www.adv-geosci.net/7/223/2006/.
Llasat, M. C., López, L., Barnolas, M., and Llasat-Botija, M.: Flash-floods in Catalonia: the social perception in a context of changing vulnerability, Adv. Geosci., 17, 63–70, 2008,
http://www.adv-geosci.net/17/63/2008/.
Llasat, M. C., Llasat-Botija, M., Barnolas, M., López, L., and Altava-Ortiz, V.: An analysis of the evolution of hydrom-eteorological extremes in newspapers: the case of Catalo-nia, 1982–2006, Nat. Hazards Earth Syst. Sci., 9, 1201–1212, doi:10.5194/nhess-9-1201-2009, 2009.
Llasat, M. C., Llasat-Botija, M., Petrucci, O., Pasqua, A. A., Rosselló, J., Vinet, F., and Boissier, L.: Towards a database on societal impact of Mediterranean floods within the framework of the HYMEX project, Nat. Hazards Earth Syst. Sci., 13, 1337– 1350, doi:10.5194/nhess-13-1337-2013, 2013.
Martina, M. L. V., Todini, E., and Libralon, A.: A Bayesian deci-sion approach to rainfall thresholds based flood warning, Hydrol. Earth Syst. Sci., 10, 413–426, doi:10.5194/hess-10-413-2006, 2006.
Norbiato, D., Borga, M., and Dinale, R.: Flash flood warning in ungauged basins by use of the flash flood guidance and model-based runoff thresholds, Meteorol. Appl., 16, 65–75, doi:10.1002/met.126, 2009.
Papagiannaki, K., Lagouvardos, K., and Kotroni, V.: A database of high-impact weather events in Greece: a descriptive impact anal-ysis for the period 2001–2011, Nat. Hazards Earth Syst. Sci., 13, 727–736, doi:10.5194/nhess-13-727-2013, 2013.
Price, C., Yair, Y., Mugnai, A., Lagouvardos, K., Llasat, M. C., Michaelides, S., Dayan, U., Dietrich, S., Di Paola, F., Galanti, E., Garrote, L., Harats, N., Katsanos, D., Kohn, M., Kotroni, V., Llasat-Botija, M., Lynn, B., Mediero, L., Morin, E., Nicolaides, K., Rozalis, S., Savvidou, K., and Ziv, B.: Using Lightning Data to Better Understand and Predict Flash Floods in the Mediter-ranean, Surv. Geophys., 32, 733–751, doi:10.1007/s10712-011-9146-y, 2011a.
Price, C., Yair, Y., Mugnai, A., Lagouvardos, K., Llasat, M. C., Michaelides, S., Dayan, U., Dietrich, S., Galanti, E., Garrote, L., Harats, N., Katsanos, D., Kohn, M., Kotroni, V., Llasat-Botija, M., Lynn, B., Mediero, L., Morin, E., Nicolaides, K., Rozalis, S., Savvidou, K., and Ziv, B.: The FLASH Project: using lightning data to better understand and predict flash floods, Environ. Sci. Policy, 14, 898–911, doi:10.1016/j.envsci.2011.03.004, 2011b. Špitalar, M., Gourley, J. J., Lutoff, C., Kirstetter, P.-E., Brilly, M.,
and Carr, N.: Analysis of flash flood parameters and human im-pacts in the US from 2006 to 2012, J. Hydrol., 519, 863–870, doi:10.1016/j.jhydrol.2014.07.004, 2014.