PH.D. THESIS
ANALYZING THE
B
EHAVIOR OFSTUDENTS
R
EGARDINGLEARNING
ACTIVITIES, BADGES,
ANDACADEMIC
DISHONESTY IN
MOOC
ENVIRONMENTS
Author: Jos´e Antonio Ruip´erez Valiente Director: Dr. Pedro Jos´e Mu˜noz Merino
DEPARTMENT OF TELEMATIC ENGINEERING
Prepared by
Jos´e Antonio Ruip´erez Valiente
Under the advice of
Dr. Pedro Jos´e Mu˜noz Merino
Departamento de Ingenier´ıa Telem´atica, Universidad Carlos III de Madrid
Date: abril, 2017
Web/contact: [email protected]
http://people.networks.imdea.org/˜joseantonio ruiperez/
Autor: Jos´e Antonio Ruip´erez Valiente Director: Dr. Pedro Jos´e Mu˜noz Merino
Firma del tribunal calificador:
Presidente:
Vocal:
Secretario:
Calificaci´on:
compa˜neros de departamento y laboratorio con los que he compartido estos momentos y parte de mi vida, algunos como Guille, Dmitry, Jaime, Valent´ın, Mar´ıa, Alicia, Jose A. Gasc´on, Jose A. D´ıaz, Ruth, Estrella, David, Carlos Alario, Derick, Isra, Ramona, Salva y muchos m´as. En especial a mis dos pilares en esta etapa, Patri y Diego, gracias por haber estado siempre ah´ı.
My most sincere gratitude to the people I spent time with during my two research stays. My deepest thanks to David E. Pritchard to provide me with the opportunity to spend 4 months in Boston at MIT, it has been an honor to work with you. To Giora Alexandron for his wonderful mentoring and companionship during those months and after. My gratitude to Dragan Gaˇsevi´c for enabling my visit to the University of Edinburgh and his always wise feedback, I understand now why you are such a renowned researcher in learning analytics. Special thanks to Srecko and Vita for their friendship and making me feel at home during my stay in Edinburgh, and also to the rest of wonderful PhD students I met there Wannisa, Mihaela and Nora’ayu.
Al centro de yoga ‘Aqu´ı y Ahora’ que me ha dado tanto balance en los ´ultimos a˜nos durante la tesis y a las maravillosas personas que all´ı he conocido como Vero, Sonia, Alberto y especialmente M´onica. Me gustar´ıa recordar en este agradecimiento a mis compa˜neros del Grado en la UCAM y del M´aster en la UC3M, porque con vosotros empez´o este camino. Al igual que a todos los amigos que conservo del colegio de Murcia y muchos de ellos desde los 4 an˜os, desde luego ellos s´ı que han visto todo el camino. A mi madre, padre y hermana, porque de lo poco inamovible y claro que tengo en mi vida, es que son lo m´as importante que tengo y siempre est´an ah´ı para apoyarme. A mi familia perruna Yuma y Lolita, y especialmente Sera, por todo lo que un perro ha ense˜nado a un humano, porque d´ıa tras d´ıa me recibes con tu mejor actitud y siempre me acompa˜nas tanto en los malos como en los buenos momentos. A mi abuela Queta, porque la ´ultima vez que te vi fue en mi graduaci´on del Grado y estabas muy feliz y sonriente, as´ı te recordar´e para el d´ıa que defienda esta tesis y me grad´ue como doctor. A mi abuelo Juan Antonio, si a alguien le tengo que dedicar esta tesis es a ´el, porque s´e que le hace inmensamente feliz y orgulloso. A mi abuela Conchita y mi t´ıa Ana, porque vosotras me criasteis y me hicisteis quien soy, sois un ejemplo de motivaci´on. Tambi´en quiero extender este agradecimiento al resto de mi familia.
the collection of large and rich data samples regarding the interaction of students with these edu-cational online environments.
We have detected different areas in the literature that still need improvement and more re-search studies. Particularly, in the context ofMOOCsandSmall Private Online Courses (SPOCs), where we focus our data analysis on the platforms Khan Academy, Open edX and Coursera. More specifically, we are going to work towards learning analytics visualization dashboards, carrying out an evaluation of these visual analytics tools. Additionally, we will delve into the activity and behavior of students with regular and optional activities, badges and their online academically dishonest conduct. The analysis of activity and behavior of students is divided first in exploratory analysis providing descriptive and inferential statistics, like correlations and group comparisons, as well as numerous visualizations that facilitate conveying understandable information. Second, we apply clustering analysis to find different profiles of students for different purposes e.g., to an-alyze potential adaptation of learning experiences and pedagogical implications. Third, we also provide three machine learning models, two of them to predict learning outcomes (learning gains and certificate accomplishment) and one to classify submissions as illicit or not. We also use these models to discuss about the importance of variables.
Finally, we discuss our results in terms of the motivation of students, student profiling, instructional design, potential actuators and the evaluation of visual analytics dashboards providing different recommendations to improve future educational experiments.
Keywords: Learning analytics; educational data mining; information visualization; MOOCs;
SPOCs; behavioral modeling; machine learning.
abiertos masivos en l´ınea (MOOCs), ha permitido que se recojan grandes y ricas muestras de datos sobre la interacci´on de los estudiantes con estos entornos virtuales de aprendizaje.
Nosotros hemos detectado diferentes ´areas en la literatura que a´un necesitan de mejoras y del desarrollo de m´as estudios, espec´ıficamente en el contexto de MOOCs y cursos privados peque˜nos en l´ınea (SPOCs). En la tesis nos hemos enfocado en el an´alisis de datos en las plataformas Khan Academy, Open edX y Coursera. M´as espec´ıficamente, vamos a trabajar en interfaces de vi-sualizaciones de anal´ıtica de aprendizaje, llevando a cabo la evaluaci´on de estas herramientas de anal´ıtica visual. Adem´as, profundizaremos en la actividad y el comportamiento de los estu-diantes con actividades comunes y opcionales, medallas y sus conductas en torno a la deshon-estidad acad´emica. Este an´alisis de actividad y comportamiento comienza primero con an´alisis exploratorio proporcionando variables descriptivas y de inferencia estad´ıstica, como correlaciones y comparaciones entre grupos, as´ı como numerosas visualizaciones que facilitan la transmisi´on de informaci´on inteligible. En segundo lugar aplicaremos t´ecnicas de agrupamiento para encon-trar distintos perfiles de estudiantes con diferentes prop´ositos, como por ejemplo para analizar posibles adaptaciones de experiencias educativas y sus implicaciones pedag´ogicas. Tambi´en pro-porcionamos tres modelos de aprendizaje m´aquina, dos de ellos que predicen resultados finales de aprendizaje (ganancias de aprendizaje y la consecuci´on de certificados de terminaci´on) y uno para clasificar que ejercicios han sido entregados de forma deshonesta. Tambi´en usaremos estos tres modelos para analizar la importancia de las variables.
Finalmente, discutimos todos los resultados en t´erminos de la motivaci´on de los estudiantes, diferentes perfiles de estudiante, dise˜no instruccional, posibles sistemas actuadores, as´ı como la evaluaci´on de interfaces de anal´ıtica visual, proporcionando recomendaciones que pueden ayudar a mejorar futuras experiencias educacionales.
Palabras clave: Anal´ıtica de aprendizaje; miner´ıa de datos educacionales; visualizaci´on
de informaci´on; MOOCs; SPOCs; modelado de comportamiento; aprendizaje m´aquina.
Abstract IX
Resumen XI
Table of Contents XIII
List of Tables XVII
List of Figures XVII
1. Introduction 1
1.1. Motivation . . . 1
1.2. Objectives . . . 4
1.3. Dissertation Outline . . . 6
I Background and Method 9 2. Related Work 11 2.1. MOOCs and SPOCs . . . 11
2.2. Learning Analytics and Educational Data Mining . . . 13
2.3. Educational Visualization Dashboards and its Evaluation . . . 14
2.4. Analysis of Learning Outcomes . . . 17
2.5. Use of Regular and Optional Activities . . . 19
2.6. Gamification and Use of Badges . . . 22
2.7. Academic Dishonesty and Illicit Collaboration . . . 24
3. Method 27 3.1. Tools . . . 29
3.1.1. MOOC Platforms . . . 30
3.1.2. Learning Analytics Dashboards . . . 33
3.1.3. Technologies, Statistical Methods and Software . . . 36
3.2. Case Studies . . . 37
3.2.1. SPOCs: Physics, Chemistry and Math with Khan Academy . . . 37
3.2.2. MOOC ‘The Spain of Don Quixote’ on edX . . . 39
3.2.3. MOOC ‘Mechanics Review’ on edX . . . 40
3.2.4. MOOCs ‘Music Theory’ and ‘Introduction to Philosophy’ on Coursera . 40 3.3. Selected indicators . . . 40
3.3.1. Use of the Platform . . . 41
3.3.2. Correct Progress in the Platform . . . 42
3.3.3. Time in the Platform and its Distribution . . . 43
3.3.4. Problem and Submission Features . . . 43
3.3.5. Behavior Solving Exercises . . . 44
3.3.6. Behavior with Badges . . . 45
3.3.7. Online Academic Dishonesty and Collaboration . . . 46
II Analysis and Statistical Inference from Educational Data 51 4. Exploratory Analysis 53 4.1. Use of the Platform and Student Behavior . . . 54
4.2. Regular Courseware Activities . . . 55
4.2.1. Overview of the Effectiveness with Exercises and Videos . . . 55
4.2.2. Relationship of Effectiveness with Other Metrics . . . 56
4.3. Optional Activities . . . 57
4.3.1. Overview of the Use of Optional Activities . . . 57
4.3.2. Relationship of Optional Activities with Other Metrics . . . 59
4.3.3. Categorical Variable Analysis . . . 61
4.4. Use of Badges and Gamification Behavior . . . 62
4.4.1. Overview of Badge Activity . . . 62
4.4.2. Influence of Factors on Badge Count . . . 63
4.4.3. Distribution of the Badge Indicators . . . 65
4.4.4. Relationship of Badge Indicators with Other Selected Indicators . . . 67
4.5. Online Academic Dishonesty and Collaboration . . . 69
4.5.1. Close Submitters . . . 69
4.5.2. CAMEO . . . 74
5. Clustering and Student Profiling 81 5.1. Based on Use of Regular and Optional Activities . . . 81
5.2. Based on Behavior with Badges . . . 84
6.1. Prediction of Learning Gains . . . 97
6.1.1. ML Method and Training . . . 98
6.1.2. Results and Interpretability . . . 100
6.2. Prediction of Certificate Accomplishment . . . 103
6.2.1. ML Method and Training . . . 103
6.2.2. Results and Interpretability . . . 105
6.3. Classification of CAMEO Submissions . . . 107
6.3.1. ML Method and Training . . . 107
6.3.2. Results and Interpretability . . . 109
III Recommendations to Improve Learning Processes and Summary of Con-clusions 115 7. Discussion and Recommendations to Improve Learning Processes 117 7.1. Amount of Activity and Motivations . . . 117
7.2. Student Profiling Outcomes . . . 122
7.3. Instructional Design . . . 125
7.4. Towards Actuators . . . 128
7.5. Evaluation of Visual Analytics Dashboard . . . 129
7.5.1. Overview of the Survey . . . 130
7.5.2. Discussion about the Survey . . . 130
8. Conclusions and Future Work 133 8.1. Conclusions . . . 133
8.1.1. Final Remarks and Limitations . . . 133
8.1.2. Research Projects . . . 137
8.1.3. Research Stays . . . 138
8.2. Future Work . . . 139
Appendix A. Evaluation Questionnaire for ANALYSE 143 Appendix B. Publications by the Author 147 B.1. JCR-Indexed . . . 147
B.2. International Conferences . . . 148
Abbreviations 152
Nomenclature 155
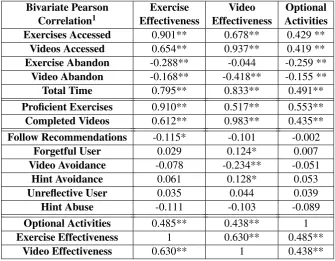
4.1. Bivariate Pearson correlation of the effectiveness and use of optional activities with the rest of indicators. . . 58 4.2. Percentage of students who used each optional activity. . . 59 4.3. Comparison between the use of regular learning activities versus the use of
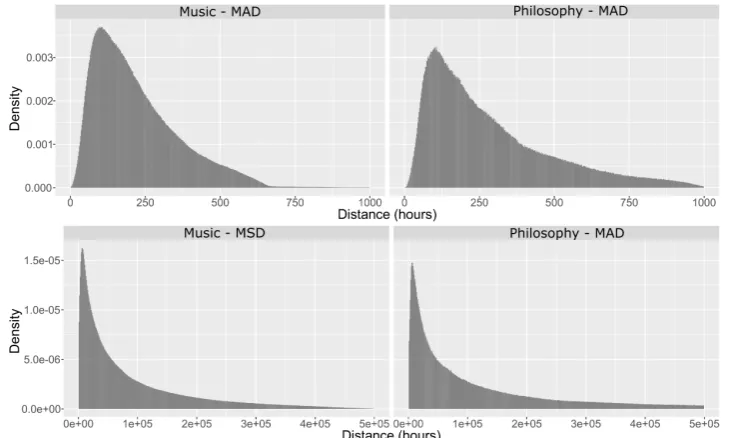
op-tional activities . . . 59 4.4. Pearson and partial correlations of proficient exercises with optional activities. . . 61 4.5. Log linear analysis of optional activities as categorical variables . . . 62 4.6. Bivariate Pearson correlation of the badge metrics with the rest of indicators. . . 68 4.7. Number of triplets, MAD and MSD values after applying different quantiles as
threshold of the distance distribution for music and philosophy courses. . . 71 4.8. Cross tabulation of the variables certificate, close submitter and course. Only
accounts that submitted all quizzes are included. . . 73 4.9. Independent unpairedt-tests for the different variables of the study comparing
close submitter and the rest of accounts. . . 74 4.10. Amount of CAMEO by certificate and non-certificate earners . . . 75 5.1. Example couple for each one of the cluster associations found. . . 93 5.2. Description of the extracted indicators for each member of the two selected
com-munities of accounts. . . 95 6.1. Model summary of the linear regression model. . . 101 6.2. Unstandardized and standardized coefficients of the regression models. . . 102 6.3. Distribution of certificate and non-certificate earners in the train and test datasets. 105 6.4. Distribution of non-CAMEO and CAMEO submissions in the train and test datasets.109 6.5. Confusion matrix applying the model to the test dataset. . . 110 6.6. Quality metrics of the RF model applied to the test dataset. . . 110 7.1. Results of the evaluation of ANALYSE based on the questions in Appendix A. . 132
shows avatar personalization and badge display, Subplot (b) shows feedback and votes functionality and Subplot (c) shows goals system. . . 31 3.3. Visualization examples of ALAS-KA, on the left regarding the time distribution
of a single student and on the right the use of the platform of all the class. . . 35 3.4. Interface of ANALYSE and visualization example of ‘Course Summary’ plot. . . 36 3.5. Subplot (a) shows an example of the original badge system of Khan Academy
whereas Subplot (b) shows the adapted badge system for our case studies with the newtopic badges. . . 38 3.6. Diagram showing two different CAMEO patterns: immediate (left chart) and
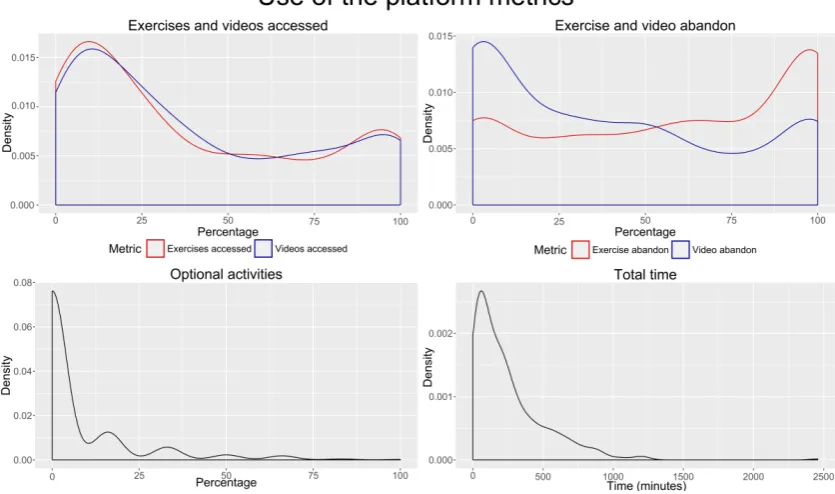
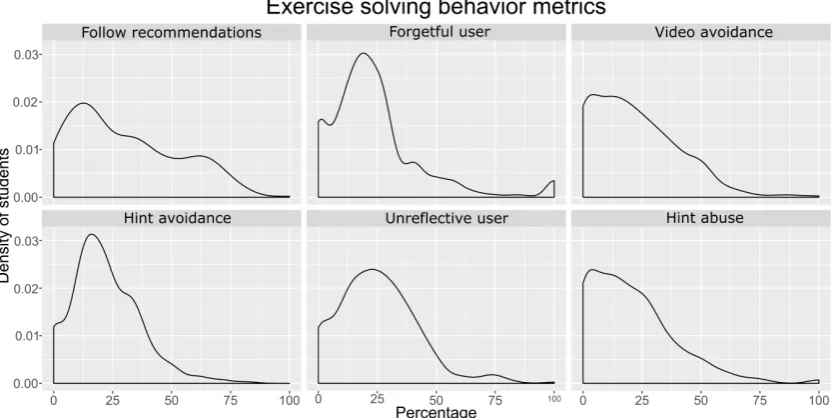
batchmode (right chart). . . 49 4.1. Density distribution of the indicators related to the use of the platform. . . 54 4.2. Density distribution of indicators representing the behavior of students when
solv-ing exercises. . . 55 4.3. Density distribution of the effectiveness and the completed resources among the
different students. . . 56 4.4. Effectiveness scatterplot and types of students according to their effectiveness. . . 57 4.5. Histogram representation of the amount of badges (left) and amount of different
badge types (right) earned by each student. . . 63 4.6. Boxplot visualization representing the percentage of badges earned by each
stu-dent divided by badge category (x-axis). . . 64 4.7. Influence of factors (percentage correct and location within course structure) in
amount of badges triggered by exercises. . . 66 4.8. Distribution of the different badge metrics. . . 67 4.9. Density histogram distribution of the distance vectors d~M ADmus (upper left plot),
~
dM SDmus (bottom left plot),d~M ADphi (upper right plot) andd~M SDphi (bottom right plot). 70 4.10. Density histogram distribution of the MAD distance of the triplets below the
threshold (close submitters) separated by course. . . 71
4.11. Couples and communities detected from the population of accounts detected as
close submitters after applying graph theory. . . 72
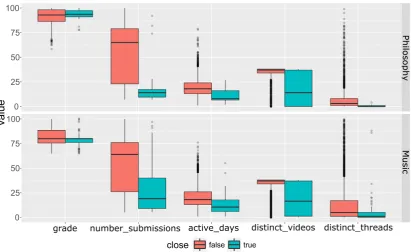
4.12. Boxplot visualization comparing the student features of the close submitters and the rest of accounts separate by course. . . 73
4.13. Amount of CAMEO among students. . . 75
4.14. Subplot (a) shows average time for correct attempt vs. performance at first attempt for certificate earners; size of red dot indicates amount of CAMEO. Subplot (b) shows the density distribution of the performance at first attempt for the master, harvester and rest of accounts separately. . . 76
4.15. Evolution of the amount of attempted, correct and harvested questions, as well as percentage of certificates earned, over the course timeline. . . 77
4.16. Comparison of master accounts certificate earners vs. non-certificate earners in terms of correct and harvested questions, over the course timeline. . . 78
4.17. Selected students that represent archetypal CAMEO behavioral profiles. . . 79
5.1. Boxplot visualization of the clustering results based on the use of regular and optional activities. . . 82
5.2. Parallel coordinates visualization of the use of regular and optional activities after clustering. . . 83
5.3. Line visualization for selected students that represent different interaction profiles. 84 5.4. Boxplot visualization of the indicators separated by cluster. The upper plot shows the badge metrics and the bottom plot the evaluation fields. . . 85
5.5. Parallel coordinates visualization of the badge metrics of all students separated by cluster. . . 86
5.6. Radar chart representing five students with different profiles of badge behavior. . 88
5.7. Clustering results showing a boxplot visualization of the input variables separated by cluster and course. . . 89
5.8. Visualization of the couples and bigger communities detected by the algorithm and colored based on their cluster assignment. . . 91
5.9. Time difference between the submissions of each one of the members of the com-munity for each quiz. . . 95
6.1. Evaluation results in the test dataset in terms of F1-score and AUC metrics for the models for each week. . . 105
6.2. Evolution of the performance in the test dataset of the selected GBM model over the weeks. . . 106
6.3. Evolution of variable importance of the GBM model in each week. . . 107
6.4. Descendent ranking of variables in terms of VI. . . 111
6.5. Nested collection of random forest models. . . 112
Contents
1.1. Motivation . . . 1 1.2. Objectives . . . 4 1.3. Dissertation Outline . . . 6
This initial Chapter1establishes the research framework of this dissertation. First in Section 1.1we present the initial motivations to carry out our research. Section1.2states the objectives that we aimed to accomplish during this dissertation. Finally, in Section 1.3 we describe the outline of the rest of the document.
1.1.
Motivation
Over the last decade the production of data has expanded at a stunning fast pace. This has been due to, among other reasons, switching from analog to digital technologies as well as the increased data generation of corporations and individuals (CSC,2012). With this expansion new terms appeared such as big data which is originally attributed to John R. Mashey (Mashey,1997), and addresses the threeVs problems of analyzing large magnitudes of data (volume), data is much more diverse taking different forms and coming from different sources (variety) and data is gener-ated in real time and might need to be processed immediately (velocity) (Intel,2013). With the big data phenomenon many research lines have arisen to try to get advantage of the data explosion. Some application examples include the acceleration of value and innovation in healthcare now that all medical records and pharmaceutical information are being digitalized (Groves, Kayyali, Knott & Kuiken, 2016), regarding how to use Internet of Things and big data to build the next generation of smart cities (Strohbach, Ziekow, Gazis & Akiva,2015), to improve web advertising (Chandramouli, Goldstein & Duan, 2012), and also in terms of security regarding how to effec-tively protect all these data (Mahajan, Gaba & Chauhan,2016). It is not only research but from banks to retail we can see how all industry areas are starting to take advantage of their data to
improve their revenue, quality of their business and satisfaction of their users and customers, such as via personalized product recommendations (Amazon), audiovisual content recommendations (Spotify or Netflix), self-awareness of your own activity (Fitbit), targeted advertising (AdWords or ExoClick), contact suggestions (Facebook, Twitter or LinkedIn), weather forecasting (The Weather Company), to enhance loyalty programs (Kroger) or detection of image types (Google Images), among many others.
The potential areas of improvement that big data can bring to education are wide and can affect different end-users. For example, administrators can benefit from a better resource allocation and academic programming, students with adapted learning pathways and personalized feedback or instructors with information to improve teaching and enabling them to detect students at risk (Daniel,2015). Additionally, we should note out the importance also of e-learning initiatives for corporate training (Urdan & Weggen,2000), and the potential impact that big data can have to help evolve this corporate training1. However, the integration of data-driven approaches in education has evolved more slowly than in other areas. The initial data mining approaches in education were based on analyzing demographics and performance in different subjects, for example, to create meaningful learning outcome typologies or to predict academic outcomes that can enable interventions (Jing, 2004). As web-based education, such as the use of Learning Management Systems (LMSs) and otherVirtual Learning Environments (VLEs), became more frequent, the amount of data available grew exponentially in size, but also became much more rich in terms of the available details (i.e., all interactions of students with theVLEare stored as logs). Some of these initial Educational Data Mining (EDM)studies using data from web-based systems were related to the recommendation of activities and other educational resources or to visualize student activity (Romero & Ventura,2007). Over the last years a new disrupting phenomenon in online education and distance learning started as what have been commonly denominated asMOOCs.
MOOCs are defined as courses with a structured start and finish date, which might have a high number of learners (Massiveness), where the registration, access and participation of the activities is free (Open) and the whole course and interaction with the components and courseware is through the Internet (Online) (Siemens,2013).MOOCshad quite a disruptive effect on online education when they emerged. The New York Times even dubbed 2012 as “The Year of the MOOC”2and they received a lot of publicity worldwide. ManyMOOCplatforms started offering courses from leading universities such as Coursera 3 or edX 4 but also in collaboration with industry partners such as the case of Udacity5.MOOCshave many positive features and potential to be one of the main possibilities for learning from high quality universities, such as for example in developing countries (Liyanagunawardena, Williams & Adams,2013). The massive amount
widened the possibilities to collect large samples of data that can be more independent (students from all over the globe), in different data format (unstructured, structured, text log files), from different sources and functionalities (forums, wikis, exercises, videos, gamification and other external tools) and in many different topics (computer science, philosophy, art, life sciences, etc). Additionally, the web platforms where these courses are offered can adapt its functionality for each course, enabling a good framework for experimental design e.g., to implement A/B testing with different functionalities or course designs and analyze which of them can lead to better learning outcomes. These large data samples also provide the opportunity to establish deep and meaningful statistical significances and be moderately confident about the lessons learned. To analyze all these data we need a combination of theory, design and data mining techniques, and in order to fulfill these requisites the field ofLearning Analytics (LA)as an intersection between data science and learning sciences (Gaˇsevi´c, Kovanovi´c & Joksimovi´c,2017) has been gaining a lot of notoriety over the last years.
as LAsystems within the VLEs. Ultimately, this can facilitate the interaction of the different stakeholders with the information for decision making or other purposes.
Our motivations for the research in this dissertation are diverse. Data analysis inMOOC en-vironments is still in its early stage. Therefore we aim to carry out different studies to delve into different aspects of the behavior of students in these platforms, obtain relationships with other indicators and learning outcomes, so that we can obtain conclusions that can be used to improve the learning process. Furthermore, we want to work towards the evaluation of visual analytics dashboards in those environments to have a more clear evidence about which visualizations are usable, useful and effective for instructors and students. We want to delve into the activity and behavior of students with regular activities (e.g., exercises, videos, etc), optional activities (e.g., goals, setting up an avatar image, etc) and gamification features (e.g., badges, points, etc). We want to analyze the relationship between different indicators in order to delve into understanding student behavior and we will also look into clustering students based on these indicators, which can be helpful to profile them and use the different preferences to adapt their learning experiences. We would like to delve into the motivations of students based on these indicators, e.g., to analyze if students are earning badges on purpose or not, or why they are using optional activities. Addi-tionally, we want to develop prediction models of learning outcomes that can help to understand which of these variables and behaviors are positively or negatively correlated to learning achieve-ment. These findings might be useful for future early recommendation or warning system that can be part of the learning analytics platforms.
Furthermore, we want to delve into online academic dishonesty and illicit collaborations in MOOCs. Since these courses are completely online students are able to commit behaviors that are
prohibit such as creating several accounts or sharing their solutions with peers. MOOCsdeliver certificates of accomplishment to show that a student has achieved the level of proficiency and competencies given by a certain course. Nevertheless, many of these students might be deceiving the system and achieving these certificates illicitly which can cause a serious and grave problem to the certificate system. Additionally, the learning indicators of these students might represent outlying behaviors that are actually strongly correlated with success, hence leading to systematic bias in educational research studies. Moreover, literature reports that cheating behaviors lead to poor learning. Therefore, we think that is necessary to develop of algorithms and detectors that can help to detect students committing illicit behaviors to enable interventions, but also to remove their data when performing educational research. Finally, it would be valuable to provide instructional guidelines that can be used to reduce the level of cheating. In next Section1.2 we describe more specifically the objectives that we state for this dissertation.
1.2.
Objectives
behavior to infer their activity and motivations, instructional design recommendations, student profiling for adaptation purposes or guidelines to develop actuators such as recommendation or other warning systems, among other findings. More specifically, the objectives that we establish are as follow:
In the context of learning analytics dashboards that compute different learning indi-cators and show them in the form of visualizations, we will work towards the evaluation of the usability, usefulness and effectiveness of these dashboards.
Analyze the activity and the behavior of students when interacting with the platform, with emphasis on the use of regular and optional activities:
• Analyze the effectiveness and behavior of students with educational resources such as problems or videos.
• Analyze the use of optional activities finding also associations between the use of the different optional activities.
• Analyze the relationship of regular and optional activities with learning out-comes such as proficient exercises and learning gains, as well as with other metrics related to the learning process.
• Compare the use of regular and optional activities in self-regulated learning en-vironments.
• Apply clustering to identify common profiles of students in terms of their use of regular and optional activities.
• Build prediction models of learning gains and certificate accomplishment based on the interaction and behavior of students with the platform.
Analyze the activity and behavior of students with badges:
• Overview of the use of badges in self-regulated educational experiences. • Analysis of the influence of factors associated with the amount of badges trig-gered.
• Analysis of the badge metrics and behavior of students with badges to find the relationship with other variables and learning outcomes.
Analyze academic dishonesty and illicit collaboration behaviors inMOOC environ-ments:
• Design and implement algorithms to detect academic dishonesty and illicit col-laboration behaviors that are applicable to online environments.
• Compare students who are performing some unethical behavior with the rest of students in the course in terms of their indicators related to the learning process.
• Analyze different profiles of students committing unethical behaviors in online environments, as well as the potential motivations and impact on their learning pro-cess.
• Provide guidelines supported by our results in order to decrease the prevalence of academic dishonesty inMOOCsbased on instructional design
• Develop a machine learning classification model that can serve as a first step for a run-time detector as well as to analyze the importance of the different student and problem features.
The last step is to use all lessons learned in the previous objectives to provide recom-mendations that can be used to improve learning processes. These recomrecom-mendations should be related to the amount of activity and motivations of the behavior of students, about stu-dent profiling and how to use it for adaptation purposes, regarding potential improvements based on instructional design and some ideas toward building actuator systems.
1.3.
Dissertation Outline
The remainder of the dissertation is organized as follows:
Chapter2analyzes different studies related to the areas in relationship with this dissertation. We review basic concepts of MOOCs, LAand EDM. We explore different studies that imple-mented or evaluated visualization dashboards, and also studies regarding the use and behavior of users with regular and optional activities, gamification and academic dishonesty.
Chapter3sets up the framework of the dissertation. We describe the different tools that we use, the case studies that we analyze and the selected indicators that we use during this disserta-tion.
Chapter 4 is the first chapter of the results and presents some exploratory analysis of our findings such as visualizations, descriptive statistics and correlations of the different areas that we investigate during this dissertation.
Chapter5presents the clustering results to analyze the different profiles of students in terms of their behavior presenting some visualizations and examples of archetypal students.
Contents
2.1. MOOCs and SPOCs . . . 11 2.2. Learning Analytics and Educational Data Mining . . . 13 2.3. Educational Visualization Dashboards and its Evaluation . . . 14 2.4. Analysis of Learning Outcomes . . . 17 2.5. Use of Regular and Optional Activities . . . 19 2.6. Gamification and Use of Badges . . . 22 2.7. Academic Dishonesty and Illicit Collaboration . . . 24
This chapter introduces the related work that is connected with this dissertation. The chapter is divided into different sections that cover the different areas that have been researched and are in connection with the objectives. Sections2.1and2.2give an initial and general overview related toMOOCs,SPOCs,LAandEDMthat will help to frame the general context of this dissertation. Section2.3describes several visualization dashboards in educational contexts and evaluation re-sults of some of them. Section 2.4presents different studies that analyze learning outcomes in educational environments whereas Section2.5describes studies in the area of measuring use and effectiveness of students with regular and optional activities. Section2.6presents different studies in the area of gamification in education, focusing on the use and behavior of students with badges. Finally Section2.7finishes presenting an overview of academic dishonesty, gaming the system and collaboration, focusing on contemporary research in online environments.
2.1.
MOOCs and SPOCs
Masters(2011) seesMOOCsas the fourth stage in the progress of online education, which follows the previous stage that had LMSsas their central element. Some of the differences in the MOOCera is that teachers are not going to be monitoring all the actions of their students due to the massiveness, that learners must have a more active and independent learning, and the
effort and intensity of their interaction with theMOOCplatform. Literature shows thatMOOCs frequently combine learning technologies with learning activities. For example the use of short video lectures and automatic graded assignments is common (Voss,2013;Nicoar˘a,2013). The massiveness ofMOOCsmakes manual exercise grading difficult for instructors, therefore another viable option that is very extended inMOOCsis the use of peer review systems (O’Toole,2013). Additionally, we can find thatMOOCsfrequently enable additional communications tools, e.g., internal messaging but also external tools such Twitter or Facebook groups (Nicoar˘a,2013). It is also extended the use ofLAfunctionality (Voss,2013) and gamification approaches to motivate and engage students (Vaibhav & Gupta,2014). There are differentMOOC providers available, such as Udacity, edX or Coursera. EdX is one special case since it is the only provider that has open sourced the software that they used as a collaborative project called Open edX. From now on, the term edX is used to address the institution and Open edX the software. In our case during this dissertation we have explored data from Khan Academy, Open edX and Coursera. We believe that exploring data from different platforms can enable us to generalize better and to analyze functionalities only available in certain platforms.
SPOCs(Fox,2013) use similar technologies and courseware items thanMOOCs. However, the number of users is usually smaller and the access to these courses is private and controlled by the platform administrators. SPOCs can be used as supplement to classroom teaching, for on-campus courses or even professional training. SPOCsare usually applied in blended method-ologies where part the classroom lectures are available online but students still attend face-to-face classes for problem solving sessions and to solve doubts. This marriage of face-to-face classes andMOOCmaterials has the potential to maximize the strengths of traditional face-to-face classes while minimizing the potential weaknesses of pureMOOCs(Burge, Fox, Grossman, Roth & War-ren,2015). The incorporation of such models have been successful in different studies. Students usually recognize the benefit of these technologies, but the figure of the instructor still needs to establish a balance between the two approaches (Bansal & Singh,2015). During this dissertation we analyze both MOOCsandSPOCs targeting different areas of interest. Analyzing these two educational contexts allow us to obtain different conclusions.
The massiveness and the fact that each student generates a large amount of events, provides the opportunity to analyze huge datasets about the interaction of students with these online edu-cational platforms with the objective of improving the learning process. During this process, the raw data that comes from learning environments can be processed and converted into potential information that can have an impact on educational research and practice (Romero & Ventura,
in automatic discovery, adaptation and specific models, whereasLAis more designed to inform and empower instructors and students, relying on them for final decisions (Siemens & Baker,
2012). More specifically, LAwas defined during the 1st International Conference on Learning Analytics and Knowledge as the “the measurement, collection, analysis and reporting of data about learners and their contexts, for purposes of understanding and optimizing learning and the environment in which occurs”1whereasEDMwas defined byRomero & Ventura(2013) as “de-veloping, researching, and applying computerized methods to detect patterns in large collections of educational data that would otherwise be hard or impossible to analyze due to the enormous volume of data within which they exist”. In other words, the two research areas can be comple-mentary to understand the whole picture, as they have the same ultimate goal which is to improve learning (Papamitsiou & Economides,2014).LAhas emerged as a different field than academic analytics, where the latter is more focused on the political and economic challenges of education, e.g. improving educational opportunities and results at a national or international level, based on data analysis (Ferguson,2012). We can find several reviews in the state of the art collecting the different works inLAandEDM(Berland, Baker & Blikstein,2014;Ferguson,2012;Papamitsiou & Economides,2014;Romero & Ventura, 2010). Based on that we divide the different studies according to the learning setting, the analysis method applied or research objectives (Papamitsiou & Economides,2014) and then we compare them with the research performed in this dissertation. The learning environment and specific settings can be quite different in each study. There are studies in the area of classicalVLEsandLMSs(Lee, Recker, Choi, Hong, Kim, Lee, Lefler, Louviere & Walker,2016;Młynarska, Greene & Cunningham,2016),MOOCs(Sharma, Alavi, Jermann & Dillenbourg, 2016; Khalil, Kastl & Ebner, 2016), SPOCs (Fox, 2013; Delgado Kloos, Mu˜noz-Merino, Mu˜noz-Organero, Alario-Hoyos, P´erez-Sanagustin, Parada G., Ruip´erez-Valiente & Sanz,2014), more specific educational environments likeIntelligent Tutoring System (ITSs)(Feng, Heffernan & Koedinger,2006;Kelly, Arroyo & Heffernan,2013), using mobile de-vices (Aljohani & Davis,2012;Tabuenca, Kalz, Drachsler & Specht,2015) or learner data from different modalities (Worsley & Blikstein,2015;Ochoa, Worsley, Weibel & Oviatt,2016). During this dissertation we focused on exploring data fromMOOCs andSPOCsusing Khan Academy, Open edX and Coursera platforms. Additionally, each study can also have specific and different research objectives.
These objectives can be very diverse, some of the most common goals are student behavioral modeling (Qiu, Tang, Liu, Gong, Zhang, Zhang & Xue,2016;Wen, Yang & Rose,2014), predic-tion of performance (Elbadrawy, Studham & Karypis,2015;Anozie & Junker,2006), prediction
of dropout and retention (Chaplot, Rhim & Kim,2015;Whitehill, Williams, Lopez, Coleman & Reich,2015), decision-making support and self-reflection (Littlejohn, Hood, Milligan & Mustain,
2016;Vatrapu, Teplovs, Fujita & Bull,2011), recommendation systems (Hu, Lo & Shih, 2014;
Dwivedi & Bharadwaj,2015) or improvement of assessment and feedback (Suen,2014;Maggs,
2014). Our work has dealt with different research questions within these areas with special em-phasis on student behavioral modeling, visual analytics and prediction of learning outcomes.
Finally, the techniques also change in each study. Some of the most common techniques are classification (Whitehill et al., 2015; Hu et al., 2014), regression (Elbadrawy et al., 2015;
Koedinger, Kim, Jia, McLaughlin & Bier,2015), text analytics (Wen et al.,2014;Tucker, Pursel & Divinsky,2014), discovery based on rule models (Lee, Yu, Lee, Tseng, Chang & Chen,2014;
Aleven, Mclaren, Roll & Koedinger,2006), social network analysis (Joksimovi´c, Dowell, Skryp-nyk, Kovanovi´c, Gaˇsevi´c, Dawson & Graesser,2015;Cela, Sicilia & S´anchez,2015) and visual analytics (Qu & Chen,2015;Coffrin, Corrin, de Barba & Kennedy,2014). In our work we de-signed and implemented several algorithms for behavioral modeling based on rule models. We worked on the evaluation of visual analytics. We applied classification and regression for the prediction of learning outcomes and clustering for student profiling. In the following sections we discuss with more emphasis each one of our areas of interests during this dissertation.
2.3.
Educational Visualization Dashboards and its Evaluation
Different studies have approached the process of transforming raw data into indicators and parameters related to learning. We can find a review of different LA indicators presented by
Dyckhoff, Lukarov, Muslim, Chatti & Schroeder (2013). Depending on the platform and the specific research work, different parameters might be available. For example, specific indicators such as hint abusing might be available only in some environments like Khan Academy ( Mu˜noz-Merino, Ruip´erez Valiente & Kloos, 2013), while others more general like resource coverage or access time patterns are generally available in all environments (Zhang, Almeroth, Knight, Bulger & Mayer, 2007). The use of visual analytics is one of the most common techniques to transfer information regarding students’ actions to stakeholders. Visualizations can be used for a big variety of reasons. Generally speaking, in education visualizations are very useful for self-awareness and self-reflection in the case of students, and in the case of instructors or other interested stakeholders, as a data-driven support for decision making. Despite their usefulness, we find that mostVLEsdo not include any kind ofLAdashboards with basic visualizations. One of the pioneer educational platforms in providing strongLAsupport was Khan Academy. This platform has individual and class visualizations about factors such as time spent in exercises and videos, progress over time and the specific skills achieved by each student.
MOOCs(Atapattu, Falkner & Tarmazdi,2016) or to visualize different student profiles (Xu, Gold-wasser, Bederson & Lin,2014). The work byDuval(2011) shows several learning dashboards and recommender examples. Furthermore, they perform a comparison between educational and non-educational user tracking environments (Duval, 2011). We can find in the literature many visualization tools for different VLEsand using distinct types of plots and learning indicators. For example, TrAVis (May, George & Pr´evˆot,2011) is a tool that helps students to analyze and evaluate their own activities while learning online with computer mediated communication tools. TrAVis displays indicators in radar charts where students can compare their activity with others. Another visualization dashboard is GISMO for Moodle (Mazza & Milani,2005), which provides graphics related to students activity in quizzes, forums and other learning resources. Another example ofLAdashboard for Moodle is LAPA which had three segments: learning, prediction and action (Park & Jo, 2015). As we can see, due to the well-known popularity of Moodle as LMSthere are many LAdashboard approaches for the tool. CourseVis (Mazza & Dimitrova,
2004) is another visualization tool, in this case for the WebCT; instructors can visualize different indicators, some of which are also similar to ours, such as number of accesses to each page of a course or progress with the course schedule. In the specific case scenario ofPersonal Learning Environments (PLEs), visualizations are particularly useful to enable self-reflection for students regarding their interaction with thePLE. CAMERA (Schmitz, Scheffel, Friedrich, Jahn, Niemann & Wolpers, 2009) is used for monitoring and reporting on learners’ behavior enabling then the possibility of reflection with e.g. social network analysis. Another tool for a PLE is GLASS (Leony, Pardo, de la Fuente Valent´ın, de Castro & Delgado Kloos,2012), which allows to capture events from different computer applications that students use during their practice hours providing afterwards visualizations regarding that interaction.
Although initially there were not too many initiatives for visualization dashboards onMOOC platforms, during the last few years there has been more research effort in this direction. MOOC providers are also understanding the importance of theseLAdashboards and launching their own initiatives (e.g. edX Insights2). Due to the new technologies used inMOOC and also the mas-siveness, MOOCspresent new challenges regarding technical design and visualizations. As an example of research studies in this direction, we can find Open-DLAs tool (Cobos, Gil, Lareo & Vargas,2016) which was created byUniversidad Aut´onoma of Madrid (UAM)and is able to digest edX interaction logs and provide visualizations and insights useful for the instructors. A similar approach was developed for FutureLearn data using a Shiny application for the visual-ization purposes (Chitsaz, Vigentini & Clayphan, 2016). A very interesting tool is PeakVizor (Chen, Chen, Liu, Shi, Wu & Qu,2016) which enables an in-depth video peek visual analysis
supporting data from both edX and Coursera at the same time. In this direction, the author of this dissertation has been involved in the development of twoLAdashboards. First,Add-on of the Learning Analytics support of the Khan Academy (ALAS-KA)platform (Ruip´erez-Valiente, Mu˜noz-Merino & Delgado Kloos, 2013;Ruip´erez-Valiente, Mu˜noz-Merino, Leony & Delgado Kloos, 2015; Ruip´erez-Valiente, Mu˜noz-Merino & Delgado Kloos, 2015b), which extends the LAfunctionality of the Khan Academy platform with more than 20 new visualizations. Second, Add-on of the learNing AnaLYtics Support for open Edx (ANALYSE) which is a visualization dashboard for Open edX environment (Ruip´erez-Valiente, Mu˜noz-Merino, Gasc´on-Pinedo & Del-gado Kloos,2016;Ruip´erez-Valiente, Mu˜noz-Merino, Pijeira D´ıaz, Santofimia Ruiz & Delgado Kloos,2017;Pijeira D´ıaz, Santofimia Ruiz, Ruip´erez-Valiente, Mu˜noz-Merino & Delgado Kloos,
2016;Santofimia Ruiz, Pijeira D´ıaz, Ruip´erez-Valiente, Mu˜noz-Merino & Delgado Kloos,2014;
Pijeira D´ıaz, Santofimia, Ruip´erez-Valiente, Mu˜noz-Merino & Delgado Kloos,2015) which in-cludes 12 new visualizations and is designed to scale to the massiveness of MOOCs. During this dissertation we have used both ALAS-KAandANALYSEin different case studies as sup-port (e.g., to retrieve different indicators about the learning process) and to evaluate the learning process of students.
In the field of education there is extensive work towards the analysis of learning outcomes. The specific target of these studies can differ, e.g. course dropouts (Kloft, Stiehler, Zheng & Pinkwart, 2014), predicting if a student is going to be successful or not in a degree to support decision making in college admissions (Nghe, Janecek & Haddawy,2007), to predict if students are going to surpass a course or not (Calvo-Flores, Galindo, Jim´enez & Pi˜neiro,2006), to predict the major that a student is going to pick, before the student actually enrolls in college courses (Pedro, Ocumpaugh, Baker & Heffernan,2014), to provide information about the performance of groups in collaborative learning environments (Perera, Kay, Koprinska, Yacef & Za¨ıane,2009), to provide learning recommendations in educational systems (Salehi & Kamalabadi,2013) or to predict the score of a test before actually doing it (Pardos, Gowda, Baker & Heffernan,2010;Feng et al., 2006). Most of these studies are performed using data fromVLEs, but we can also find studies that use data from traditional classroom settings such as high school education (Aguiar, Lakkaraju, Bhanpuri, Miller, Yuhas & Addison,2015). There has always been interest in analyti-cal studies using educational data, however since theMOOCphenomenon started, the amount of data available has dramatically increased, allowing forMachine Learning (ML)models to thrive in order to find hidden patterns that can reveal insight regarding what variables have an effect on learning outcomes. As an example, the work carried out byBrinton et al. (2014) analyses data from more than 100.000 distinct students from Coursera a singleMOOC, which is a data sample size hardly available in any other educational context.
prediction objectives that were mentioned as some of the most common educational objectives in education in Section2.2: one is the prediction of learning outcomes or test scores, the other one is related to dropout prediction.
In the first case, there are many studies that work towards the prediction of post-test transfer or learning gains. Both cases are quite similar as learning gains depend on the post-test score. In this direction, there are several research works on the ASSISTment system (Feng et al.,2006;
Feng, Beck, Heffernan & Koedinger,2008; Anozie & Junker, 2006; Kelly et al., 2013) which predict a student performance indicator at the end of a course by using the data generated by the system. The results of the works developed on ASSISTment utilize variables related to seek-helping behavior and others more general about time or percentage of correct items. Others similar works are based on an ITSfor College Genetics where they also try to predict learning outcomes (Baker, Corbett, Gowda, Wagner, MacLaren, Kauffman, Mitchell & Giguere, 2010;
Baker, Gowda & Corbett, 2011;Corbett, Kauffman, Maclaren, Wagner & Jones, 2010). Some studies using data from the College Genetics ITS reported that the developed detector needed only a limited amount of data (around the first 20% of a students’ data) in order to predict with reasonably accuracy (Baker et al.,2010). This is very interesting as it would allow to intervene in the early stages of a course. Another work on the College GeneticsITScompares several bayesian knowledge tracing variants in order to see which one of them predicts better post-test performance (Baker et al.,2011). All these studies use data fromITSenvironments, but we can also find in the literature similar studies on traditionalLMSenvironment. For example, to predict performance in Moodle course activities using a collaborative multi-regression model (Elbadrawy et al.,2015) or the performance in midterm and final exams using partitioning trees (Pardo, Mirriahi, Martinez-Maldonado, Jovanovic, Dawson & Gaˇsevi´c,2016). The environment ofITS,LMSandMOOC platforms can be different. Consequently, it might not be possible to apply the same variables in all environments and the effect of the predictor variables might change from one case study to another. MOOCsare recent and there are not as many works on prediction as on the ITSor LMS field. One key feature of MOOCs is the social activity and the prediction of how social activity evolves and which variables are important (Brinton et al.,2014). An interesting approach is to predict if students are going to solve correctly a question using video-watching stream data (Brinton & Chiang, 2015). Other example is the prediction of students’ knowledge status in MOOCsusing Open edX (Guo & Wu,2015).
One of the most problematic issues ofMOOCs is the high dropout ratio. Recent reviews estimate the average completion ratios inMOOCsaround the 7% (Khalil & Ebner,2014). These studies are also related to the prediction of certificate of accomplishment, since the students that drop out a course do not manage to acquire one. We can find in the literature different studies targeting learning outcomes in different MOOCplatforms such as Open edX (Balakrishnan & Coetzee, 2013) or Coursera (Kloft et al., 2014; Ros´e & Siemens, 2014;Sinha, Jermann, Li & Dillenbourg, 2014; Chaplot et al., 2015). For example, the study ofBalakrishnan & Coetzee
important to analyze this problem over the weeks to see how accuracy evolves when more data is available (Kloft et al.,2014).
Another important question that has been addressed in the field of prediction modeling on education is about the development of these techniques and algorithms. We can even find several papers that focus on comparing different techniques or variants of the same algorithm with the purpose of finding which one is the most effective to predict learning outcomes (Nghe et al.,2007;
Baker et al., 2011;Koutina & Kermanidis,2011). The research by Kotsiantis(2012) performs a review of the different machine learning techniques for educational purposes. Many authors apply linear regression (Feng et al.,2006,2008;Grafsgaard, Wiggins & Boyer,2014;Kelly et al.,
2013). We also use it in Section6.1because we expect a linear relationship between the selected variables and students’ learning gains. Other authors use different methods such as bayesian knowledge tracing model (Baker et al.,2011;Guo & Wu,2015), 1-NN (Koutina & Kermanidis,
2011), neuronal networks using radial basis functions (Calvo-Flores et al.,2006), hidden markov models (Balakrishnan & Coetzee,2013), support vector machines (Kloft et al.,2014), partition-ing trees (Pardo et al., 2016) or C4.5 (Hu et al.,2014) among many others. Another interesting approach is to ensemble different prediction methods to achieve more robust results (Pardos et al.,
2010;Essa & Ayad,2012). In our work we have also explored how different algorithms perform in different contexts and also what happens when more data is available for the prediction of cer-tificate accomplishment as we describe in Section6.2. Finally, most of these studies use variables computed from the interaction of the student with theVLE, but it is also possible to use multi-modal sources to improve those predictions e.g., gestures and postures (Grafsgaard et al.,2014) or eye-tracking (Sharma, Jermann & Dillenbourg,2014). In our case, we have used variables re-lated to the interaction of students with the platform, but also trying to delve into complex student behaviors as we explain in Section6.1.
2.5.
Use of Regular and Optional Activities
respon-sibility and control to learners (Kay,2001) which is beneficial for their actual learning outcomes (Carneiro, Lefrere, Steffens & Underwood,2012). The main idea with self-regulated learning is that students should master a process that involves goal setting and planning, monitoring and con-trol processes, as well as reflection and evaluation processes (Schon,1984;Bolton,2010). Within this self-regulated settings students can decide which items or activities they want to use. We can roughly divide it in regular or mandatory activities, that are those required to be completed by students in order to achieve a passing grade (e.g. graded exercises or videos) and those who are completely optional and might not even be related to the learning process (e.g. setting an avatar picture). This degree of optionality depends on each specific case study, e.g., in some occasions forum activity might be mandatory, in other cases completely optional.
If we assume that one of the main objectives ofMOOCsandSPOCsis that students complete the proposed courseware in a correct way (e.g., their interaction with videos or educational activ-ities). Therefore, it is necessary to define metrics that can accurately measure the effectiveness of students with the courseware. These metrics can help to determine how students progress in the course according to the proposed are activities. Nonetheless, in the literature we find that most metrics that are used to evaluate the effectiveness of students are very simple (e.g, num-ber of videos completed or numnum-ber of exercises solved correctly) and usually these metrics are not adapted to the specificities of the educational context. For example, the study carried out by
Dyckhoff et al. (2013) shows a compilation of indicators used in different studies in the literature, showing that most of them are simple indicators such as number of threads started by a student, number of assignments submitted or number of pages viewed. These indicators do not take into account how educational resources and activities were structured or how they are related to each other.
ware can help to delve into different behavioral profiles such as for example ‘copy and paster’, ‘hint abuser’, ‘hint avoider’, ‘student misuse’, ‘video avoider’, ‘unreflective user’ or ‘procrasti-nator’ (Blikstein,2011;Aleven, McLaren, Roll & Koedinger,2004;Aleven et al.,2006; Mu˜noz-Merino et al., 2013;Baker, Corbett, Koedinger & Wagner, 2004; Baker, Corbett & Koedinger,
2004;Tervakari, Marttila, Kailanto, Huhtam¨aki, Koro & Silius,2013). We can analyze the influ-ence of these different indicators on different outcomes, e.g., factors that might affect teaching effectiveness (Kyriakides, Christoforou & Charalambous, 2013), factors of student persistence (Hart,2012), relationship of different behaviors with learning gains (Aleven et al.,2006) or anal-ysis of what items can increase student engagement (Wankel & Blessinger,2012). However, most e-learning platforms are still providing just rough insight (usually just the number and the grade of the activities completed) regarding the interaction of students with the educational resources. There is a need for more precise strategies to measure the effectiveness of students that can take into account the structure of the activities and other specificities such as the relationship between the different items in a course. As part of this dissertation, we have analyzed the relationship between the effectiveness of students with other variables and also with the purpose of student profiling (Mu˜noz-Merino, Ruip´erez-Valiente, Alario-Hoyos, P´erez-Sanagust´ın & Kloos, 2014;
Mu˜noz-Merino, Ruip´erez-Valiente, Alario-Hoyos, P´erez-Sanagust´ın & Delgado Kloos,2015). Additionally to the aforementioned learning activities, there are other activities that might not be mandatory or required to effectively complete the learning process. These activities can be defined as optional for students. For example, Mu˜noz-Merino, Delgado Kloos, Seepold & Garc´ıa(2006) analyzed which tools and functionalities that are provided by theVLEsMoodle3 and .LRN4are the most important regarding students’ perception. Some of the most highly rated were optional activities such as the use of forums or visualizations regarding their status. This shows that students also care about extra functionalities. Koedinger et al. (2015) compared the effect of passive and active learning. They found that only watching videos can be predictive of dropout and those who completed activities were more successful than just watching videos or pages. In addition, they also found that the combination of both passive and active learning lead to the highest success rates. Santos, Klerkx, Duval, Gago & Rodr´ıguez(2014) analyzed the activities conducted by learners in two languageMOOCs and they found that a higher activity in the forum correlated with students’ success. This is in line with the findings of the study conducted by Cheng, Par´e, Collimore & Joordens(2011) with over 2.000 students that found that students who participated voluntarily in forums also performed better in the course. Other works that explored activities that can be regarded as optional, are for example the one carried
3https://moodle.org
out by Gaˇsevi´c, Mirriahi & Dawson(2014) in terms of video annotation. They compared two courses, in the first one annotations were graded and in the second annotations were non-graded. Their findings suggest that students in the group of graded annotations, were able to use and develop more complex language indicators as a result of a potential more complex cognitive process. The study by Coetzee, Fox, Hearst & Hartmann(2014) with a reputation system for forum activities, suggested that students who were actively using the forum performed better and at the same time the use of the reputation system produced faster and more numerous post responses. On the other side, a study by Davies & Graff (2005) suggested the contrary, that forum activity alone is not enough to lead to higher grades, at least in their context. A study by
Mu˜noz-Organero, Mu˜noz-Merino & Kloos(2010) found that participating in e-learning activities (such as forums) or uploading a profile photograph was positively correlated with the motivation and final grade of students. During this dissertation we analyze the relationship between the use of optional activities and learning outcomes (Ruip´erez-Valiente, Mu˜noz-Merino, Delgado Kloos, Niemann & Scheffel,2014;Ruip´erez-Valiente, Mu˜noz-Merino, Delgado Kloos, Niemann, Scheffel & Wolpers, 2016). More specifically, we look into the use of feedback, votes, badge display, avatar image and setting up learning goals in Khan Academy (this optional activities are described in Subsection3.1.1.1). We present the relationship between using certain regular and optional activities with other learning indicators. We also delve into how the behavior and activity of students might relate to learning outcomes.
2.6.
Gamification and Use of Badges
tive effects as a general rule, but these effects were strongly dependent on the contexts and the users of the experiment. Some examples of successful specific gamification applications are with mathematics computer games which were able to improve the motivation of those students who used them (Kebritchi, Hirumi & Bai, 2010), in engineering classes where students were able to improve their learning achievement while reducing the stress of complex lessons (Kim, 2013), the successful case of Pex4Fun (Xie, Tillmann, De Halleux & Bishop, 2015), a gamified engi-neering software where students earn badges and duel each other while learning the contents of the course, or for teaching computer programming skills to new students avoiding part of the stress (Mladenovi´c, Krpan & Mladenovi´c,2016). Nonetheless, there are handicaps in the use of gamification. Since it is naturally a extrinsic motivator, some students might lose track of the actual task in hand and undermine motivation (Deci, Koestner & Ryan,2001). Additionally, there are reports indicating that some student felt discouraged and perceived gamification as unneces-sary (Berkling & Thomas,2013). That is why it is also important to prepare a carefully tailored gamification design that enhances the intrinsic motivation of students (Barata, Gama, Jorge & Gonc¸alves,2013b), such as for example by improving the control of students, enhancing cooper-ation and the possibility to gain recognition (Zirk,2014). Some works proposed frameworks in order to effectively design beneficial gamification experiences (Hamari & Eranti,2011).
One of the most common elements used in gamification is the use of badges, which are virtual tokens that are delivered after completing certain actions and represent visual achievements or skills (Goligoski, 2012). There are some open frameworks such as Mozilla Open Badges 5, which provide the possibility of using a shared infrastructure for implementing them. Badges are commonly used to try to encourage desired behaviors of users (Gibson, Ostashewski, Flintoff, Grant & Knight,2015). Several studies show proof that badges can increment user activity, and encourage more social interaction or other desired behaviors (Grant & Betts, 2013; Anderson, Huttenlocher, Kleinberg & Leskovec,2013). In the case of education, the use of badges is strongly related to the reinforcement of achievement goal theory, trying to create a positive relationship between mastering a skill, receiving a badge and actual academic performance (Abramovich & Schunn, 2011). One of the main objectives of using badges in educational settings, is trying to increment the engagement of students with the platform and the learning flow, which can be measured with various metrics such as time or frequency of visits to the learning environment (Muntean, 2011). There are some successful studies using badges in education, for example achieving an increment in the social activity of 511% in term of replies and 845% in term of number of threads (Barata, Gama, Jorge & Gonc¸alves,2013a). In addition, the TRAKLA2 online environment reported good results using badges to encourage desired behaviors for 281 students
(Hakulinen, Auvinen & Korhonen,2013). Another successful example is GRASS project6which has been focused on the use of open badges to represent the soft skills of learners. Again, although badges can indeed improve learners motivations (Abramovich, Schunn & Higashi, 2013), bad designs can lead to counter-effective systems that might interfere with the important goal which is the learning of students.
Nevertheless, it is not common to find gamification indicators included in research studies, e.g., the aforementioned review by Dyckhoff et al., does not include any indicator related to gamification. Therefore, it is still needed the analysis of student behaviors towards badges. Ad-ditionally, these indicators can help towards adapting the learning experience of students. We believe there is a knowledge gap here, and that is why in this dissertation we analyze the use of badges of students in educational environments (Ruip´erez-Valiente, Mu˜noz-Merino & Delgado Kloos,2016a). We could use this information to understand how to use badges and instructional design to improve engagement and motivation in learning experiences. Previous research about badges on Stack Overflow7, found that badges can have an effect on the behavior of users e.g., to edit more posts (Grant & Betts, 2013). That is why we want to see the effect of badges on the behavior of students and we analyze different behaviors such as the concentration or inten-tionality of students towards badges and its relationship with other metrics (Ruip´erez-Valiente, Mu˜noz-Merino & Delgado Kloos,2016b,2017).
2.7.
Academic Dishonesty and Illicit Collaboration
Academic dishonesty can be defined as “any type of fraudulent action in an academic work” (Lambert, Hogan & Barton,2003). Academic dishonesty is often denominated as ‘cheating’. It has been one key issue in education since the early beginnings. Singhal (1982) described the area of academic dishonesty as one of the main problems in contemporary education; now with the proliferation of online education, new problems related to academic dishonesty are emerging as well. Some authors divide academic dishonesty in traditional methods (typical education in a classroom context) and new methods (those who include electronics, new technologies or Inter-net) (Palazzo,2006). This issue has been an area of study for at least half a century. According to a report byMcCabe, Trevi˜no & Butterfield(2001), they rate that very high percentages of students that have attended college, have also engaged in some kind of academic dishonesty. Other studies have reported different metrics, such as that most students only cheat occasionally and that there are not many that cheat systematically (Witherspoon, Maldonado & Lacey,2012), or that around 67% of students have cheated in at least one exam or more (Balbuena & Lamela,2015). Despite the exact percentages can vary greatly from one study to another, we should keep in mind that this can be strongly affected by the specific criteria to consider actions as cheating or not.
Academic dishonesty and cheating can be influenced by many factors. It has been found in
6https://sites.google.com/site/llpgrassproject/
small and private ones, which can indicate that a more personalize learning environment battles cheating (Palazzo,2006). There are some studies that also suggest a existing relationship between personality traits and having a dishonest behavior in academia (Anderman et al.,2009;Harding et al.,2007;Giluk & Postlethwaite,2015;Sanecka & Baran,2015;De Bruin & Rudnick,2007;
Jordan, 2001). One other important factor of influence is the peers in the environment, which sometimes can even help or be supportive during the cheating process (Payan, Reardon & Mc-Corkle,2010). Despite some students might have initially an ethical behavior and do not cheat, after seeing other peers succeed using cheating methods, they might feel in disadvantage and start committing unethical acts as well (McCabe & Trevino,1993). Additionally, whenever they start cheating, their guilt might decrease and continue in the future (Shu & Gino,2012).
MOOCenvironments and has been studied with frequency (Joksimovi´c et al.,2015;Cela et al.,
2015). Similar to what has been found in face-to-face courses, MOOCresearch has also found that learners tend to group (Li, Verma, Skevi, Zufferey, Blom & Dillenbourg,2014). Addition-ally, jointly registering to a course with a friend can have a positive influence towards completion (Brooks, Stalburg, Dillahunt & Robert,2015). However, not all collaboration might be ethical, since there is no ID confirmation about who took an exam or what was done during the test, in these online environments the issue of academic dishonesty might even be more problematic (Harmon & Lambrinos,2008). One important way to battle academic dishonesty is by creating an honest culture and moral beliefs that help students understand what is expected from them (Galbraith & Jones, 2010). Several methods have been reported as useful to decrease academic dishonesty and gaming the system, e.g., the use of honor codes (LoSchiavo & Shatz, 2011) or delaying help feedback (Baker et al.,2004,2004).
Different detectors have been developed to detect academic dishonesty (Sheridan, Alany & Brake, 2005) or gaming the system (Muldner et al., 2011; Walonoski & Heffernan, 2006). Nonetheless, more work is required in this direction as it can seriously affect learning quality and educational research. During this dissertation we explore academic dishonest collaboration, by designing a method to detect student ties based on temporal proximity of their assignment sub-missions (Ruip´erez-Valiente, Joksimovi´c, Kovanovi´c, Gaˇsevi´c, Mu˜noz-Merino & Delgado Kloos,
2017a). We will discuss this detector in Subsection 3.3.7.1. We also present one specific form of academic dishonesty that have been found is MOOCs that is known by the name of Copy-ing Answers usCopy-ing Multiple Existences Online (CAMEO)(Ruip´erez-Valiente, Alexandron, Chen & Pritchard, 2016; Alexandron, Ruip´erez-Valiente & Pritchard, 2015; Alexandron, Ruip´erez-Valiente, Chen, Mu˜noz-Merino & Pritchard,2017;Northcutt, Ho & Chuang,2016). InCAMEO, students use multiple accounts to harvest correct solutions and then insert the correct answers into their main account, which is used to earn a certificate.CAMEOis strongly related academic dis-honesty, since students are breaking the agreed honor code specified by the online environments (e.g., terms of service of Coursera8or edX9).CAMEOis also related to gaming the system since students are exploiting certain features such as being able to create several accounts and receiving feedback from submissions. We discussCAMEOdetection algorithm in Subsection3.3.7.2.
8https://www.coursera.org/about/terms
Contents
3.1. Tools . . . 29
3.1.1. MOOC Platforms . . . 30 3.1.2. Learning Analytics Dashboards . . . 33 3.1.3. Technologies, Statistical Methods and Software . . . 36
3.2. Case Studies . . . 37
3.2.1. SPOCs: Physics, Chemistry and Math with Khan Academy . . . 37 3.2.2. MOOC ‘The Spain of Don Quixote’ on edX . . . 39 3.2.3. MOOC ‘Mechanics Review’ on edX . . . 40 3.2.4. MOOCs ‘Music Theory’ and ‘Introduction to Philosophy’ on Coursera 40
3.3. Selected indicators . . . 40
3.3.1. Use of the Platform . . . 41 3.3.2. Correct Progress in the Platform . . . 42 3.3.3. Time in the Platform and its Distribution . . . 43 3.3.4. Problem and Submission Features . . . 43 3.3.5. Behavior Solving Exercises . . . 44 3.3.6. Behavior with Badges . . . 45 3.3.7. Online Academic Dishonesty and Collaboration . . . 46
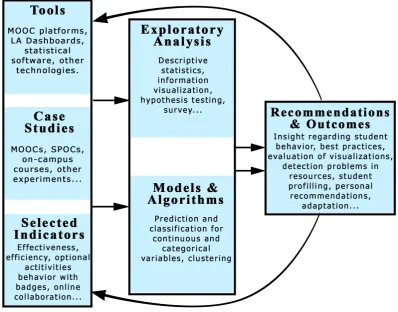
This chapter describes the method that we follow during the research process, which also resembles the outline of the dissertation. The overview of the different stages is presented in Figure3.1. Now we describe the different phases within our approach:
1. Educational setting and research questions: The first phase is establishing an educational
context, with the tools that we are going to use, the case study, the selected indicators that we want to explore and the r