COMPETITIVENESS LEVEL OF THE AIRLINE INDUSTRY: A
SCALE DEVELOPMENT STUDY
Ferhan Sengur1, Temel Caner Ustaomer21
1,2 Faculty of Aeronautics and Astronautics, Eskisehir Technical University, Eskisehir, Turkey
Received 1 November 2018; accepted 17 January 2019
Abstract: In this study, it was aimed to develop a scale to determine the international competitiveness level of the airline industry. 36 items in the survey were applied on 181 airline managers, aviation experts and academics. At the end of the study, a scale consisting of 25 items describing 62.973 % of the total variance was obtained. The exploratory factor analysis showed that the scale consisted of five sub-dimensions called government, firm strategy, structure and rivalry, demand conditions, related and support industries and factor conditions. As a result of confirmatory factor analysis, five-dimensional model was determined to be appropriate (χ²=366.936; df=262; p=0.00; χ²/df=1.401; RMSEA=0.047; CFI=.951; GFI=.862).
Keywords: airline industry, scale development, Diamond model, industry competitiveness, competitiveness analysis.
1. Introduction
Airlines are an important part of the air transport system. Moreover, airlines have strategic importance because they link the regions they serve. In terms of geographical location, Turkey is positioned as a transit point between Asia, Europe and the Middle East. The bilateral agreements and the liberal policies have transformed this geographical area into an important center for passenger transport. Therefore, it is essential to understand the development dynamics of the airline industry. In this study, firstly, the literature review related to diamond model will be given, and then Porter’s diamond model will be explained in details. In the findings part, explanatory and confirmatory factor analyzes of the scale will be presented. In the conclusion section, the results of the
explanatory and confirmatory factor analysis of the scale will be discussed.
2. Literature Review
level. Erarslan et al. (2007, 2008 and 2009) conducted Porter’s diamond model to analyse the competitiveness level of Turkish plastic sector, Turkish marble industry and Turkish animal husbandry. Their research indicated that the international competitiveness of Turkish plastic sector and marble industry as medium level while Turkish animal husbandry industry’s international competitiveness was determined as low level. Riasi (2015) used Porter’s diamond model to find out the competitive advantages of shadow banking. According to his findings, government, chance and factor conditions do not contribute to the competitiveness of shadow banking industry. However, firm strategy, structure and rivalry, related and supporting industries, and demand conditions benefit the competitiveness of shadow banking industry. Rodrigus and Khan (2015) employed Porter’s diamond model to evaluate the industrial competitiveness of various SAFTA countries and compare the factors contributing to their competitiveness. Gümüş and Hızıroglu (2015) investigated the competitiveness of the selected services in Turkey in comparison with the European Union. Within the scope of their study, Porter’s diamond model and three different revealed comparative advantage indices were employed in a combined way. Their findings showed that strong comparative advantages exist for Turkey in tourism, construction and transportation sectors. On the other hand, Turkish insurance and financial and computer-information and communication sectors appear to be weak compared to EU.
Esen and Uyar (2012) discussed whether Diamond Model is an appropriate model to measure the competitive structure of Turkish tourism industry. According to Porter, the diamond model would not be an appropriate model for bequeathed industries
express delivery service, and evaluated the competitiveness of air cargo express carriers in the Korean market by employing AHP analysis. Their results showed that accuracy and promptness are the two most influential factors to competitiveness. Yazgan and Yigit (2013) assessed the competitiveness level of the civil aviation industry in Turkey by employing Porter’s diamond model. Their analysis revealed that shortage of qualified labor and fuel costs affect the competitiveness level of Turkish Civil Aviation Industry negatively. On the other hand, in terms of high domestic demand, high industry growth and favorable geographical conditions, Turkey has considerable advantages.
2.1. The Diamond Framework
Porter argues that a new paradigm is essential in order to understand why a nation is successful in particular industries
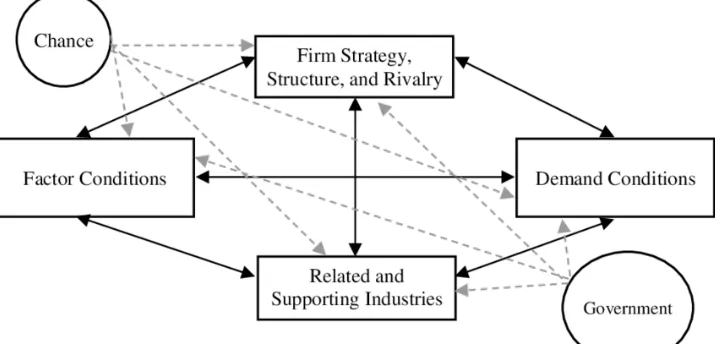
but not in others. To derive this new analytical framework, which he calls the ‘diamond’, Porter conducts a study of ten nations. These nations are mostly developed countries: Germany, Sweden, the United States, Denmark, Italy, Switzerland, Japan and United Kingdom, with the exception of Singapore and South Korea, which are seen as newly industrialized countries. Porter states that the home base is critical in that firms tend to build up competitive advantage. He indicates that four attributes of the home environment- namely, demand conditions, factor conditions, firm’s strategy, structure and rivalry, and related and supporting industries- play an important role in determining the context which leads domestic firms to gain and sustain competitive advantage. The roles played by the ‘government’ and ‘chance factors” also influence the functioning of these four determinants.
Fig. 1.
Figure 1 shows the complete framework Porter offers to capture the sources of competitive advantage in an industry. Michael Porter’s diamond model is a useful method to clarify the factors that the company has to take into account in the business operation and the interactions between these factors with a consideration of the external competition, organizational structure and strategic decisions (Zhao et al., 2012; p.362). These attributes will be summarized in the following paragraphs (Porter, 1990).
Factor Conditions. Factor conditions include knowledge resources, raw materials, human resources, capital resources, physical resources, technological resources, infrastructure, manager’s capabilities and innovation power. Porter divides factor conditions into two groups: highly specialized resources (e.g. knowledge, technolog y, and professional human resources) and home-grown resources (e.g. energy, raw material, and unprofessional human resources) (Riasi, 2015; p.18).
Demand Conditions. Porter (1990) suggests that the demand conditions which show the nature of home demand constituted the second broad determinant of national competitive advantage. This determinant is interesting because it relates to the nature of buyers in the home market. Demand conditions are the pressures based on consumers’ requirements about services, price and quality in a particular industry. Demand conditions impact the forming of certain factor conditions. They affect the direction and pace of product development and innovation. For example, Japanese car buyers force Japanese car makers with regard to high quality standards requiring them to make the quality of their operations, goods,
and activities, which in turn makes ready the industry to compete internationally (Bakan and Dogan, 2012; p.444).
Related and Supporting Industries. The existence of internationally competitive related and supporting industries in a nation contributes to creation and sustainability of competitive advantage. The competitive related industries that share common inputs, skills, technologies, distribution channels or customers may be beneficial for several reasons. Firstly, their similarities may foster technological spillovers. Secondly, a wider dissemination of business information may provide firms to perceive new business opportunities and promote spin-offs. Lastly, threats of new entry from related competitive industries may put the necessary pressure on the existing firms to advance their competitive advantage (Öz, 1999).
Firm Strategy, Structure, and Rivalry. National circumstances and context affect how companies are created, organized, and managed. Competitiveness in a specific industry results from convergence of the management practices and the sources of competitive advantage in the industry. Individual motivation to work and expand skills is also essential to competitive advantage. Outstanding talent is a scarce source in any nation. A nation’s success is related to the types of education its talented people choose and their commitment and effort. The presence of strong local rivals is a powerful stimulus to the creation and persistence of competitive advantage (Porter, 1990).
reinforcing the underlying determinants of national advantage apart from trying to create the advantage itself. The chance events are the ones that have little to do with circumstances in a nation and are generally outside the control of firms. Oil shocks, inventions, and wars are examples of chance events. Chance events may allow shifts in competitive position by creating forces that reshape the industry structure (Öz, 1999).
Porter states that each determinant is affected by the others, making the system a dynamic one in which all elements interact with each other. This systemic nature makes it difficult to copy the exact structure of the industry in another country. Therefore, it is essential that the advantage is based on the entire system rather than only one determinant.
3. Research Method
The aim of this study is to develop a scale to determine the level of international competitiveness of the airline industry in Turkey. In this study, a competitiveness level scale, validity and reliability study was conducted. The measurement tool developed by the cross-sectional survey model was applied to aviation experts, airline managers and aviation academics. The research was carried out in two basic stages: theoretical and experimental processes. In the theoretical process, a testable theoretical scale form was created and experimental scale form was produced by applying this theoretical measurement form developed in experimental process to target audience. The scale development process is described in detail below.
Measurement Tool Development Process: In this process, the literature (Porter, 1990; Bulu et al., 2006, 2007 and 2008; Erarslan
et al., 2007, 2008 and 2009; Rodrigus and Khan, 2015; Park et al., 2009; Gümüş and Hızıroglu, 2015; Yazgan and Yigit, 2013) was examined to form the item pool of the scale. In order to develop the item pool of the measurement instrument, firstly researchers examined studies and measurements tools in the literature.
Content Validity: The content validity study was conducted to evaluate the extent to which each item in the instrument pool developed serves the purpose. All items in the pool have been submitted to the opinions of a manager with many years of experience in the airline industry and an academician who has many studies related to the field of aeronautics for the purpose of testing the content validity. With the suggestions of the participants, new items were added outside the item pool and the theoretical measurement tool was finalized. Thus, a 5-point Likert-type measurement tool consisting of 36 items was developed. Scale categories are coded as follows; “I do not find it absolutely competitive (1)”, “ I do not find it competitive (2)”, “I find it moderately competitive (3)”, “I find it competitive (4)” and “I find it absolutely competitive (5).
the number of items in the measurement tool (36). According to Bryman and Cramer (2001), sample size should be at least five times the number of items in the scale. Simple random sampling method was used in the study. The theoretical measurement form was applied to the employees in the population by means of LinkedIn and applied in online form. The online survey was conducted from 17 to 28 of March 2017.
Construct Validity and Reliability: The data obtained from the scale were first tested with Kaiser-Mayer-Olkin (KMO) and Barlett’s sphericity tests in terms of sample suitability and the multidimensional distribution characteristics of the variables. Kaiser-Meyer-Olkin Measure (KMO) is a measure of sample adequacy. Field (2000) determines the lower limit of the KMO value as .50. The KMO value (.89) calculated for the data is greater than this criterion. This value can be interpreted as the sample consisting of
181 participants is quite sufficient to display factorial structures. The result of Barlett’s test was 3531.841 (p<.001). The significance of the results of this test indicates that the matrix formed by the relationships between the variables is appropriate and meaningful for factor analysis.
3.1. Findings
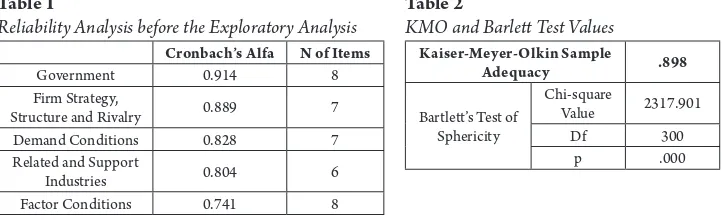
Table 1 shows the reliability of the scale dimensions before the exploratory factor analysis was executed. The Cronbach alpha values of the scale dimensions range from 0.741 to 0.914. In the literature, it is stated that Cronbach alpha value should be at least 0.7 for the reliability of the scales (Gürbüz and Şahin, 2014). When the values in the table below are examined, it can be said that the international competitiveness scale of the Turkish airline industry was reliable before the exploratory factor analysis was executed.
Table 1
Reliability Analysis before the Exploratory Analysis Cronbach’s Alfa N of Items
Government 0.914 8
Firm Strategy,
Structure and Rivalry 0.889 7
Demand Conditions 0.828 7
Related and Support
Industries 0.804 6
Factor Conditions 0.741 8
Table 2
KMO and Barlett Test Values Kaiser-Meyer-Olkin Sample
Adequacy .898
Bartlett’s Test of Sphericity
Chi-square
Value 2317.901
Df 300
p .000
For validity procedures, factor analysis was performed primarily to determine the factors between the items. In the analysis process, the analysis of the basic components was done and finally the varimax rotation process was carried out. Principal component analysis is a widely used method in the literature, although there are different techniques that can be used to reveal factor structures (Klainbaum et al., 1987).
cross load. In this phase, the items of 15, 11, 10, 29, 9, 26, 4, 25 and 2 were removed from the analysis one by one and the analysis was repeated. Item 1 (.384) was subtracted from the scale as it received a load value lesser than .50. It is stated that the minimum 0.40 load factor is a good criterion for item selection (Nunnally, 1994). Item 7 was removed from the analysis because it constituted a separate factor with the .914 laod value.
Table 2 shows the KMO and Barlett test values after the mentioned items were removed from the analysis.
The value of KMO (.89) indicates that sample size is adequate for the analysis. The significance of Barlett’s values (p<.001) supports the hypothesis that data are derived from multivariate normal distribution.
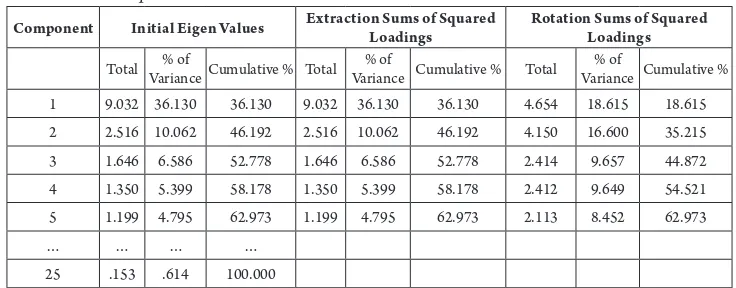
Table 3
Total Variances Explained
Component Initial Eigen Values Extraction Sums of Squared Loadings Rotation Sums of Squared Loadings
Total Variance Cumulative % Total% of Variance Cumulative %% of Total Variance Cumulative %% of
1 9.032 36.130 36.130 9.032 36.130 36.130 4.654 18.615 18.615
2 2.516 10.062 46.192 2.516 10.062 46.192 4.150 16.600 35.215
3 1.646 6.586 52.778 1.646 6.586 52.778 2.414 9.657 44.872
4 1.350 5.399 58.178 1.350 5.399 58.178 2.412 9.649 54.521
5 1.199 4.795 62.973 1.199 4.795 62.973 2.113 8.452 62.973
… … … …
25 .153 .614 100.000
As seen in Table 3, 5 factors were obtained when Eigen value was taken as 1 and as a result of repeated factor analysis. The total explained variance amount of the five factors is 62.9%. The variance amounts
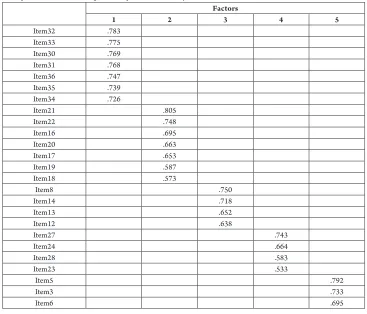
Table 4
Transformed Matrix Components after Factor Analysis
Factors
1 2 3 4 5
Item32 .783
Item33 .775
Item30 .769
Item31 .768
Item36 .747
Item35 .739
Item34 .726
Item21 .805
Item22 .748
Item16 .695
Item20 .663
Item17 .653
Item19 .587
Item18 .573
Item8 .750
Item14 .718
Item13 .652
Item12 .638
Item27 .743
Item24 .664
Item28 .583
Item23 .533
Item5 .792
Item3 .733
Item6 .695
When examining the factors distribution of the items by using Varimax vertical rotation method, it was seen that the scale is aggregated in 5 factors which eigen values are greater than 1 and all the items have acceptable load values (the lowest item load value is .53; the highest
load value is .80). The sub-dimensions were named taking into consideration the literature. In this context, sub-dimensions are named as
Government; Firm Strategy, Structure, and Rivalry; Demand Conditions; Related and Support Industries; and Factor Conditions, respectively.
Table 5
Component and Total Points Correlation
1.Factor 2.Factor 3.Factor 4.Factor 5.Factor
1.Factor 1 .508** .362** .443** .325**
2.Factor .508** 1 .481** .620** .499**
3.Factor .362** .481** 1 .477** .396**
4.Factor .443** .620** .477** 1 .438**
5.Factor .325** .499** .396** .438** 1
Pearson Moments Correlation coefficients are calculated as proof of the validity of the scale and the relations of the scale components with each other and the scale total score are presented in Table 5. When Table 5 is
examined, it is observed that the components have a significant positive correlation with each other and the total score in general. These findings are accepted as a demonstration that the scale has a five-factor structure.
Table 6
Sub-dimensions
Factors Number of Items Item Names
Government 7
• Airline Policy • Tax Policies • Audit Function
• Legislation and Bureaucracy • Incentives
• Politic Stability
• Stability of Macroeconomic Indicators
Firm Strategy, Structure
and Rivalry 7
• Airline Management Strategies • Airline Marketing Strategies • Airline Load Factors
• Global Market Share of the Airline Industry • Strategic Partnerships
• Competition Between Airlines • General Image of Industry
Demand Conditions 4
• Geographical Location • Domestic Passenger Demand • International Passenger Demand • Transit Passenger Demand
Related and Support
Industries 4
• Airport Industry • Ground Handling Services • Maintenance Organizations • Aviation Educational Institution
Factor Conditions 3 • • Skilled WorkforceLabor Productivity
• Information and Technology Infrastructure
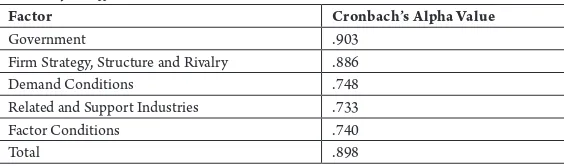
After the validity studies, the reliability a n a l y s i s of f ac tor s a nd item s w a s performed. Cronbach’s A lpha values
calculated on the basis of both the content of each sub-dimension and the total are given below.
Table 7
Reliability Coefficients
Factor Cronbach’s Alpha Value
Government .903
Firm Strategy, Structure and Rivalry .886
Demand Conditions .748
Related and Support Industries .733
Factor Conditions .740
The internal consistency coefficient of the whole scale according to Table 7 is calculated as Cronbach α = .89. In addition, the Cronbach Alpha values of the subscales vary between .73 (related and support industries) and .90 (government). These values indicate that the internal consistency of the scale is high.
3.2. Findings Related to Confirmatory
Factor Analysis
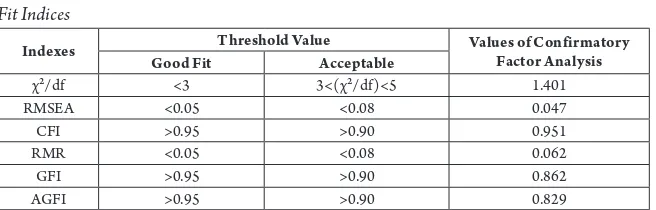
Confirmatory factor analysis was used to test the accuracy of the five-dimensional structure determined by exploratory factor analysis. Table 8 shows fit indices in the literature and values found according to confirmatory factor analysis. As a result of confirmatory factor analysis, it was determined that Chi square/ degree of freedom ratio is 1.401. A value of χ²/df of 3 or below indicates that the model is well fitted. When the RMSEA is examined, it is seen that a fit index of .047 is obtained. The values between 0.01 and 0.06 for RMSEA indicate high compliance (Hu and Bentler,1995). In this frame, it can be said
that the obtained fit index is perfect. When examining other fit indices, it is seen that GFI is .862 and AGFI is .829. While higher than .95 of GFI and AGFI indices indicate perfect fit between .95 and .90 values show good fit (Çokluk et al., 2014). GFI and AGFI values in the confirmatory factor analysis indicate a poor fit. However, a GFI greater than 0.85 and an AGFI greater than 0.80 are considered acceptable lower bounds for model data fit (Anderson and Gerbing, 1984). The standardized RMR fit index is .062. Under the standardized RMR of .05 indicates perfect fit, under the standardized RMR of .08 shows good fit and under the standardized RMR of .10 indicates poor fit (Çokluk et al., 2014). Standardized RMR value for the analysis indicates a good fit. Finally, when the CFI fit index is examined it is seen that CFI is .951. While greater than .95 CFI index shows perfect fit greater than .90 CFI index indicates good fit (Çokluk et al.,
2014). CFI index value for the analysis means perfect fit. In this respect, it can be said that the five-dimensional structure supported by the theory is appropriate.
Table 8
Fit Indices
Indexes Good FitThreshold ValueAcceptable Values of Confirmatory Factor Analysis
χ²/df <3 3<(χ²/df)<5 1.401
RMSEA <0.05 <0.08 0.047
CFI >0.95 >0.90 0.951
RMR <0.05 <0.08 0.062
GFI >0.95 >0.90 0.862
AGFI >0.95 >0.90 0.829
Source: Gürbüz and Şahin (2014)
4. Conclusion
The exploratory analysis shows that the scale developed to determine the international competitiveness of the airline industry is a
components of the scale together account for 62.973% of the total variance. A five-dimensional structure emerged as a result of exploratory factor analysis based on the Varimax rotation method. These dimensions are government (7 items), firm strategy, structure and rivalry (7 items), demand conditions (4 items), related and support industries (4 items) and factor conditions (3 items). It is observed that factor loads vary between .533 and .805. Taking into account the factor structure and reliability coefficients of the developed scale, the scale can be used as a measurement tool to determine international competitiveness of airline industries.
According to confirmatory factor analysis, RMSEA value of .047, CFI value of .951 and AGFI value of .829 show that the model is close to perfect fit but shows good fit. Furthermore, it can be said that the model is appropriate based on the fact that the result of chi-square/degree of freedom (366.936/262=1.401) is less than 5. In conclusion, findings indicate that the scale can be used to determine international competitiveness of airline industry. This study has provided a valid and reliable measurement tool for determining the level of international competitiveness of the airline industry.
The scale developed in this study can be used determine the countries’ international competitiveness power of airline industries. At the macro level, decision-makers can utilize the scale to identify weak points for their airline industry’s international competitiveness and take measures to improve them. For future studies, this scale may be applied to different countries and the results may be compared with Turkey. However, it should be noted that since the
scale is developed in the context of Turkey, confirmatory factor analysis is required before it is applied to another culture.
Acknowledgement
This study is supported by the grant of Anadolu University Scientific Research Board, under the project “Analysis of Competitiveness Level of the Turkish Air Transportation Industry”, Project No: 1605E232.
References
Anderson, J.; Gerbing, W. 1984. The effect of sampling error on convergence, improper solutions, and goodness-of-fit indices for maximum likelihood confirmatory factor analysis, Psychometrika 49: 155-173.
Bakan, I.; Doğan, I. 2012. Competitiveness of the industries based on the Porter’s diamond model: An empirical study, IJRRAS 11(3): 441-455.
Bryman, A.; Cramer, D. 2001. Quantitative data analysis with SPSS release 10 for windows. London, Routledge.
Bulu, M.; Erarslan, H.; Barca, M. 2007. Türk gıda sektörünün uluslararası rekabetçilik düzeyinin analizi [In English: Analysis of the level of international competitiveness of the Turkish food industry], Afyon Kocatepe Universitesi, I.I.B.F. Dergisi 9(1): 311-335.
Bulu, M.; Erarslan, H.; Kaya, H. 2006. Türk elektronik sektörünün rekabetçilik analizi [In English: Competitiveness analysis of the Turkish electronics industry], İstanbul Ticaret Universitesi Sosyal Bilimler Dergisi
9: 49-66.
Chung, T. 2016. A study on logistics cluster competitiveness among Asia main countries using the Porter’s diamond model, The Asian Journal of Shipping and Logistics 32(4): 257-264.
Çokluk, Ö.; Şekercioğlu, G.; Büyüköztürk, Ş. 2014.
Sosyal bilimler için çok değişkenli istatistik: SPSS ve Lisrel uygulamaları [In English:Multivariate statistics for social sciences: SPSS and Lisrel applications], Ankara, Pegem Akademi.
Erarslan, H.; Ipciolu, I.; Hasit, G.; Ersahan, B. 2008. Bilecik bölgesi mermer sektörünün uluslararası rekabetçilik analizi: Sektörel sorunlar ve çözüm önerileri [In English: Analysis of international competitiveness of marble sector in Bilecik region: Sectoral problems and solutions], Mustafa Kemal University Journal of Social Sciences Institute 5(10): 193-217.
Erarslan, H.; Karataş, A.; Kaya, H. 2007. Türk plastik sektörünün rekabetçilik analizi [In English: Competitiveness analysis of the Turkish plastics industry], İstanbul Ticaret Üniversitesi Sosyal Bilimler Dergisi, 11: 203-219.
Esen, S.; Uyar, H. 2012. Examining the competitive structure of Turkish tourism industry in comparison with diamond model, Procedia-Social and Behavioral Sciences 62: 620-627.
Fathi, A.; Ahmadian, S. 2016. Competitiveness of the Iran automotive industry for entrancing into foreign markets, Procedia Economics and Finance 36: 29-41.
Field, A. 2000. Discovering statistics using SPSS for windows, London, Sage Publications.
Gümüş, A.; Hızıroğlu, M. 2015. Measuring and explaining Turkey’s competitiveness in services using balassa index and diamond model, Journal of Business Research Turk 7(2): 195-213.
Gürbüz, S.; ve Şahin, F. 2014. Sosyal bilimlerde araştırma yöntemleri: Felsefe-yöntem-analiz [In English: Research methods in social sciences: Philosophy-method-analysis], Seçkin: Ankara.
Hu, L.; ve Bentler, M. 1995. Evaluating model fit. ThousandOaks.Sage.
Klainbaum, G.; Kupper, L.; ve Muller, E. 1987. Applied regression analysis and other multivariable methods, Boston, PWS-Kent Publishing.
Nunnally, J.; ve Bernstein, H. 1994. Psychometric theory, New York, McGraw-Hill.
Öz, O. 1999. The competitive advantage of nations: The case of Turkey. Ashgate.
Özer, K.; Latif, H.; Sarıışık, M.; ve Ergün, Ö. 2012. International competitive advantage of Turkish tourism industry: A comperative analyse of Turkey and Spain by using the diamond model of M. Porter, Procedia-Social and Behavioral Sciences
58: 1064-1076.
Park, Y.; Zhang, A. 2009. Evaluating competitiveness of air cargo express services, Transportation Research Part E 45(2): 321-334.
Porter, M. 1990. The competitive advantage of nations,
Harvard Business Review March–April: 73-91.
Riasi, A. 2015. Competitive advantages of shadow banking industry: An analysis using Porter diamond model, Business Management and Strategy 6(2): 15-27.
Selli, F.; Erarslan, H.; Chowdhury, D.; Sukumar, A. 2010. International competitiveness: analysis of Turkish animal husbandry: An emprical study in gap region,
Enterprise Risk Management 1(1): 100-114.
Yazgan, A.; Yigit, S. 2013. Türk sivil havacılık sektörünün uluslararası rekabetçilik düzeyinin analizi [In English: Analysis of the level of international competitiveness of the Turkish civil aviation industry], The Journal of Social and Economic Research 25: 421-445.
Zhao, W.; Watanabe, C.; Griffy-Brown, C. 2009. Competitive advantage in an industry cluster: The case of Dalian software park in China, Technology in Society 31: 139-149.