R E S E A R C H
Open Access
Efficient pavement crack detection and
classification
A. Cubero-Fernandez
1*, Fco. J. Rodriguez-Lozano
1, Rafael Villatoro
1, Joaquin Olivares
2and Jose M. Palomares
2Abstract
Each year, millions of dollars are invested on road maintenance and reparation all over the world. In order to minimize costs, one of the main aspects is the early detection of those flaws. Different types of cracks require different types of repairs; therefore, not only a crack detection is required but a crack type classification. Also, the earlier the crack is detected, the cheaper the reparation is. Once the images are captured, several processes are applied in order to extract the main characteristics for emphasizing the cracks (logarithmic transformation, bilateral filter, Canny algorithm, and a morphological filter). After image preprocessing, a decision tree heuristic algorithm is applied to finally classify the image. This work obtained an average of 88% of success detecting cracks and an 80% of success detecting the type of the crack. It could be implemented in a vehicle traveling as fast as 130 kmh or 81 mph.
Keywords: Road safety, Road maintenance, Crack detection, Pavement crack, Automatic detection, Heuristic classifier
1 Introduction
Road safety is one of the main concerns nowadays. Due to their intensive general use, to keep road pavement in good conditions is a critical point to decrease accidents and, as a direct consequence, to decrease mortal victims. Once roads are built, cracks in the asphalt surface may arise due to several different problems. Depending on the severity, those cracks in the road can be aggravated if they are not quickly repaired. The sooner those flaws in the pavement are repaired, the less expensive the repairs are [1].
According to [14] (which is based on [20]), 16% of traffic crashes are produced due to roadway environmen-tal factors (mainly by poor pavement conditions). After the use of a series of Bayesian ordered logistic models, they conclude that the poor pavement condition increases the severity of multi-vehicle crashes on all kind of roads and also increases the severity of single-vehicle crash on high-speed road.
Almost every modern country has thousands of kilo-meters of roads. Visual inspection of the roads has been the most common technique for the maintenance of the asphalt. With such large road networks, it is expensive
*Correspondence: [email protected]
1ATC:1-5, Edificio Leonardo da Vinci, Campus de Rabanales, Universidad de Cordoba, 14071 Cordoba, Spain
Full list of author information is available at the end of the article
and difficult to correctly maintain so many kilometers of asphalt with the limited resources that any public admin-istration has. Thus, new tools to examine automatically roads in an efficient way should be developed.
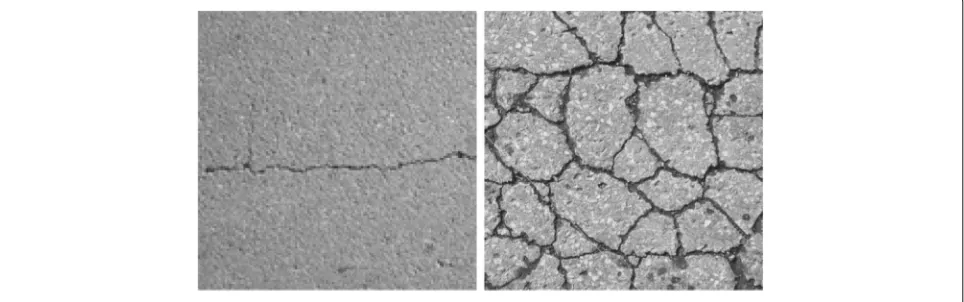
There are several crack types, but they are mainly cate-gorized into three groupings: transverse cracks, longitudi-nal cracks, and alligator (or mesh) cracks [1, 19]. Each type of pavement crack has to be repaired in a different way. Therefore, it is very interesting to be able to detect cracks in the pavement and to be able to classify each of them.
Transverse cracks are perpendicular to the centreline of the pavement. They are usually caused by thermal changes. Other causes are asphalt binder hardening or reflexion cracks provoked by other cracks beneath the asphalt surface.
Longitudinal cracks have two main causes: fatigue and poor joints. Fatigue cracks are produced by a continuous over-load due to heavy vehicles. Joints are generally the least dense areas of the pavement. If joints are located in a high stressed region, a crack could appear.
Finally, alligator cracks are a combination of fatigue causes and unstable asphalt bases. Walker [6] states that unstable asphalt bases occur when base or subbase can-not support adequately the surface layer. This instability is usually caused by a poor drainage or heavy thaws. Further-more, Kay [11] extends the reasons that affect the unstable
asphalt bases to poor trench compaction, settlement, or frost action. A series of interconnected cracks appear in these situations and make the asphalt highly unsta-ble, and pieces of asphalt can be detached in the worst cases.
In addition to these cracks types, many external fac-tors have some influence in crack production: tree roots, landslides, or strong impacts are some of these external factors; nevertheless, these causes are not the main ones.
To repair transverse and longitudinal cracks, minor wide cracks need to be repaired to prevent moisture. On bigger cracks, the cracked pavement layer must be removed and replaced. For small-sized alligator cracks, the reparation consists on removing the cracked pave-ment area, digging out, and replacing the asphalt on that area. On big-sized mesh cracks, the placing of a new pavement layer is needed on the entire pavement surface.
Given some of the main causes and the consequences of the road crack, the detection of the location and the cause of them is a fundamental aspect of the road maintenance. For this reason, millions of euros are spent every day not only building roads but also repair-ing them. However, cracks have to be detected before repairing them. And, as mentioned before, all this work has been carried out mainly by visual inspection, but this technique is tedious and needs much time dedica-tion, and it is expensive because of the intensively use of staff.
Most modern techniques to solve this problem are focused on a two-step procedure: first, the pavement roads are captured using cameras and, in the second stage, the pictures are analyzed for further study. These methods are more precise than human visual checks [9, 16]. There-fore, it may detect cracks that could remain unnoticed in other methods. However, human supervision is included as an extra stage to confirm the detection.
Thus, the final aim of this work is to develop a system which is able to auto-detect cracks on pavement, trying to avoid any human intervention. In the first stage of this work, well-known and contrasted algorithms as logarith-mic transformation, bilateral filter [12], Canny [17, 24, 32], and morphological filtering were used. In the second stage, a crack detection and classification method is pre-sented in a single step. In a future, the system described in this work is intended to be used to build a complete autonomous system.
This paper is organized as follows: Section 2 overviews briefly the related work on pavement crack detection. Section 3 introduces the methodology used and pro-posed. Sections 4 and 5 describe the preprocessing and the automatic crack detection methods, respectively. Finally, Sections 6 and 7 conclude the article with the obtained results and conclusions.
2 Related work
Image-based techniques are fundamental in pavement crack detection, which has received intense attention since the early 1990s. Various approaches have been pro-posed to detect cracks. This section gives a brief overview of them.
Bo Peng [2] made a review of the commonly used meth-ods and algorithms on the scope of this article. In that work, 4 main blocks are detailed: pre-processing meth-ods (image enhancement and de-noising), space-domain recognition algorithms (thresholding, edge detection, and seed growing), frequency-domain recognition algorithms (Wavelet transform), and supervised learning methods.
Zou et al. [35] show how to highlight and clean an image with a crack. The result is a clean picture without noise and a highlighted crack. To achieve the objective, first, a shadow removal method is applied using geodesic shadow removal algorithm. After that, the crack is highlighted by using probability maps comparing intensity differences and using threshold-based algorithms. Tensor voting [18] techniques are used to build the crack probability map. Finally, a minimum spanning tree is built to highlight the crack and remove the noise. On the experimentation, they use 800 ×600 pixel images and the average processing time is 12 s per image. It makes the system unable to be implemented in real-time systems.
These kind of researches are typically based on pictures with good quality, well stabilized, and with high contrast. Li et al. [16] designed a strategy which removes noise and any unnecessary information from an image. FoSA (acronym for F* Seed-growing Approach) was designed. This approach removes one of the main issues for the F* algorithm, which needs to establish the start and the end point previously. In addition, the search field is reduced to increase the efficiency. This improvement reduces the processing time (for a 512×512 pixel image) from 20 to 3 s per image. It is a very good improvement, but insufficient for real-time systems.
Subirats and Dumoulin [29] look for locating and high-lighting cracks based on the wavelet transform. First, the wavelet transform for several scales are applied on the captured images. Finally, a postprocessing step provides a binary image, indicating the presence or not of cracks on the pavement surface image. The main problem of this work is that strong surface textures causes noise in final image, difficulting later crack detection.
the efficiency of the used algorithms cannot be compared. Furthermore, no crack classification is provided by this system.
Huang and Xu [9] describe in their work how they implement a complex system to capture images of the pavement to detect cracks. Once the image is captured, three main steps are performed: divide the image in grid cells of 8×8 pixels and classify each cell into a non-crack or crack cell. After that, crack cells are verified, compar-ing each one to their neighbors and, finally, crack clusters are connected to form the actual final cracks. Based on the starting and ending coordinates, the crack is finally classified as longitudinal or transverse.
As an improvement of their digital highway data vehi-cle (DHDV), Wang and Gong [31] introduce the auto-mated real-time system and summarize the experiences in developing parallel algorithm in image processing used in the real-time system. To achieve this objective, they take advantage of the×86 platform and its new parallel capabilities; however, no execution time is detailed.
Serigos et al. [28] made an independent evaluation of the accuracy and precision of three different laser-based pavement crack detection (two of them based on the same hardware but different proprietary algorithms). These methods provide acceptable results, but due to the capture method, it is difficult to compare the method proposed in this article with Serigos et al. work. Besides, the used equipment in the three methods is significantly higher than the one used in this work.
Li et al. [15] take advantage of neural networks to detect cracks. Before learning and classification process, a pre-processing step is performed. First, the image background is corrected, by making it more uniform. Then, in order to transform the image into a smoother one, a Gaussian smoothing is used. Finally, a histogram transformation is applied to highlight the crack. After the preprocess-ing, several techniques are used to split the image into smaller subimages. The background is removed and each sub-image is classified depending on whether it contains a crack or not. Only the images that contain cracks are selected and two different neural networks are used to classify these images. The first one classifies whether the crack has linear (either transverse or longitudinal) or alli-gator form. After that, the second one classifies between longitudinal and transverse cracks. This method is simi-lar to the proposed system in this work. For this reason, a comparison between the Li et al. method and the pro-posed method in this article is performed in Section 7.2.
In addition to those image methods, others crack detect-ing methods are beginndetect-ing to be explored on this scope. One of them is presented in the work of Kalansuriya et al. [10]. In this work, a surface crack detection based on RFID Tag Antenna is proposed. Under laboratory test-ing, the results are promising. However, as they state in
their paper, the challenges associated with sensor deploy-ment in the real world must also be considered: hostile RF environment, moisture, chemical attack, etc. All these are added to the natural degradation and roughness of the pavement, which makes this system currently unfeasible for the described purpose in this work.
3 Method
In this section, efficient pavement crack detection and classification is described. First, an overview of its design, followed by a detailed introduction of each part is outlined.
The work presented in this article is divided in two parts: image preprocessing and learning and classification. In an ideal situation, after obtaining the image, only the crack should appear. However, asphalt conditions some-times make it almost impossible, as shadows, noise, and some random particles will appear. For this reason, a pre-processing of the image is required. In this first stage, the noise is deleted and the crack is highlighted. This process is carried out using different image processing techniques applying transforms, filters, and other algo-rithms to extract image characteristics. These features are analyzed by a decision tree, to determine whether there are cracks or not, and the type of those detected cracks.
3.1 Features of the input images
For the pavement capture procedure, a first prototype of the system was installed on a vehicle where the distance between the camera and the pavement was 1.2 m. The camera had a field of view of 45 degrees. The camera was situated in zenith position. Therefore, the camera was able to cope with a square pavement area of 99×99 cm. Figure 1 shows the caption diagram explained above. This prototype system captures a video that subsequently is offline processed in the image lab.
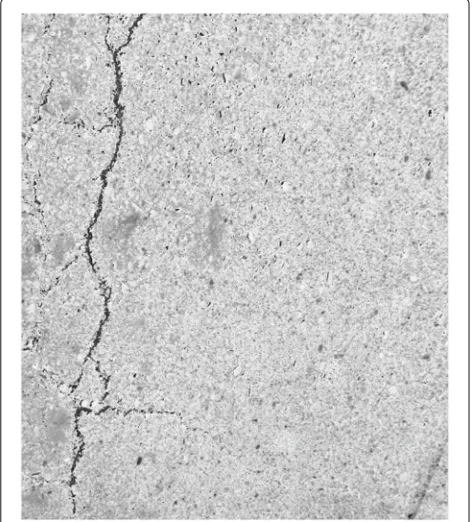
Looking for a good relationship between size and qual-ity, the images have a 320×320 pixel size. If necessary, the original image could be split or resized. This format can be processed without significant lag in current micropro-cessors. Images have to be properly focused and have to be captured with enough quality. Figure 2 shows two images which are ready to be processed.
4 Image preprocessing
Fig. 1Image caption diagram
useful image region and the useless background. There-fore, it is necessary to develop an image preprocessing operation to delete environmental interference as much as possible.
In order to make the process as quick and effective as possible, OpenCV [3] has been used. OpenCV imple-ments natively many computer vision algorithms and can be coded in C++ programming language. The image pre-processing is performed in several steps explained below.
First of all, the image is transformed in a new one in grayscale and negative (Fig. 3). This makes it easier to
work and to visualize the processed image. All the steps in the preprocessing stage are explained below.
4.1 Logarithmic transformation
Logarithmic transformations are usually used to map a short range values of pixels into a wider one. With this transformation, the range of darker pixels is expanded in the image while brighter pixels can be compressed, or the opposite, as needed (Fig. 4).
A simple algorithm for image illumination enhancement was proposed by [13] and improved by [5] in the logarithm space. This latter shows good results as it is able to make use of the logarithm transformation features previously described.
The illumination enhancement formula can be described in Eq. 1.
log(f(i,j))=αlog(a(i,j))+β[log(f(i,j))−log(a(i,j))] (1)
wherelog(f(i,j))is the logarithm of the negative value of the image at pixel(i,j);log(a(i,j))is the logarithm of the average values of the neighborhood of the image at pixel
(i,j). This formula requires two parameters,αandβ(used to highlight darker or lighter pixels); to adapt the behavior of each subpart of the formula to the final result,αandβ are set in Table 1.
This process allows for the emphasizing of the crack, if exists.
4.2 Image smoothing: bilateral filter
Random noise is one of the main problems which may affect the results. Due to pavement physical character-istics, all the pictures may be affected by random and uniform noise, which has to be removed. The bilateral filter [7, 30] is commonly used (in opposition to linear filter) to smooth an image without losing edge preci-sion (which is going to be important for future steps).
Fig. 3Original gray scale image of a crack (left) and negative of the original image (right)
In conventional linear filtering, a constant mask is used in the whole domain taking into account Euclidean dis-tance to the central pixel (calledDomain filter). The main contribution of bilateral filtering is using an additional not linear mask which measures intensity variations with central pixel (range filter).
Domain filter is defined as a Gaussian filter, which fol-lows the Eq. 2, whereσDis the Gaussian filter deviation.
Range filter is defined in Eq. 3, wherea0is the central pixel andσRis the deviation.
Fig. 4Result of applying the logarithmic transform to Fig. 3. This image shows imperceptible dark details of the original image to appear more clearly
d(x,y)=e−
x2+y2 2σ2
D (2)
r(ai)=e
−(f(ai)−f(a0))2 2σ2
R (3)
The domain filter aim is to transform the image in a smoother one and the goal of range filter is to enhance the intensity discontinuities. This filter works compar-ing each near pixel intensity with the central one, where lower pixel weights mean higher intensity differences. Finally, the resulting filter applied to the image is obtained by a point-to-point multiplication between both masks. Figure 5 shows the result of applying bilateral filtering to a crack image.
For this work, a fast approximation of the bilateral filter [25] has been used. The test carried out in this work demonstrates that this approximation reduces in one order of magnitude the processing time of the standard OpenCV bilateral filter function.
4.3 Edge detection: Canny algorithm
One of the most used methods to detect edges is the first derivative of the image intensity, because it is zero
Table 1Algorithm parameters
Logarithmic transformation A 0.9
B 1.1
Bilateral filter sigmaColor 35
sigmaSpace 16
Canny algorithm Threshold 1 90
Threshold 2 100
Morphological filtering Kernel 3×3
Fig. 5Result of applying the bilateral filter to Fig. 4. After a bilateral filter, the image is smoother while edges are mostly preserved
on every low-variation regions and provides a constant value in a transition. Therefore, a change in the intensity (a possible edge) is revealed as an abrupt first derivative change. This characteristic is commonly used to detect edges. Canny algorithm [4] is based on this technique.
Canny algorithm consists of three main steps: • Find the intensity gradient of the image: In this step
the scale of the gradient vector is calculated for each pixel.
• Non-maximum suppression: The aim of this step is to “thin” the edge to obtain a one-pixel width edge.
• Threshold hysteresis: Finally, a two-step threshold hysteresis is applied in order to decrease the fake edges.
In addition to the previous three steps, a final fourth step is included. Noise in the image can cause opened edges that should be closed. This is achieved looking for opened edges and continuing its direction based on the direction of the maximum gradient until another opened edge.
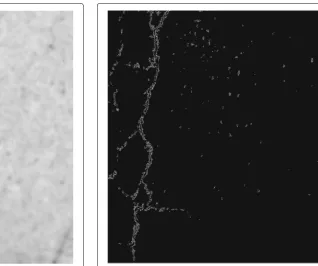
Figure 6 shows the result of applying Canny algorithm to a crack image with a previously applied bilateral filter.
4.4 Morphological filtering
Morphological filters are based on the mathematical mor-phology based on set theory. There are many different types of morphological filtering, but after analyzing the
Fig. 6Result of applying the Canny edge detector algorithm to Fig. 5. The crack is now clearly identified
results, the best filter for this work is the closing filter. Closing filter helps to fill minor gaps in the image making the main crack continuous and more detailed.
Closing filter is defined as a dilation followed by an ero-sion. Closing filter applied to an image A by a structuring element B is defined as the dilatation of A by B followed by an erosion by the same structuring element. If the result-ing A image does not change after the process, A is closed regarding B.
The dilatation process produces an extension of the original image. Due to this extension, the gaps are filled at the expense of increasing the size of the objects in the image. For this reason, an erosion process is performed to decrease the object size to their original size.
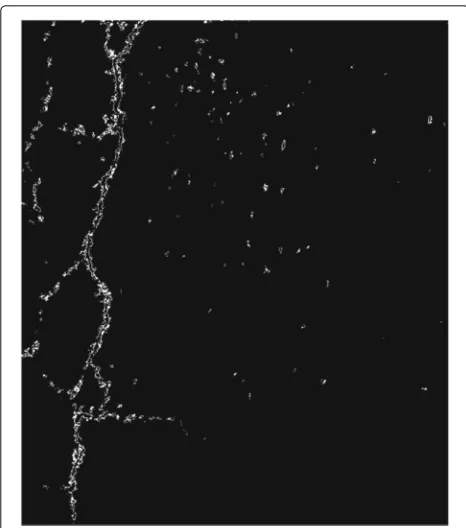
Figure 7 shows the result of applying closing morpho-logical filter to a crack image with a previously applied Canny algorithm.
4.5 Preprocessing parameters
In Table 1, an overview of the main parameters of the used algorithms is shown. These values were selected with a heuristic methodology, in a trial-by-error basis, with visual supervision of the results. These parameters pro-vide best average visual results, for the whole set of test images, which will be further explained in Section 5.
Fig. 7Result of applying the morphological closing operator to Fig. 6. The crack was clearly defined and, in addition, now is also highlighted
5 Feature extraction
All the previously applied preprocessing work provides a final image with clearly defined cracks (if exist). However, heuristic methods cannot deal with this format. Thus, the image has to be transformed for the learning pro-cess, trying to lose as less information as possible. For this purpose,projective integralsare used.
5.1 Simplifying images: projective integrals
In projective integral technique, each output value is the arithmetic mean of a row or column pixels. This method is commonly used in face recognition combined with other methods.
This work uses 320×320 pixel images, which means 102,400 data. After projective integral process, each image is transformed into 640 data (320 obtained from the ver-tical projective integral and 320 for the horizontal one). There is an important information reduction, while still maintaining a good representation level.
Figure 8 shows the result of obtaining the horizontal and vertical projective integrals of a crack picture, respec-tively. In the horizontal projective integral figure, vertical axis represents each row of the image. The horizontal axis represents the addition of the pixels of each row which have been detected as edges by Canny method. For the vertical projective integral, the axis
representa-tion is swapped. Horizontal axis represents each column of the image, and the vertical axis represents the addition of the pixels detected as edges by Canny method in each column.
After projective integral stage, the images are fully pro-cessed and the information for the learning and classifica-tion step has been extracted.
6 Automatic crack detection and classification Learning and later classification are performed using deci-sion trees. Decideci-sion tree is one of the most used inductive learning methods. A decision tree deals with an unknown function approximation based on positive and negative examples of that function. The examples are [x,f(x)] pairs, wherexis the input value andf(x)is the value of the unknown function applied tox. In a decision tree, each tree node is an attribute and each branch is a possible attribute value.
6.1 Learning and classification process
Learning applications need data input and results. In this application, the input data are the projective integrals of the image and the results are whether there is a crack or not and the type of the crack, if exists.
C4.5 [27] was based on ID3 algorithm [26]. C4.5 algo-rithm is used to generate decision trees. These decision trees can be used afterwards for classification. For this reason, C4.5 algorithm is called a statistic classifier.
In order to carry out the implementation, Weka [8] suite has been used due to its ease to work with sev-eral integrated tools. The Weka suite open source imple-mentation of the C4.5 decision tree algorithm has been named J48. This implementation is able to create pruned and unpruned C4.5 decision trees. In order to achieve it, J48 requires a set of training data of already classi-fied samples. After that, J48 algorithm divides the samples based on the attribute that provides the highest nor-malized information gain value to make the split and making this mechanism to be recursive until the base cases are matched. These base cases are as follows: (a) all the samples in the sublist belong to the same class; (b) there is no information gain after the division of the previous sample set; and (c) the division of the previous sample set provides a new non-previously encountered class. Each base case generates a different structure in the decision tree.
Fig. 8Horizontal and vertical projective integral example
7 Results and discussion
The experimental test environment has been carried out with 400 pictures. Each picture has been manually identified and classified by an expert. The experimental set consists of 100 pictures of each crack type: non-crack, transverse cracks, longitudinal cracks, and alligator cracks.
In the learning process, a cross-validation technique has been used with a set of 600 preidentified images. In this technique, the learning process is executed several times using different learning and validation sets. Finally, a mean of the results is computed. After the learning process, the proposed system produced two different classification models. The first one is for the vertical projective inte-gral, which has a depth of 23 levels and 45 nodes, whereof 23 are leaf nodes. The second classification model is for the horizontal projective integral, which is composed of 9 levels of depth and 23 nodes, whereof 12 are leaf nodes.
7.1 Classification accuracy
Table 2 shows the system evaluation results.Success col-umn shows the successfully classified images and Error column shows the wrong type classified images. An image with a kind of crack that has been classified as another kind of crack or as a non-crack image will be treated as a wrong classified image in this table. In this classification, the success percentage is higher than 67% for every crack type and higher than 80% in most cases.
Table 3 is a complement of the Table 2. In this table, the type of error the system has committed is detailed. Each type of crack (T. stands for Transverse; L. means Longitu-dinal, and M. is Mesh or Alligator crack type) is described in the first column. The first row indicates the error per-centage of cracks identified as another crack type, and the second row indicates the percentage of images with cracks identified as a non-crack image. It can be observed that most errors (80% on average) appear because the system classifies the crack into another type of crack.
Table 4 is the result of mixing Tables 2 and 3. It is one of the most important tables because it shows the crack vs non-crack classification error. In this work, it is important to differentiate which kind of crack is in the image. How-ever, in the real implementation, it is more important to detect whether a crack exists in order to make repairing in spite of a wrong crack classification. In Table 4, the type of
Table 2Experimental results
Type Success Error
Transverse (T.) 72% 28%
Longitudinal (L.) 67% 33%
Mesh/Alligator (M.) 97% 3%
None 85% 15%
Table 3Type of classification error
Type T. L. M. AVG.
Crack 67.85% 72.72% 100% 80.19%
Non-crack 23.14% 27.27% 0% 19.81%
the crack is eliminated in order to measure the precision of the system detecting cracks regardless of the actual type of crack.
The obtained results are in the average of the revised articles. For instance, in [9], authors provide a correlation factor of 0.91 for longitudinal cracks and 0.96 for vertical, and no analysis was provided for alligator cracks, and in [15], authors provide 87.5% for linear (both longitudinal and vertical) cracks and 97.5% for alligator cracks. These results will be further analyzed in Section 7.2. For the pro-posed method, an average of 88% of success is achieved when detecting any type of cracks. Furthermore, the low-est value of success identifying the kind of the crack for any type is 67%, for the transverse cracks. However, these values are much higher for other types of crack, reaching 100% in the alligator ones. It is to be remarked that these values are obtained with a database with a large number of images, while other authors use much smaller databases.
In order to compare with other authors, the original codes were not available for downloading. Furthermore, it was not possible to find the crack image database used by other authors. Therefore, the comparison of the perfor-mance of DAGRI using another crack image database has been very difficult to achieve.
7.2 Comparison with other methods
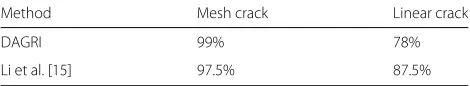
Tables 5 and 6 show a comparative between DAGRI and the method proposed by Li et al. [15]. In order to make DAGRI results to be compared with other systems, all the non-crack images have been removed as the Li et al. did. It should be noted that Li et al. method performs their experiment with a significantly fewer number of images (80/278 for Li et al. method and DAGRI method, respec-tively, for the first experiment, and 50/141, respecrespec-tively, for the second experiment).
Table 5 shows that the results obtained from the pro-posed method are similar to the ones provided by the other system for the first experiment. However, in the second experiment where the system classifies between
Table 4Crack detection error
Type Success Error
Crack 91% 9%
Non-crack 85% 15%
AVERAGE 88% 12%
Table 5Comparative results with Li et al. method for general classification of pavement cracks
Method Mesh crack Linear crack
DAGRI 99% 78%
Li et al. [15] 97.5% 87.5%
transverse and longitudinal cracks (Fig. 6), DAGRI is less precise. Nevertheless, the proposed system is able to deal with non-crack images. In fact, Li et al. method needs a previous pre-classification to discern between non-crack and crack images. Furthermore, there is no reference to this classification and the error rate. Finally, there also is not any time reference, and therefore, the proposed system cannot be compared with Li et al. work in this aspect.
7.3 Processing time
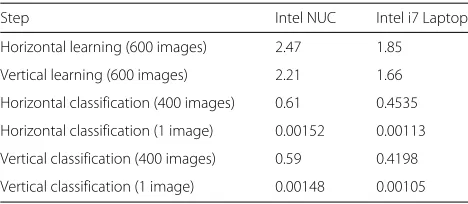
As important as the accuracy is the processing time. Good processing times allow for real time crack detec-tion. Two systems were tested to perform the com-plete experimentation process: an embedded Intel NUC based on a dual-core Intel i3 5010U processor running at 2.1 GHz and a laptop based on a quad-core Intel i7 3610QM running a 2.3 GHz. Table 7 shows mean time values for each step involved in the preprocessing process for each system. Meanwhile, Table 8 shows the learning and classification times for a set of 600 and 400 images, respectively, for each system.
For a total processing time computation, an addition of preprocessing time, horizontal classification, and vertical classification is needed. In the final experimental tests, based on the Intel i7 laptop system, this addition results in 26.47 ms or, in other words, the system is able to process 37.78 images per second, also called frames per second, when a video sequence is analyzed.
For further real implementation of the system, a compu-tation of the maximum speed is needed to achieve a real-time system. Nowadays, cameras have an angle of view of 45 degrees approximately and the camera is placed at 1.2-m height. It provides an image size of 0.99m2. There-fore, in the maximum speed that the caption vehicle could reach 135.2 km/h, this is also 84 mph. For such speed, a high speed camera with autofocus is required in order to obtain good images with little blur. To achieve these
Table 6Comparative results with Li et al. method for classification of linear cracks
Method Transverse crack Longitudinal crack
DAGRI 77.7% 73%
Table 7Processing average time for each step of the preprocessing and the total time
Step Intel NUC Intel i7 Laptop
Negative 5.93 4.66
Logarithmic transf. 9.11 8.37
Bilateral filter 12.59 10.13
Canny Algorithm 0.58 0.48
Morphological filtering 0.15 0.13
Projective integrals 0.61 0.51
Total preproc. time 29.0 24.29
Each time is measured in two different machines: Intel BOX NUC-5I3RYH versus laptop with an Intel i7 3610QM processor. All times are expressed in milliseconds
speeds, several tools can be used to improve the efficiency and computation speed, such as using highly efficient video coding (i.e., HEVC [33, 34]). If further computing speed is required, it is possible to make some coding opti-mizations in the processing algorithms. For instance, the combination of the logarithmic transformation and the Canny algorithms could be achieved with the LIP–Canny mechanism [23]. This algorithm has obtained larger opti-mization by reimplementing LIP–Canny using CUDA high-performance computing on Nvidia GPU [22]).
8 Conclusions
The main result is a new crack classification system with a high success ratio. A comparison with the work of [15] is provided. Li obtains better results, but these results are based on a selection of images previously selected, all of them containing cracks, and no data about success and performance are provided. The result of the research is a classification system, which divides a batch of images tak-ing into account the kind of the crack. It is performed with high success ratio. In any case, this work can be continued and improved.
It is important to remark that the good results obtained have been achieved with two simple characteristics: hor-izontal and vertical projective integrals. Future work and implementations of the method could make use of more
Table 8Learning and classification time. Times are expressed in seconds
Step Intel NUC Intel i7 Laptop
Horizontal learning (600 images) 2.47 1.85
Vertical learning (600 images) 2.21 1.66
Horizontal classification (400 images) 0.61 0.4535
Horizontal classification (1 image) 0.00152 0.00113
Vertical classification (400 images) 0.59 0.4198
Vertical classification (1 image) 0.00148 0.00105
advanced characteristics, as the use of Hough transform to detect lines and the angle of those lines. All the proposed experiments have been made in a simulation environment with previously captured images without any time restric-tion. Therefore, the next step in the research is to integrate them in a real system. As a future work, an integration on the car-on-board embedded system to achieve online real time will be performed. Furthermore, the crack classifica-tion will be sent to a main server to keep track of the pave-ment defects with the help of a GPS device and a cellular modem. This improvement should be carried out without serious difficulties, because the background preprocess-ing is not excessively complex. In terms of precision, future revisions of this work will be focused in the suc-cess improvement, especially on longitudinal-transversal distinction.
Finally, we consider this research line is interesting and should be exploited. Nevertheless, it is difficult to find a public pavement image database to work with.
Funding
This work has been partially funded by the project “XXPP. Modalidad 4.1”, Universidad de Cordoba, Spain.
Authors’ contributions
In this section, the contributions of each author are exposed. ACF is the main author. He obtained the results, made the research and comparison with other authors, and wrote the article. FJRL helped optimizing the code with OpenCV and fine-tuning the parameters of the algorithms to obtain the best results. RV took the photos for the experimentation stage, developed the main outline of the algorithm, and obtained the preliminary results for the classification phase. Finnally, JOB and JMPM are the chief researchers who established the idea, made the bibliography review, analyzed the results, and proposed the optimization of the parameters. They supervised all the work, reviewed the article, and helped in all the process. All authors read and approved the final manuscript.
Competing interests
The authors declare that they have no competing interests.
Publisher’s Note
Springer Nature remains neutral with regard to jurisdictional claims in published maps and institutional affiliations.
Author details
1ATC:1-5, Edificio Leonardo da Vinci, Campus de Rabanales, Universidad de
Cordoba, 14071 Cordoba, Spain.2LV6B170, Edificio Leonardo da Vinci, Campus de Rabanales, Universidad de Cordoba, 14071 Cordoba, Spain.
Received: 26 January 2017 Accepted: 30 May 2017
References
1. M Ann, P Johnson, Best Practices Handbook on asphalt pavement maintenance.Minnesota Technology Transfer (T2 ) Center / LTAP Program (2000). http://www.cee.mtu.edu/~balkire/CE5403/AsphaltPaveMaint.pdf 2. P Bo, Review on automatic pavement crack image recognition algorithms.
Pattern Recogn.46(2), 133–144 (2015). doi:10.1111/j.1551-2916.2005. 00743.x
3. G Bradski, Others, The OpenCV library. Doctor Dobbs J.25(11), 120–126 (2000)
5. G Deng, L Cahill, G Tobin, The study of logarithmic image processing model and its application to image enhancement. IEEE Trans. Image Process.4(4), 506–512 (1995). doi:10.1109/83.370681
6. TD Donald Walker,Pavement Surface Evaluation and Rating (PASER) Manuals. (Wisconsin Transportation Information Center, Wisconsin, 2002). http://www.apa-mi.org/docs/Asphalt-PASERManual.pdf
7. J Dorsey, Fast Bilateral Filtering for the Display of High-Dynamic-Range Images. Vine.21(3), 257–266 (2001)
8. M Hall, E Frank, G Holmes, B Pfahringer, P Reutemann, IH Witten, The WEKA data mining software: an update. SIGKDD Explor. Newsl.11(1), 10–18 (2009). doi:10.1145/1656274.1656278, http://doi.acm.org/10.1145/ 1656274.1656278
9. Y Huang, B Xu, Automatic inspection of pavement cracking distress. J. Electron. Imaging.15(1), 013–017 (2006). doi:10.1117/1.2177650 10. P Kalansuriya, R Bhattacharyya, S Sarma, RFID tag antenna-based sensing
for pervasive surface crack detection. IEEE Sensors J.13(5), 1564–1570 (2013). doi:10.1109/JSEN.2013.2240155
11. RK Kay,Pavement Surface Condition - Rating Manual. Northwest Technologies Transfer Center.Northwest Technologies Transfer Center. Washington State Department of Transportation, (Washington, 1992) 12. A Laghrib, A Hakim, S Raghay, A combined total variation and bilateral
filter approach for image robust super resolution. EURASIP J. Image Video Process.2015(1), 19 (2015). doi:10.1186/s13640-015-0075-4
13. JS Lee, Digital image enhancement and noise filtering by use of local statistics (1980). doi:10.1109/TPAMI.1980.4766994
14. J Lee, B Nam, M Abdel-aty, Effects of pavement surface conditions on traffic crash severity. J. Transp. Eng.11, 1–11 (1996).
doi:10.1061/(ASCE)TE.1943-5436.0000785
15. L Li, L Sun, G Ning, S Tan, Automatic pavement crack recognition based on Bp neural network. PROMET-Traffic Transp.26(1), 11–22 (2014) 16. Q Li, Q Zou, D Zhang, Q Mao, FoSA: F* seed-growing approach for
crack-line detection from pavement images. Image Vis. Comput.29(12), 861–872 (2011). doi:10.1016/j.imavis.2011.10.003
17. A Manzanera, TP Nguyen, X Xu, Line and circle detection using dense one-to-one Hough transforms on greyscale images. EURASIP J. Image Video Process.2016(1), 46 (2016). doi:10.1186/s13640-016-0149-y 18. G Medioni, MS Lee,Tensor Voting : Theory and Applications.Congres
francophone sur la Reconnaissance des Formes et l’Intelligence Artificielle (RFIA). (Northwest Technologies Transfer Center. Washington State Department of Transportation, Paris, 2000), p. 3
19. JS Miller, RB Rogers, GR Rada, inDistress Identification Manual for the Long-Term Pavement Performance Project. Appendiz A - Pavement Distress Types and Causes, (National Cooperative Highway Research Program, At NW Washington, 1993), pp. 1–31
20. NHTSA,National Motor Vehicle Crash Causation Survey Report to Congress, (2008), pp. 1–47. http://www-nrd.nhtsa.dot.gov/Pubs/811059.PDF, Accessed Jan 2017
21. A Ouyang, C Luo, C Zhou, Surface distresses detection of pavement based on digital image processing. IFIP Adv. Inf. Commun. Technol.347 AICT(PART 4), 368–375 (2011). doi:10.1007/978-3-642-18369-0_42 22. R Palomar, JM Palomares, JM Castillo, J Olivares, J Gomez-Luna,
Parallelizing and optimizing LIP-Canny using NVIDIA CUDA. Lect. Notes Comput. Sci.6098 LNAI(PART 3), 389–398 (2010).
doi:10.1007/978-3-642-13033-5_40
23. JM Palomares, J González, E Ros, inAERFAI 2005. Detección de bordes en imágenes con sombras mediante LIP–Canny, (Simposio de
Reconocimiento de Formas y Análisis de Imágenes, AERFAI’2005, At Granada, 2005)
24. DS Pandya, Ma Zaveri, A novel framework for semantic analysis of an illumination-variant soccer video. EURASIP J. Image Video Process.
2014(1), 49 (2014). doi:10.1186/1687-5281-2014-49
25. S Paris, A fast approximation of the bilateral filter. Int. J. Comput. Vis.81, 24–52 (2009). doi:10.1007/s11263-007-0110-8
26. JR Quinlan, Induction of decision trees. Mach. Learn.1(1), 81–106 (1986). doi:10.1023/A:1022643204877. http://dx.doi.org/10.1023/A:
1022643204877
27. JR Quinlan,C4.5: Programs for Machine Learning. (Morgan Kaufmann Publishers Inc., San Francisco, 1993)
28. PA Serigos, SM Asce, JA Prozzi, M Asce, Smit ADF, Murphy MR, Evaluation of 3D automated systems for the measurement of pavement surface
cracking. J Transp. Eng, 1–8 (2012). doi:10.1061/(ASCE)TE.1943-5436. 0000841
29. P Subirats, J Dumoulin, Automation of pavement surface crack detection using the continuous wavelet transform. Image Process.1(1), 3037–3040 (2006)
30. C Tomasi, R Manduchi, Bilateral filtering for gray and color images. Int. Conf. Comput. Vision, 839–846 (1998). doi:10.1109/ICCV.1998.710815 31. KCP Wang, W Gong, Real-time automated survey system of pavement
cracking in parallel environment. J Infrastruct. Syst.September, 154–164 (2005). doi:10.1061/?ASCE?1076-0342?2005?11:3?154?
32. Y Wang, C He, Image segmentation algorithm by piecewise smooth approximation. EURASIP J. Image Video Process. 1–13 (2012). doi:10.1186/1687-5281-2012-16
33. C Yan, Y Zhang, J Xu, F Dai, L Li, Q Dai, F Wu, A highly parallel framework for HEVC coding unit partitioning tree decision on many-core processors. IEEE Signal Process. Lett.21(5), 573–576 (2014a). doi:10.1109/LSP.2014. 2310494
34. C Yan, Y Zhang, J Xu, F Dai, J Zhang, Q Dai, F Wu, Efficient parallel framework for HEVC motion estimation on many-core processors. IEEE Trans. Circ. Syst. Video Technol.24(12), 2077–2089 (2014b).
doi:10.1109/TCSVT.2014.2335852