DOI : https://doi.org/10.32628/IJSRST18401115
Modeling and Swarm Intelligence Based Control of Hybrid
Wind-PV System for Grid Integration
B. Manoj Kumar1, P. Ramesh2
1PG Scholar, Department of EEE, QCET, Venkatachelam, Andhra Pradesh, India 2Assistant Professor, Department of EEE, QCET, Venkatachelam, Andhra Pradesh, India
ABSTRACT
With the degradation of fossil fuels, recent era witness the penetration of renewable energy sources like wind and solar energy into various electrical applications. Integration of these renewable energy sources is of prime importance as they possess zero carbon emission, environmental friendly and zero fuel cost. However, the unpredictability and unreliable nature of solar and wind motivates the combine utilization of these sources i.e. hybrid energy systems. These systems are more reliable and have better continuous production of electrical energy than using the sources individually. Combination of hybrid energy system into grid/standalone applications demands the use of power electronic interface and appropriate control strategy. In this context, this thesis aims at development of a hybrid Photovoltaic (PV)/wind energy based systems for grid connected application. PV and wind are hybridized on a DC side to avoid the synchronizing issues between the sources. However, the proposed hybrid system is integrated on distribution side of the grid with a DC/AC converter (inverter). Considering the essential need of synchronization, the control input i.e. pulses to the inverter are generated from a voltage and frequency controller i.e. Phase Lock Loop (PLL).The task of tuning the controller is formulated as an optimization problem and is solved using Particle Swarm Optimization (PSO) technique. The objective of the system is to meet the load demand and to manage the power generated from different sources at different operating conditions. Each module in the complete system is modeled on Matlab/Simulink platform. Also, the performance of the system is tested for additional utilization of battery charging.
Keywords : Phase Lock Loop, Swarm Intelligence, PV System, Grid Integration, ITAE, integral square error, Particle Swarm Optimization Algorithm.
I.
INTRODUCTIONA hybrid renewable PV–wind energy system is the combination of solar PV, wind turbine, inverter, battery, and other addition components. A number of models are available in the literature of PV–wind combination as a PV hybrid system, wind hybrid system, and PV–wind hybrid system, which are employed to satisfy the load demand. Once the power resources (solar and wind flow energy) are sufficient excess generated power is fed to the battery until it is
element, is satisfactory the actual hybrid system will offer electrical power at the very least charge.
PV and wind system, depending on weather condition, individual hybrid PV and hybrid wind system does not produce energy throughout the year.
For better performance of the standalone individual PV or wind combination, battery backup unit and diesel generator set are considered which increase the hybrid system cost. The current report offers a new strategy determined by the iterative approach, to accomplish the suitable sizing of any standalone hybrid PV and WIND systems. Hybrid PV–wind system performance, production, and reliability depend on weather conditions. Hybrid system is said to be reliable if it fulfils the electrical load demand. A power reliability study is important for hybrid system design and optimization process.
As the hybrid renewable energy system is the combination of different renewable energy sources, diesel generator–conventional sources, and energy storage system it is very difficult to get output at maximum efficiency and reliability without applying any proper control strategy. In hybrid renewable energy system, for a variable, monitoring and power supply load for the requirement is done by the controller. Controller keeps the output voltage, frequency and determines the active and reactive power from different energy sources. Different types of controller are applied in a hybrid renewable energy system according to the requirement of different energy sources, output power, and control strategy. Controller, predominantly are of four types as centralized, distributed, hybrid (combination of centralized and distributed) control, and multiple control system. In each one of the cases, every source is expected to have its own controller that can focus on ideal operation of the relating unit taking into account current data.
In the centralized control arrangement, the entire energy source’s signals and storage system are controlled by centralized (master controller) arrangement. Multi-objective energy unit framework can accomplish global optimization in view of all accessible data. The disadvantage of this centralized unit is that it suffers from heavy computation load and is subjected to single-point failures. The second control unit is the distributed control unit; in this, unit single energy source is connected to individual to local control unit and thus control units are connected to each other for communicating measurement signals and take a suitable assessment for global optimization.
This control unit more advantageous as compared to the centralized control unit because it calls for a minimum computational load without any failure. Withal, this control structure has the shortcoming of multi-faceted communication systems among local controllers. This problem of distributed control unit can be solved by artificial algorithm techniques. Multi-agent system is a standout among the most encouraging methodologies for a distributed control unit. The third control arrangement is a hybrid control unit. Hybrid control unit is the arrangement of centralized and distributed control units. In hybrid control unit, renewable sources are assembled within the integrated system.
In this hybrid control unit, local optimization in a group and global optimization with different groups are obtained by centralized control unit and distributed control unit, respectively. This hybrid control unit is more advantageous and suitability over other control units because it takes less computation burden which reduces the failure problem of the system.
operation of this control unit is almost the same as the hybrid control unit but the advantage is it has supervisor control which takes care about real-time operation of each energy unit on the basis of control objective within millisecond range. It also facilitates with the two way communication existing among diverse levels to execute choices. The drawback of this control unit is the potential complexity of its communication system.
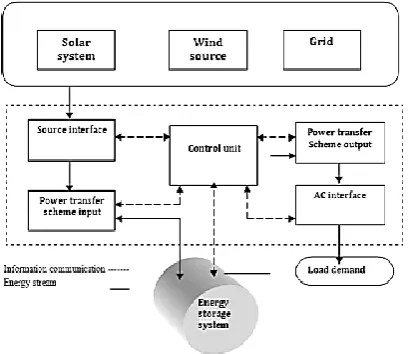
Figure 1. Energy Flow And Data Communication Information.
The paper is organized as follows. Profoundly studying the system model and constructing the objective formulation in Section 2. The particle swarm( PSO ) optimization algorithm will be introduced in Section 3. In Section 4, simulation example is provided to demonstrate the effectiveness of proposed system. Finally, concluding remarks are collected in Section 5.
II.
OBJECTIVE FUNCTIONA. System Model
Figure 2. Block diagram
Using this system power generation by windmill when wind source is available and generation from PV module when light radiation is available. By providing the battery uninterrupted power supply is possible when both sources are idle. Fig shows the functional block diagram of hybrid wind solar energy system. The power generated from wind mill is of AC voltage which is converted through AC-DC rectifier. The controller incorporated in this scheme, which regularly refers the operation of sources and switches the corresponding converters and fed into change the battery or to the load through inverters. The output of the inverter is connected with the load and after that the voltage is stepped up by a transformer.
B. Objective function:
The objective function considered here is based on error criterion. This work utilizes performance indices as objective function. Controller performance is evaluated in terms of integral square error (ISE), integral absolute error (IAE), integral time multiplied by absolute error (ITAE).PID controller is tuned based on the minimum value of performance index.
IISE ∫ ( )
IIAE = ∫ | ( )|
IITAE =∫ | ( )|
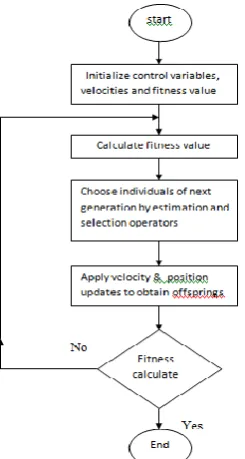
Particle Swarm Optimization Algorithm
Particle Swarm Optimization, first introduced by Kennedy and Eberh-art, is one of optimization algorithms. It was developed through simulation of simplified social system, and has been found to be robust in solving continuous nonlinear optimization problems.PSO can generate a high quality solution within shorter calculation time and stable convergence characteristic than other stochastic methods.
PSO is a population based stochastic optimization technique where individuals, referred to as particles, are grouped into a swarm. Each particle in the swarm represents a candidate solution to the optimization problem. In PSO technique each particle is flown through a multidimensional search space, adjusting its position in search space according to its own experience and that of neighbouring particles. A particle therefore makes use of best position encountered by it and that of its neighbours to position itself toward an optimal solution The effect is that particles fly toward a minimum, while still searching a wide area around the best solution. The performance of each particle is measured using a predefined fitness function, which encapsulate the characteristics of the optimization problem. Algorithm of PSO is as follows,
Step 1 : Set up the control parameters of PSO Optimization process that are population size, Acceleration constants(C1,C2), Convergence criterion, Number of problem variables, Lower and limits of variables and maximum number of iterationsCreate an initial population of particles with random positions and velocities. The positions ( ) and velocity ( ) of initial swarm of the particle are randomly generated using lower and upper bounds of
design variables. The particle position and velocity
are generated as follows
( )
( )
Step-2 : For each particle calculate the value of fitness function.Step-3: Compare the fitness of each particle with personal best position (pbest).If current solution has best fitness then replace pbest with current fitness.
Step-3 : Compare the fitness of all particles with global best (gbest).If any of the particles is better than gbest, and then replace gbest.
Step-4 : Update the velocity and positions of all particles. The velocity of particle is updated as
( ) (
)
Where
is the velocity of ith particle at time k.
c1,c2 are acceleration constants.r1,r2 are random variables. is the personal best position of
particle at time k. is the global best position of
particle. is the position of particle at time k.
The position of the particle is updated as
Figure 3. Flowchart of PSO
III.
SIMULATIONA. Controlling with PID:
The basic control loop can be simplified for a single-input-single-output (SISO) system as in Fig.5.2. Here we are neglecting any disturbance present in the system. The controller may have different structures. Different design methodologies are there for designing the controller in order to achieve desired performance level.
Figure 4. Closed Loop SISO System
But the most popular among them is Proportional-Integral-derivative (PID) type controller. In fact more than 95% of the industrial controllers are of PID type. As is evident from its name, the output of the PID controller u(t) can be expressed in terms of the input e(t), as:
U(t)=kp [e(t)+τd ( )
∫ ( ) ]
and the transfer function of the controller is given by: c(s)=kp [1+τds+
]
The terms of the controller are defined as: Kp= Proportional gain
τd= Derivative time, and τi= Integral time.
In the following sections we shall try to understand the effects of the individual components- proportional, derivative and integral on the closed loop response of this system. For the sake of simplicity, we consider the transfer function of the plant as a simple first order system without time delay as:
P(s) =
B. Controlling will PLL:
The block diagram of a basic PLL is shown in the figure below. It is basically a flip flop consisting of a phase detector, a low pass filter (LPF), and a Voltage Controlled Oscillator (VCO).
Figure 5. Block Diagram – Phase Locked Loops
Both the input frequency and output frequency are compared and adjusted through feedback loops until the output frequency equals the input frequency. Thus the PLL works in these stages – free running, capture and phase lock.
As the name suggests, the free running stage refer to the stage when there is no input voltage applied. As soon as the input frequency is applied the VCO starts to change and begin producing an output frequency for comparison this stage is called the capture stage. The frequency comparison stops as soon as the output frequency is adjusted to become equal to the input frequency. This stage is called the phase locked state. Now let us study in detail about the various parts of a PLL – The phase detector, Low Pass Filter and Voltage Controlled Oscillator.
Let us consider the free running frequency to be fr. Let fr be the frequency at which the Voltage Controlled Oscillator (VCO) is running without input signal. Let the input signal fi that is increasing from zero be applied to the phase comparator. A graph between the error voltage and input frequency is shown below. It can be seen that when the input frequency is lesser than fi1,the error voltage Ver is reduced to zero. At this time the VCO will operate at the free running frequency, fr. When the input frequency, fi increases and reaches fi, the error voltage jumps from zero to a negative voltage. This value will be equal to the difference between the input frequency and actual VCO output frequency (fi – fo).This resulting error voltage is then processed by FIltering, amplifying, and applying the amplified voltage Vd to the control terminals of the VCO. The instantaneous frequency of VCO decreases because fo falls for nega tive values of Vd and increases for positive values of Vrf.
At some instant of time, the decreasing frequency of the VCO equals fin1 (lower edge of the capture range), then lock results-in, and the output signal
frequency of the VCO may be equal to the input signal frequency (that is, fo = fi). The VCO frequency locks with input signal frequency up to fi2 (the upper end of the lock range). If the input signal frequency exceeds fi2 then error voltage Vg will fall to zero and the VCO will operate at the free running frequency fr, as illustrated in figure. If the input signal frequency is now slowly swept back and it attains the value of fd1 then the loop (VCO frequency) locks with the input signal frequency, causing a positive jump of the error voltage Ver. So the VCO output frequency increases from fr continuously till fo becomes equal to fi. The VCO frequency fo locks with the input signal frequency � upto fd2 (the lower edge of the lock range) as shown in figure by dotted lines. Now if the frequency of the input signal falls below fd2, then the error voltage Ver will fall to zero and the VCO will operate at the free running frequency.
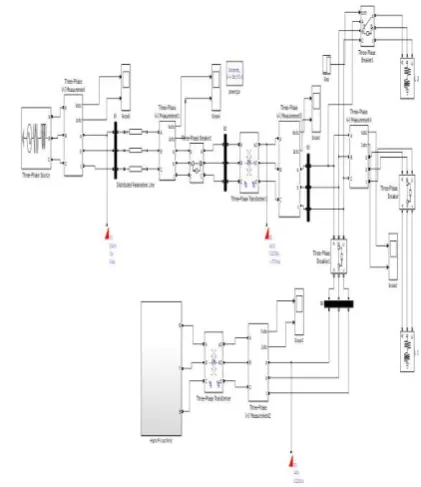
C. Simulink model:
Figure 6. Simulink Model
solar irradiance (Ir) and the load profile used for testing the proposed system are shown in Figures. For wind energy system, the wind turbine drives the prime mover of the generator with a constant speed to generate a power of 7.5 kW. The 10kWPV panel is used for simulating the hybrid system for remote areas. As per solar irradiance (Ir), the power generated by the PV panel (𝑃PV) varies from 5kW to 10 kW depending on the irradiance. Figure shows the power generation (𝑃PV) by the PV panel. The generated voltage of the PV panel will also vary in accordance with the solar irradiance as shown in Figure.
The MPPT controller is employed to get the maximum efficiency of the PV system. MPPT controller consists of a PWM generation for duty cycle corresponding to MPP of the PV system. Corresponding duty cycle is generated using widely employed P&O algorithm. Another DC/DC converter with a PSO based PI controller is connected to the hybrid DC bus which is utilized to control the charging/discharging of the battery bank. When the hybrid power generated is less than the load power, the parallel connected wind and PV system will fulfill the load demand along with the battery bank, and when the hybrid power generated is greater than load power required, the battery is charged. The controller employed for battery/charging and discharging is designed aiming at maintaining the constant voltage across the battery terminals.
The PLL performs the task of synchronization of grid voltage and frequency with the renewable energy system. The function of extracting the grid information and subsequently using the same for control loop by PLL.
Fundamental PLL consisting of a Phase Detector (PD), a Loop Filter (LF) and a frequency/phase generator (FPG), also called a Voltage-Controlled Oscillator (VCO). The control of the grid-connected RES is very
important when disturbances occur on the grid as it may lead to unstable operation.
According to recent grid regulations, the hybrid energy system must function as such to support the grid under unbalanced and fault conditions. These abnormal grid conditions introduce undesired oscillations caused by the presence of other frequencies in the voltage vector (negative sequence and/or harmonics) and result in accuracy problems for synchronization techniques. Therefore, the synchronization techniques should be advanced in order to provide accurate angle information under these abnormal conditions with fast dynamics. One of the widely used PLL among other variants of PLL is Proportion Integral based PLL because of advantage of removing large frequency overshoots.
Also, the application of the PI controller is generally avoided for cases where it is necessary to compensate the undesired effect of high-frequency grid voltage harmonics. However this effect of high frequency grid harmonics has been neglected in this work. The performance of PLL can be determined based on following performance indices. These indices are the frequency/phase overshoot, the computational complexity, the accuracy under unbalanced faults and phase jumps, the immunity against harmonics and inter-harmonics, the dynamic response, the estimation accuracy in the presence of dc offset and response under non-nominal grid frequencies. In this thesis, a PSO-PI controlled PLL is adopted for hybrid energy system synchronization with the grid. The performance of the present PLL is shown in below figures.
D. Simulation results:
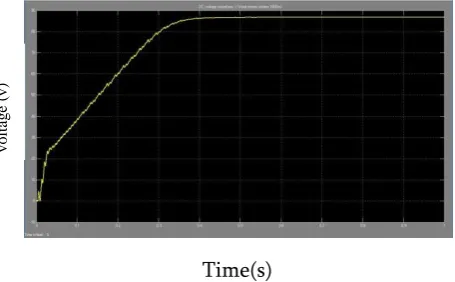
These are the results obtained from the MATLAB obtaining the comparison for the previous and the present systems. The voltage values for the individual systems when compared with the dc link voltage of the integrated system, this system gives reliable output as the individual voltage values makes a peak overshoot for getting stable whereas in this system this stabled very slowly but without any peak overshoots. The fluctuations in this system are less and stable the voltage in shorter time.
Figure 7. Response of the DC voltage in PV system
Figure 8. Response of the DC voltage in wind system
The response obtained above is for individual systems whereas for an integrated system the common DC link voltage is obtained as follows. We can observe the variations in the voltage before getting stable. No peak overshoot obtained in this system as there is no fluctuations in voltage and the value gets stable after a point of time to maintain the load balance.
Time(s)
Figure 9. DC link voltage for hybrid wind/pv system
The voltage and current at the generation side and load side are shown below. There is an optimum controlling obtained as the system stability increased
by providing the supply to the load constantly without any deviations. When compared to any
others systems in case of stabilizing the output within a shorter period of time this system is
efficiently stabling the system.
Time(s)
Figure 10. Voltage & current at generation side
Time(s)
Figure 11. Voltage and current at load side
The main advancement we came across is the controlling of the battery. Battery discharges are not
C
u
rr
en
t(
i)
vo
lt
ag
e(
v
)
C
u
rr
en
t(
i)
vo
lt
ag
e(
v
)
v
o
lt
ag
e
(v
evenly happens resulting in the damage of the load equipment. The same controlling which we did for the synchronizing of the both PV and wind also did here. PLL is the main device used for thise system for controlling with PSO based PID controller. The output for the battery control is carried out from the model through Simulink result.
Te result shows the stable operation without any fluctuations providing constant supply to the required load
Time(s)
Figure 13. Battery voltage using PSO PID controller
IV.
CONCLUSION
A new model using MATLAB is constructed and implemented successfully to estimate the optimal output integrating both wind and pv serving the load demands. This paper introduces PSO based algorithm to optimal output for grid planning. From the simulation results obtained, it is clear that by using PLL and PI controller the result obtained is controlled and by using PSO algorithm the output from the system generated is stable without any fluctuations resulting in optimum output.
V.
FUTURE SCOPE
In view of the distributed generation as flexible power systems, this work would enable more stable operation of micro grids to meet the load demand by integration of renewable energy sources such as wind turbines, photo voltaic and fuel cells.
VI.
REFERENCES
[1]. EBarklund, N.Pogaku, M.Prodanovic, C.Hernandez-Aramburo, and T.C.Green, "Energy Management System with Stability Constraints for Stand-alone Autonomous MicroGrid," in Proc. 2007 IEEE Electrical & Electronic Engineering Conf. pp. 1 - 6.
[2]. CAHernandez-Aramburo, T.C.Green, and N. Mugniot, "Fuel Consumption Minimization of a MicroGrid," IEEE Transactions on Industry Applications, vol. 41, pp. 673-681, May/June. 2005.
[3]. Enrico Carpaneto, Gianfranco Chicco , "Distribution system minimum loss reconfiguration in the Hyper-Cube Ant Colony Optimization framework ," in Proc. 2008 Electric Power Systems Research the 6th World Energy System Conf. pp. 2037 - 2045.
[4]. Mehdi Dali a, Jamel Belhadj a, and Xavier Roboam, "Hybrid solarewind system with battery storage operating in grid-connected and standalone mode: Control and energy management e Experimental investigation," in Proc. 2010 7th International Sustainable Energy Technologies Conf. pp. 2587-2595. [5]. Chen Lin, Zhong Jin, Ni Yinxin, and Gan
Deqiang, "A Study on Gridconnected Distributed Generation System Planning and Its Operation Performance," Automation of Electric Power Systems, vol, 31, pp.26-31, May. 2007.
[6]. Wang Xingwang, and Qiu Xiaoyan, "Distributed generation planning in
v
o
lt
ag
e(
v
distribution system based on modified particle swarm optimization algorithm," Power System Protection and Control, vol, 37, pp.16-20, July. 2009.
[7]. N Sadati, T. Amraee, and A.M. Ranjbar, "A global Particle Swarm- Based-Simulated Annealing Optimization technique for under-voltage load shedding problem," Applied Soft Computing, vol, 9, pp 652-657, March, 2009. [8]. R Teodorescu, M. Liserre and P. Rodriguez,
Grid Converters for Photovoltaic and Wind Power Systems. John Wiley & Sons, Ltd., 2011. [9]. IEEE Std 1547-2003, Standard for
Interconnecting Distributed Resources with Electric Power Systems, IEEE, 2003.
[10]. IEEE Std 1547.1-2005, IEEE standard conformance test procedures for equipment interconnecting distributed resources with electric power systems," IEEE, 2005.
[11]. TBoutabba, S.Drid and M. E. H. Benbouzid,"A hybrid power generations system (Wind Turbine/Photovoltaic) to driving a DFIG fed by a three inverter," Sciences and
[12]. Techniques of Automatic Control and Computer Engineering (STA), 2014 15th International Conference on, Hammamet, 2014, pp. 873-880.
[13]. Ahmed Said Al Busaidi, Hussein A Kazem, Abdullah H Al-Badi, Mohammad Farooq Khan, "A review of optimum sizing of hybrid PV Wind renewable energy systems in oman," Renewable and Sustainable Energy Reviews, Volume 53, January 2016, Pages 185-193. [14]. D Rekioua and E. Matagne, Optimization of
Photovoltaic Power Systems, Modelization, Simulation and Control. Springer, 2012.
[15]. IEEE Std 1547-2003, Standard for Interconnecting Distributed Resources with Electric Power Systems, IEEE, 2003.
[16]. R Teodorescu, M. Liserre and P. Rodriguez, Grid Converters for Photovoltaic and Wind Power Systems. John Wiley & Sons, Ltd., 2011.