GSJ© 2018
GSJ: Volume 6, Issue 7, July 2018, Online: ISSN 2320-9186
www.globalscientificjournal.comE
LECTRICAL
C
ONDUCTIVITY BASED
C
LASSIFICATION AND
M
APPING OF
S
ALT AFFECTED
S
OILS IN
K
AMPE
-O
MI
I
RRIGATION
S
CHEME
Titus Adeyemi Alonge, Olumuyiwa Idowu Ojo, Modupe Adebola AdejumobiDepartment of Agricultural Engineering,
Ladoke Akintola University of Technology, Ogbomoso, Nigeria Corresponding author: [email protected]
KeyWords: Salinity, Mapping, GIS, Kampe-Omi, Irrigation Scheme, Electrical Conductivity
ABSTRACT
Environmental change is a vital issue for human being which is indeed linked with agricultural activities due to
its impact on food production. Irrigated agriculture is important to the national economy of a country as it
con-tributes significantly to the production of food. Most irrigation schemes are faced with problem of soil
deterio-ration resulting from increased level of soil salinity and rise in water table. Therefore, mapping of saline soils
are essential and important for understanding resource for sustainable soil management and uses. The study
presents the mapping out of soil salinity level in Kampe-Omi irrigation scheme as at 2015. Kampe-Omi
irriga-tion scheme, being an irrigated agricultural land was used as pilot study area. Soil samples in OL 18 and OL 20
were collected on 3/11/2015 and analyzed for Electrical Conductivity (ECe). ECe samples were tagged S1 to S30
with their respective coordinates obtained using handheld Garmin GPS, the readings were imported into
ArcGIS 9.0 for analysis. Maps of the study area showing areas covered by salts in percentage were generated.
The results showed that 0.04 - 0.126 Ds/m occupies 3 %, 0.126 – 0.202 Ds/m occupies 14 %, 0.202 – 0.288
Ds/m occupies 46 %, 0.288 – 0.387 Ds/m occupies 30 %, and 0.387 – 0.500 Ds/m occupies 7 % of the study
ar-ea. The presence of salt in the soils and its variation expressed in percentage may be as a result of rise in water
table and the difference in elevation of the study area. The study confirms that electrical conductivity of
1.0 Introduction
Sometimes, agricultural activities result in adverse effects on their environment. One of the negative impacts
caused by agricultural activities is the unstable and reduction of soil quality (Abdelrahman, Natarajan and
Hegde, 2016). However, the success of soil management in achieving productivity and maintaining soil fertility
is based on the knowledge of how the soil responds to agricultural practices (Dikko, Abdullahi and Ousseini,
2010). The practice of irrigation sometimes have adverse effect on environmental condition otherwise
proper-ly monitored, planned and managed. Past record claims that human activities have a strong effect on the
nat-ural environment and becoming the main cause of environmental degradation (Rietz, Haynes, and Chidoma,
2001). Most irrigation schemes are faced with problem of soil deterioration resulting from increased level of
soil salinity and rise in water table. Soil salinity affects soil chemical, physical and biological characteristics of
the soil, fertility and sustainable productivity unless it is properly monitored. Soil salinity has been defined and
assessed in terms of laboratory measurements of the electrical conductivity of the extract of a saturated
soil-paste sample (ECe) (Rhoades, Chanduvi and Lesch, 1999). According to Maina, Amin, Aimrun, and Sani (2012)
saline soil contains soluble salts mostly in quantities sufficient to interfere with the physiological activities of
most crop plants. Soil salinity is one of the major severe environmental hazards caused by human activity or
induced processes. The effect of salinity is not only an environmental hazard, but it has also been known from
past record of crop cultivation that salt have effect on crop yield. In addition, salinity affects other major soil
degradation such as soil dispersion and soil erosion. The classification of salt affected soils, assessment of the
percentage of severity particularly in its early stage is important in terms of sustainable agricultural
manage-ment (Farifteh, 2007).
EC is often used to measure soil and water salinity. It is expressed in DeciSiemens per meter (dS/m). Soil
salini-ty is usually measured through electrical conductivisalini-ty (EC) in soil saturated paste (ECp), its liquid extract (ECe),
or using different soil to water suspensions (Sonmez, Buyuktas, Okturen, and Citak, 2008). ECe is more
compli-cated, it requires a saturated paste of the soil from which the water is extracted and the salts are measured.
Electrical conductivity (EC) and concentrations of Cl- and Na+ are important factors in soil salinity. Thus, ECe is
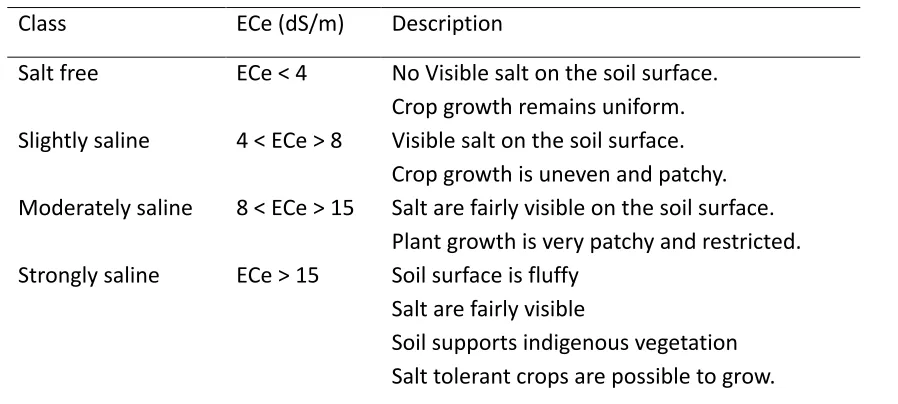
used to categorize soil salinity level as presented in Table 1. Rhoades et al., (1988) carried out research on the determination of soil salinity from soil electrical conductivity using different models and estimates. They
GSJ© 2018
and estimates of soil water content, bulk density and surface conductance determined by the field methods.
Table 1: Classification of soil salinity based on Electrical Conductivity (ECe)
Class ECe (dS/m) Description
Salt free ECe < 4 No Visible salt on the soil surface. Crop growth remains uniform. Slightly saline 4 < ECe > 8 Visible salt on the soil surface.
Crop growth is uneven and patchy. Moderately saline 8 < ECe > 15 Salt are fairly visible on the soil surface.
Plant growth is very patchy and restricted. Strongly saline ECe > 15 Soil surface is fluffy
Salt are fairly visible
Soil supports indigenous vegetation Salt tolerant crops are possible to grow.
Source: Ghassemi, Jakeman and Nix (1995)
Soil information is one of the areas that needed a robust data for study. The application of GIS in soil analysis
transformed the conventional approach, being simpler and accurate in terms of analysis and the production of
different maps in theme and layers for soil information. Soil information on soil salinity helps the farmers to
manage their farmlands effectively. Goslee, (2011) stated that Geographic Information System (GIS) is one of
the tool that is capable of analyzing, storing and displaying information. Therefore, applying GIS in the
deter-mination of soil information provide fundamental information to support in decision making on farmlands to
be able to reduce problems caused by improper management.
2.0 Materials and Methods
Kampe - Omi irrigation scheme is located in Yagba West Local Government Area of Kogi State, Nigeria.
Accord-ing to Adeniran et al. (2010) it is about one hundred and forty six kilometres (146 km) from Ilorin, the capital of Kwara State. It lies on longitudes 6o 371 to 6o 42' E and latitudes 8o 341 to 8o 38' N. The study area falls within
guinea savannah region of Nigeria. The slope of the land enhances water flow by gravity to various fields for
irrigation purposes. The soil of the study area consist of six types, namely Lithosols, Cambisols, Luvisols,
erod-ed soils, alluvial soils and Arenosols (Oriola, 2012). The soils in the area are prerod-edominantly coarse texturerod-ed,
ranging from loamy to sandy loam in the surface horizons and from sandy loam to clay in the subsurface
scheme was conceived in 1979 while construction works began in 1983 and was completed and commissioned
on the 12th of May, 1999. The scheme was designed to serve purposes such as irrigation of farmlands,
genera-tion of hydro-power and its supply, but it is being restricted to only the irrigagenera-tion of farmlands (Adeniran et al.,
2010).
The scheme has an area of 4,100 ha expanse of irrigable land. Construction of dam in the scheme has an
im-pounding capacity of 250 million m3 of water, with 39 kilometre main canal length and about 300 kilometres of
feeder and supplementary drainage system (Oriola, 2012). The method of irrigation in practice is mainly basin
irrigation on operating land (OL) 18 and operating land (OL) 20, and the major crops being cultivated on OL 18
includes: maize, vegetables sweet potato, while sorghum, okra and rice were planted on OL 20. The map of the
study area in relation to Nigerian and Kogi are shown in Figures 1 and 2. Soil sample on operating lands (OL 18
and OL 20) were collected from the study area in zigzag to determine the corresponding value of Electrical
Conductivity (ECe). Soil sample were taken at an average depth of 0 – 30 cm. The samples were collected at 30
locations with a soil auger. In all, 30 samples were collected in the study area. Samples were taken to
laborato-ry for chemical analysis. The determination of electrical conductivity (ECe) was made with a conductivity cell
by measuring the electrical resistance of a 1:5 soil: water suspension. Equation 1 was used to calculate the ECe
values (Rayment and Higginson, 2010).
𝐸𝐶
25(dS/m) =
S 𝑋 0.708K 1Where;
K = Measured resistance of KCl solution
S = Measured resistance of suspension
Soil sampling locations were tied to their corresponding coordinate values using Garmin handheld GPS. Values
were downloaded into ArcGIS 9.0 environment for analysis to generate soil sampling location map overlaid
with raster image of the scheme. The ECe values were also imported into ArcGIS 9.0 for analysis to generate
GSJ© 2018 Figure: 1: Map of the study area in relation to Nigeria
Figure: 2: Map of the study area in relation to Kogi State
3.0 Results and Discussion
0.5 dS/m as shown in Figure 2. The ECe values falls within the acceptable range of low saline soils (ECe < 4d
S/m) as classified by (Ghassemi et al., 1995). The study area showed very low presence of salt and plant grows uniformly. Sampling point S22 with X-coordinate 6.653311, Y-coordinate 8.599293 has the least EC value of 0.04
ds/m, while the sampling point locations S14 and S29 with coordinate 6.653395, Y-coordinate 8.603634 and
X-coordinate 8.66254, Y-X-coordinate 8.605717 respectively have the highest EC value of 0.5 ds/m. The maximum
values of ECe obtained at S14 and S29 may be as a result of high elevation in OL 18 and OL 20. Also, the increase
in ECe value of OL 20 is due to waterlogging in the area. Ojo, (2013) reported that Irrigated areas with high
ele-vation and waterlogging are prone to soil salinity.
These were developed based on the values of ECe determined from laboratory analysis. Figure 3 shows Soil
salinity distribution (ECe) with sampling location of the study area, while the spatial distribution of salt affected
area in the study location is presented in Figure 4. Low saline soils are shown in pinkish colour on the False
Colour Composite. They are also shown in few red or pink mottled textures. They also show as fine texture
with few mottled spots of other colour in the sample soils on the field. On the Standard False Colour
Compo-site 4-3-3, the highly salt-affected areas are mostly represented in very bright colour with some small amounts
of other colours; in this case there is absence of this. The texture of these areas is very fine. Although there are
traces of salt appearance on the study area, however, the distribution of the soil in the study area falls under
low-saline soil classification compared to FAO standards of saline soil classification irrespective of their colours
(Ochieng et. al., 2013).
0.00 0.10 0.20 0.30 0.40 0.50 0.60
S1 S2 S3 S4 S5 S6 S7 S8 S9
S 1 0 S 1 1 S 1 2 S 1 3 S 1 4 S 1 5 S 1 6 S 1 7 S 1 8 S 1 9 S 2 0 S 2 1 S 2 2 S 2 3 S 2 4 S 2 5 S 2 6 S 2 7 S 2 8 S 2 9 S 3 0 EC (d s/m)
Soil Sampling Points
GSJ© 2018
Figure 3: ECe versus sampling points
Figure 5: Soil salinity distribution (ECe) with sampling location of the study area
Figure 6: ECe value Versus Area covered
0.04 - 0.126 0.126 - 0.202 0.202 - 0.288 0.288 - 0.387 0.387 - 0.5
Area {sqm} 94,110.52 490,241.42 1,556,885.03 1,020,497.14 222,750.89
0.00 200,000.00 400,000.00 600,000.00 800,000.00 1,000,000.00 1,200,000.00 1,400,000.00 1,600,000.00 1,800,000.00
Area
Cov
ere
d (m2)
GSJ© 2018
Table
2:
Classifica-tions based
on field ECe
values
Total land of the study area is 338.44850 ha. The areas are represented in yellow, grey, blue, pink, and brown
colour in the map. The blue region has ECe value ranges from 0.04 – 0.126 dS/m, it covers 3% of the total area
as shown in Table 2. The area represented in grey region has EC value ranges between 0.126 – 0.202 dS/m it
covers 14% out of the total area. The ECe value of the yellow portion ranges from 0.202 – 0.288 (dS/m), it
co-vers 46% of the total area under study. The brown colored portion ranges from 0.288- 0.387 dS/m, it coco-vers
30% of the area as well. The pink colour area has ECe value ranges from 0.387 – 0.5 dS/m as shown in Table 2.
Figures 5 and 6 shows the chart of ECe plotted against the area cover, it was observed that the yellow portion
with EC values of 0.202 – 0.288 covers the largest portion while the area with 0.04 – 0.126 dS/m covers the
smallest part of the study area. The result obtained was compared to FAO standard for soil salinity; it was
shown that it was within the acceptable range of non-saline soils classification since the values were below 4
dS/m. (Ochieng et. al., 2013, Ojo and Ilunga, 2018).
Conclusion
The study concluded that the soil of the area is slightly salt affected as the little accumulated salt is not visible on soil sur-Salinity
Classes
Salinity Ranges (dS/m)
Area (m2) Percent-age
Map colour representation
Salinity Status (%) low to moderate
(< 4 dS/m)
1 0.04 – 0.126 94,110.53 3 Blue
2 0.126 – 0.202 490,241.42 14 Grey
3 0.202 – 0.288 1,556,885.03 46 Yellow 100
4 0.288 – 0.387 1,020,497.14 30 Brown
5 0.387 – 0.500 222,750.89 7 Red
face. It should be noted that during chemical application and irrigation in the study area, care has to be taken in
consid-ering the results obtained which showed the slightly concentration of soil salts in order to avoid accumulation that may
cause high soil salinity and degradation. The study has contributed to available ECe database of the study area. In
addi-tion, the scheme manager, planners, farmers and Government agency in order to develop a smart agricultural plan for
the area, can use the soil salinity map developed.
Acknowledgment
The authors wish to thank Lower Niger River Basin Authority management Ilorin and Ejiba office for granting acess to the study area
References
Abdelrahman, M. A. E., Natarajan, A., & Hegde, R. (2016). Assessment of land suitability and capability by integrating
remote sensing and GIS for agriculture in Chamarajanagar district , Karnataka , India. The Egyptian Journal of
Remote Sensing and Space Sciences, 4(3), 1–17. http://doi.org/10.1016/j.ejrs.2016.02.001
Adejumobi, M. A., Ojediran, J. O., & Olabiyi, O. O. (2014). Effects of Irrigation Practices on Some Soil Chemical Properties
on OMI Irrigation Scheme. Int. Journal of Engineering Research and Application, 4(10), 29–35. Retrieved from
www.ijera.com
Adeniran, K. A., Amodu, M. F., & Adeniji, F. A. (2010). Water requirements of some selected crops in Kampe dam
Irrigation Project. Australian Journal of Agricultural Engineering, 4(1), 119 – 125.
Dikko, A. U., Abdullahi, A. A., & Ousseini, M. S. (2010). Soil Fertility Assessment of The Lugu Main Canal Of Wurno
Irrigation Project , Sokoto State , Nigeria , Five Years After Rehabilitation . Nigerian Journal of Basic and Applied
Science, 18(2), 243–248.
Farifteh, J. (2007). Imaging Spectroscopy of salt-affected soils : Model-based integrated method. Journal of Management
and Enterpreneurial Development, 3(1), 1–235.
Ghassemi, F., Jakeman, A. J., & Nix, H. . (1995). Salinization of Land and Water Resources: Human causes management
and case studies. Center for Resources and Enviromental Studies, ANU, Canberra.
Goslee, S. C. (2011). Analyzing Remote Sensing Data in R : The landsat Package. Journal of Statistical Software, 43(4), 1 –
25. Retrieved from http://www.jstatsoft.org
Maina, M. M., Amin, M. S. M., Aimrun, W., & Sani, I. (2012). Soil salinity assessment of Kadawa Irrigation of the Kano
River Irrigation Project ( KRIP ). Journal of Food , Agrculture and Enviroment, 10(2), 56–68.
Ochieng, G. M., Ojo, O. I., Otieno, F. A. O., & Mwaka, B. (2013). Use of remote sensing and geographical information
system (GIS) for salinity assessment of Vaal-Harts irrigation scheme, South Africa. Enviromental System Research,
2(4), 1–12.
Ojo, O. I. (2013). Mapping and Modeling of Irrigation Induced Salinity of Vaal-Harts Irrigation Scheme in South Africa.
Unpublished D.Tech thesis. Dept of Civil Engineering Tshwane University of Technology, South Africa.
Ojo, O. I and M. F. Ilunga (2018) Geospatial Analysis for Irrigated Land Assessment, Modeling and Mapping. http://dx.doi.org/10.5772/intechopen.73314
Oriola, E. O. (2012). Partnership In Irrigation System For Increased Efficiency And Agricultural Productivity In Nigeria.
Journal of Enviromental Research and Development., 6(4), 3 – 11.
Rayment, G. E., & Higginson, F. R. (2010). Soil survey standard test method for electrical conductivity. Australian
Laboratory Handbook of Soil and Water Chemical Methods, Melbourne, Inkata Press. (Australian Soil and Land Survey Handbooks), 3, 1–10.
Rhoades, J. . D., Shouse, P. . J., Alves, W. . J., Nahid, A., Manteghi, A., & Lesch, S. M. (1988). Determining Soil Salinity from
Soil Electrical Conductivity using Deferent Models and Estimates. Soil Science Society of America Journal., 54(1),
46–54.
GSJ© 2018
conductivity measurements. FAO Irrigation and Drainage Paper, 57, 1–148.
Rietz, D. N., Haynes, R. J., & Chidoma, S. (2001). Effects of Soil Salinity Induced Under Irrigated Sugarcane in the
Zimbabwean Lowveld on Soil Microbial Activity. Proc. South Africa Sug. Technology Ass., 75, 68–74.
Sonmez, S., Buyuktas, D., Okturen, F., & Citak, S. (2008). Assessment of different soil to water ratios (1:1, 1:2.5, 1:5) in soil