REVIEW ON SUPER RESOLUTION OF
IMAGES USING WAVELET
TRANSFORM
SWATI D. BIRARE
M.Tech student in Department of Electronics & Telecommunication, Dr. Babasaheb Ambedkar Technological University,
Lonere, Dist: Raigad, Maharashtra, India. [email protected]
DR. SANJAY L. NALBALWAR
Assistant Professor in Department of Electronics & Telecommunication, Dr. Babasaheb Ambedkar Technological University,
Lonere, Dist: Raigad, Maharashtra, India.
[email protected] Abstract:
Super resolution is a process where a high resolution image can be reconstructed from a set of blurred and noisy low resolution images which are at a specific pixel shift from each other. Each sub-pixel shifted low resolution image contains some new information about the scene and super resolution is to combine these to give a higher resolution image. Frame alignment is very much important concept in super resolution process which is achieved by image registration. Using image registration, the super resolution algorithm presented here places two adjacent frames together into a high resolution grid. In this paper the LR images are assumed to be half-pixel shifted. This paper aims at implementing the super-resolution algorithm using wavelet transform to interpolate the missing pixels in the grid to create one high-resolution image. Different wavelets are experimented to determine which one works best. The result is evaluated in terms of MSE, PSNR and SNR. By achieving super resolution in the wavelet domain, a more computationally efficient overall system can be developed.
Keywords: Image Registration, Super Resolution, Sub-pixel shift, Quincunx grid, Interpolation, Wavelet Transform.
1. INTRODUCTION
Images having higher resolution (HR) is the foremost requirement in most of the imaging applications. HR means high pixel density and thus it tends to provide more accurate information. Though the high resolved images are desired, but the resolution of image is dependent on the sensor or the image acquisition device and a high resolution sensor is often very expensive. Also, the available camera resolution may not always suffice for a given application. The images may be degraded or misregistered or sub pixel shifted due to sub sampling. Therefore we need to increase the current resolution level by one way or other. It can be achieved basically by either reducing the pixel size or by increasing the chip size. However it has some limitations which may generate shot noise and severely degrade the image quality. Therefore, a new approach is required to increase the resolution of the image [1].
2. METHODS FOR SUPER RESOLUTION
The existing super resolution methods can be divided into the following categories: 2.1 Frequency domain reconstruction
Frequency domain reconstruction method was first proposed by Tsai and Huang in 1984 [5]. Here the data is first transformed to the frequency domain and then it is combined there. It is then transformed back into the spatial domain where a new image with HR is reconstructed. A high resolution image can also be reconstructed using a POCS algorithm which was originally developed by Tekalp, Ozkan, and Sezan [6]. In this method the estimated reconstruction is successively obtained on different convex sets.
2.2 Iterative method
The iterative algorithms were proposed by Michal Irani and Schmuel Peleg [7]. This method iteratively uses the current best guess for the SR image to create LR images and then compares the simulated LR images to the original LR images. These difference images (found by subtracting real LR-simulated LR) are then used to improve the initial guess by "back projecting" each value in the difference image onto the SR image.
2.3 Bayesian method
The Bayesian method was developed by Cheeseman [8] at NASA for SR reconstruction of planetary images. The name comes from Bayes theory, this method relies largely on the statistical knowledge that pixel to pixel differences are very small, and can be modeled with a probability distribution function. The Bayesian method seeks to find the solution possessing the maximum probability.
3. WAVELET TRANSFORM
As proposed in the algorithm, the interpolation is done wavelet domain. The continuous wavelet transform is defined as follows
(
,
)
1
(
)
*
(
)
.
)
,
(
dt
s
t
t
x
s
s
s
CWT
x x
(1)Basis function- ,
(
)
1
(
)
s
t
s
t
s
Mother wavelet-
(
t
)
As seen in the above equation, the transformed signal is a function of two variables, tau and s, the translation and scale parameters, respectively. Psi(t) is the transforming function, and it is called the mother wavelet. The wavelet analysis is done in such a way that the signal is multiplied with a function, {\it the wavelet} and the transform is computed separately for different segments of the time-domain signal. The term translation is related to the location of the window, as the window is shifted through the signal. This term corresponds to time information in the transform domain. However, we do not have a frequency parameter instead, we have scale parameter which is defined as $1/frequency$. The parameter scale in the wavelet analysis is similar to the scale used in maps. In terms of frequency, low frequencies (high scales) correspond to a global information of a signal (that usually spans the entire signal), whereas high frequencies (low scales) correspond to a detailed information of a hidden pattern in the signal (that usually lasts a relatively short time) [9].
4. PROPOSED ALGORITHM
The super-resolution algorithm discussed in this paper uses a wavelet-based interpolation scheme to create one high-resolution image from two adjacent low-high-resolution frames. The low high-resolution frames are created from the original image by a half-pixel shift in x and y direction. Two low resolved frames so obtained are mapped on the high resolution grid [10].
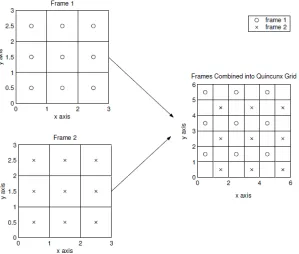
The wavelet super-resolution algorithm deals specifically with two frames separated by a half-pixel shift. It is assumed that a registration algorithm exists which can take a video sequence and determine the pixel shift between adjacent frames at the sub-pixel level. The test data is created by splitting say a 256x256 pixel image (original image) into two 128x128 pixel images, with half-pixel shift. The attempt is to recreate the original image from these two LR images using the proposed algorithm. Fig. 1 shows how the original image is decomposed into two LR images having half pixel shift relative to each other.
Fig. 1: Original 6x6 image is split into 3x3 pixel images having half pixel shift.
The steps involved in this algorithm are as below:
Step 1: Combine the 2 low resolution images having half-pixel shift to form a quincunx grid as shown in Fig. 2. The high resolution quincunx grid is designated as
H
(
xH
,
yH
)
and the low resolution frames asF
1
(
x
1
,
y
1
)
and
F
2
(
x
2
,
y
2
)
.Tr
(.) is a transform for combining on a quincunx grid.)]
2
,
2
(
2
),
1
,
1
(
1
[
)
,
(
xH
yH
Tr
F
x
y
F
x
y
H
1
2
1
xH
x
y
1
2
yH
1
xH
x
2
2
yH
y
2
2
Step 2: This quincunx grid is then rotated by 45 degree angle to optimize pixel correlation, so as to apply wavelet transform. Applying wavelet transform directly to the quincunx sampled image is same as applying it to each frame individually as 2D wavelet transform works strictly along the columns and rows of an image. However, this rotation changes the index values of each pixel, which is then converted into the rotated grid indices. Let
Rot
denote the 45-degree rotation transform, andH
rot denote the rotated grid, then)]
,
[(
)
,
(
xrot
yrot
Rot
xH
yH
Hrot
(3)Step 3: The rotated image must be up-sampled by a factor of 2 to create the space required for each missing coefficient in wavelet domain.
Fig. 2: Combining test frames into high resolution grid.
Step 4: The stationary wavelet transform is applied to the low resolution rotated and upsampled image so as to decompose it into LL, HL, LH and HH components, to a desired level of decomposition using a wavelet. Using these wavelet coefficients the missing pixel locations are determined.
Step 5: The missing pixel coefficient is calculated using the four coefficients closest to the missing pixel location. Based on the clustering property, the coefficients nearest the missing coefficient will best approximate its value. Suppose Ci, i=1, 2, 3, 4 represents the known four coefficient surrounding the missing pixel M. If the missing coefficient exists in an area with no line or edge, it may be interpolated as an average of the four surrounding coefficients:
4
4
3
2
1
C
C
C
C
M
G
1
{
C
1
,
C
2
,
C
3
}
G
2
{
C
2
,
C
3
,
C
4
}
G
3
{
C
3
,
C
4
,
C
1
}
G
4
{
C
4
,
C
1
,
C
2
}
K
arg_
min[
std
(
Gi
)]
(5)
M
mean
[
Gk
]
(6) Similarly we find the missing coefficients for LL, HL, LH and HH components, for every level.
Step 6: Once the above process is completed for each missing pixel value, the inverse wavelet transform is applied to the rotated image. The above image is then rotated back to its original orientation. Thus the missing pixels have been interpolated i.e. the holes of the quincunx grid are filled and the complete high-resolution image is produced. Step 7: To ensure that the new pixel values are as accurate as possible the wavelet transform is applied to the high resolution image thus obtained. To subdue all edges in the HH subband the analysis low-pass filter is applied to the rows and columns of the HH subband. Since only diagonal edges are to be emphasized in this subband, the second step applies the Highpass synthesis filter to the rows and columns of the new subdued HH subband. This enhances the diagonal edges, and keeps the horizontal and vertical edges subdued. The IRDWT is then applied to the adjusted wavelet transform to create a new corrected high-resolution image. The filtering process is used to eliminate the erroneous edges, and to enhance the diagonal ones. This is post wavelet domain processing.
Step 8: Calculate the MSE, PSNR and SNR to compare the results with the original image.
5. EXPERIMENTAL RESULTS
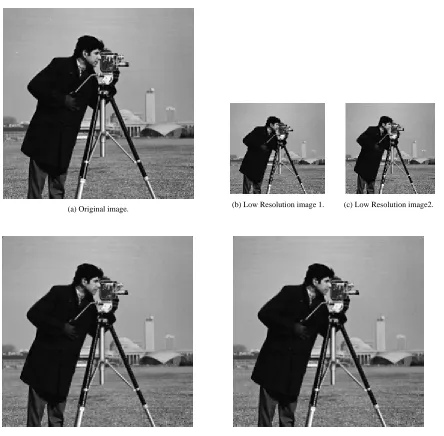
The above algorithm was implemented using MATLAB software on two still images i.e. ‘cameraman.tif’ of size 512x512 and lena.png of size 256x256. The statistical performance of the proposed algorithm is evaluated in terms of MSE, PSNR and SNR using different wavelets. The algorithm’s performance is also checked for before and after wavelet post processing. To check the efficiency of algorithm first of all a test image is taken which is assumed to be High resolved image. As first step the two low resolved images are prepared from this test image, which are half pixel phase shift from each other.
5.1 ‘cameraman.tif’ gray scale image of size 512x512
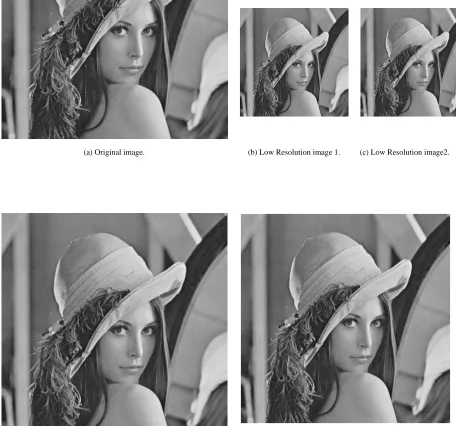
5.2 lena.png gray scale image of size 256x256
The classic Lenna portrait is an image near the object of interest with many fine details. Fig. 4 shows the original image, low resolution frames for this image and the super resolved image with and without post wavelet domain processing. There is a great loss of detail in each LR frame, most noticeable in the feather of the hat, the eyes, and the lips. The detail that is reconstructed, especially in the hat feather is remarkable. Differences in the original and super resolved images are noticeable along the rim of the hat and in the details of the feather. The post wavelet processing accounts for interpolation error. The statistical performance measurement for this image is as in Table 2.
(a) Original image. (b) Low Resolution image 1. (c) Low Resolution image2.
(d) Super Resolved image before Post wavelet Domain Processing. (e) Super Resolved Image after Post wavelet Domain Processing.
(a) Original image. (b) Low Resolution image 1. (c) Low Resolution image2.
(d) Super Resolved image before Post wavelet Domain Processing. (e) Super Resolved Image after Post wavelet Domain Processing.
Table 1. Comparison of different wavelets performance in terms of MSE, SNR and PSNR before and after post wavelet processing for image ‘cameraman.tif’.
Wavelets Before Post Wavelet Processing After Post Wavelet Processing
MSE SNR PSNR MSE SNR PSNR
db-4 58.0408 309.8156 30.9325 55.9735 320.3255 30.7631
db-7 60.5214 297.1171 30.7501 53.1837 338.1097 30.9830
db-9 60.8398 295.5618 30.5959 54.0626 332.6135 30.8405
db-7,9 60.8774 295.3794 30.2185 52.8441 340.2829 33.9888
db-9,7 60.8774 295.3794 30.2185 54.1383 332.1480 31.0102
Haar 60.8774 295.3794 30.2185 58.2521 308.6917 30.6884
Table 2. Comparison of different wavelets performance in terms of MSE, SNR and PSNR before and after post wavelet processing for image ‘lena.png’.
Wavelet Before Post Wavelet Processing After Post Wavelet Processing
MSE SNR PSNR MSE SNR PSNR
db-4 11.1089 1.5839+003 36.9946 11.0541 1.6051+003 37.0546
db-7 11.8141 1.4961e+003 36.9589 9.4245 1.8775e+003 37.9337
db-9 11.9138 1.4836e+003 36.9324 9.6932 1.8235e+003 37.8663
db-7,9 12.4991 1.4141e+003 36.7013 9.2073 1.9054+003 38.8746
db-9,7 12.4991 1.4141e+003 36.7013 10.5790 1.8061+003 38.5976
Haar 12.4991 1.4141e+003 36.7013 11.3445 1.5581e+003 37.1285
6. CONCLUSION AND FUTURE SCOPE
A wavelet-based super-resolution algorithm has been developed that can accurately produce one high-resolution image from two sub-pixel shifted low-resolution frames. Different wavelet systems were applied to this algorithm to determine which wavelet system most accurately reconstructed the high-resolution image. The db7,9 gives the best results as compared to the other filters. We could see the superior performance of this algorithm both visually as well as in terms of MSE, SNR and PSNR. The advantage of this algorithm is that each pixel in low resolved image has a particular location in the high resolve image. Hence the LR imaging system is utilized and HR images are obtained without altering the information achieved from LR imaging system. However this algorithm has limited implementation only for multiple frames. We cannot use it for a single frame. Further it is applicable only for symmetric images. Here we have worked on two frames. This algorithm can be extended for more number of frames with any arbitrary sub-pixel shift.
References
[1] Park, S. C.; Park, M. K..; Kang, M. G. (2003): Super-resolution image reconstruction: A technical review, IEEE Signal Processing Mag., vol. 20, pp. 21–36.
[2] Komatsu, T., and et al (1993): Signal-processing based method for acquiring very high resolution image with multiple cameras and its theoretical analysis, Proc. Inst. Elec. Eng., vol. 140, no. 1, pt. I, pp. 19-25.
[3] Gunturk, B.K.; Altunbasak, Y.; Mersereau, R.M.( 2002): Multiframe resolution-enhancement methods for compressed video, IEEE Signal Processing Lett., vol. 9, pp. 170-174.
[5] Gunturk K., Altunbasak Y. (2002): Multiframe Resolution-Enhancement Methods for Compressed Video B., IEEE Signal Processing Lett., vol. 9, no. 6.
[6] Tekalp, A.M.; Ozkan, M.K.; Sezan, M.I. (1992): High- resolution image reconstruction from lower-resolution image sequences and space varying image restoration, Proc. IEEE Int. Conf. Acoustics, Speech and Signal Processing (ICASSP), San Francisco, CA., vol. 3,pp. 169-172.
[7] Irani, M.; Peleg , S. (1993): Motion analysis for image enhancement resolution, occlusion, and transparency, J. Visual Commun. Image Represent. vol.4, pp. 324-335.
[8] Cheeseman, P. and et al (1994): Superresolved Surface reconstruction from multiple images, NASA Ames Research Center, Moffett Field, CA, Tech. Rep. FIA-94-12.
[9] Walliim, P. (1991): Wavelet theory: An analysis technique that’s mating ripples, Scientific American.