SCOUR AROUND SINGLE PILE AND
PILE GROUPS SUBJECTED TO WAVES
AND CURRENTS
YASSER E. MOSTAFA*
Associate Prof., Dept. of Irrigation & Hydraulics, Faculty of Engineering, Ain Shams University, Cairo, Egypt
AHMED F. AGAMY
Assistant Prof., Dept. of Irrigation & Hydraulics, Faculty of Engineering, Ain Shams University, Cairo, Egypt
ABSTRACT
This paper presents the results of an experimental study of scour around single pile and different configurations of pile groups exposed to waves and currents. Four different sets of experiments were used in this study: single pile, group of two piles with side-by-side arrangement, group of two piles with tandem arrangement and group of three piles. For the four sets of tests, the main variables were water depth, wave characteristics, flow velocity, Keulegan-Carpenter number and gap between piles. It was found that the larger the KC, the larger the scour hole dimensions. Existence of waves reduces the scour compared to the case of currents only. Equations for calculating scour at different configurations of pile groups are introduced. The scour depth for case of pile groups is generally greater than that for case of single pile depending on the group configuration and gap between piles.
Keywords: Scour, Waves, Current, Pile, Pile group.
1. INTRODUCTION
Pile groups are usually used in marine structures such as jetties, seawalls and offshore structures. Scour may significantly affect the stability of piles supporting marine structures. A limited number of publications can be found in the literature for scour around marine structures compared to scour around bridge piers constructed in rivers or canals for example.
Scour around a vertical pile in steady currents has been investigated quite extensively especially for scour around bridge piers. A large number of studies and equations for scour prediction at bridge piers has been reported in many publications such as Raudkivi and Ettema (1977), Melville and Sutherland (1988), Melville and Chiew (1999) and Melville et al. (2000).
Chow and Herbich’s study in 1978 is the first in the literature introducing wave scour at pile groups. To the authors’ knowledge, Sumer and Fredsøe (1998) is the first comprehensive study in regular wave scour around pile groups. The study by Sumer and Fredsøe (1998) investigated wave scour around groups of two piles, three piles and square group of 4x4 piles. However, their experiments focused on a small gap between piles (G /D smaller than 2 with a majority of the experiments with G/D smaller than 1). A gap to diameter ratio of G/D of 1 means that center to center spacing between piles is 2. The small gap to pile diameter ratio is important in case of piles used as a breakwater. In many applications for marine structures such as jetties, seawalls and offshore structures, G/D ratio is 2 or higher. This is to enable easy pile driving and to reduce the effect of soil-pile-soil interaction.
Sumer and Fredsøe (2001) conducted experimental work to investigate the scour around single pile in combined waves and currents. They used irregular waves and currents in the same direction of wave propagation and perpendicular to the wave propagation.
Myrhaug and Rue (2005) suggested that the scour depth formulas for regular waves can be applied for random waves if the random waves are represented by the mean of the 1/3 and the 1/10 highest wave variables as obtained from a Rayleigh distribution.
Prepernau et al. (2008) conducted large scale tests on scour around a slender vertical monopile due to irregular waves. They found that small scour depths occurred which however increase with increasing wave height and period. The test results presented certain variations compared to small scale test results probably due to scale effects.
In this study, the experimental program considered gap to diameter (G/D) ratio of 1, 2, 3 and 4, KC between 6 and 10, Froude number (Fr) between 0.14 and 0.24 and the following configuration: single pile, group of 2 piles aligned with flow direction (tandem arrangement) and group of 2 piles aligned normal to flow direction (side by side arrangement) and group of 3 piles with triangular arrangement.
2. EXPERIMENTAL SETUP AND TEST CONDITIONS
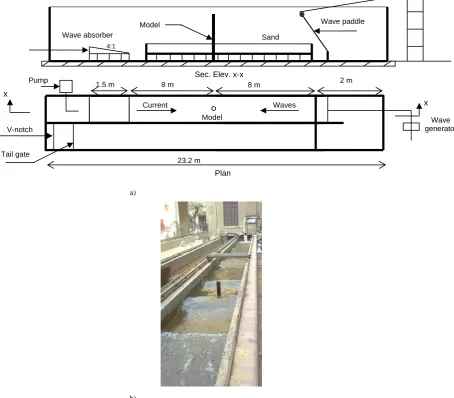
The experiments were carried in a flume at the Faculty of Engineering, Ain Shams University. The flume is 23.2 m long, 0.8 m wide and 0.9 m deep. It is divided into two parts by a 15 cm thick partition wall. The water leaving the flume falls into an underground tank from which water is circulated again, reaching the upstream end through an open channel forming currents.
The flume is also equipped with a wave generating machine which consists of motor, pulleys and rotating arms connected to wave paddles to produce regular waves. Figure 1a shows a sketch of the wave flume and Figure 1b shows a photo of the flume.
For single pile, experiments were conducted for currents alone, waves alone and waves against currents for calibration and comparison with literature. For pile group, the experiments considered only the case of waves against currents which represents piles existing at estuaries where rivers meet sea.
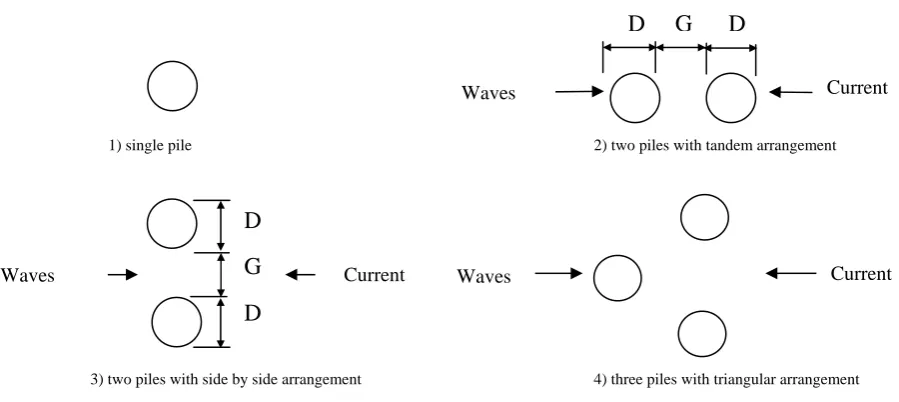
Four sets of experiments were conducted as follows and as shown in Figure 2: 1. single pile,
2. two piles with flow direction (tandem arrangement),
3. two piles perpendicular to the flow direction (side by side arrangement), 4. group of three piles with triangular arrangement.
The water depth was measured using vertical scales fixed on the side walls of the flume where zero reading of the scale corresponds to the zero bed level. Also, water level was measured using a point gauge provided with vertical scale and vernier and mounted on a lifting carriage. The scale reads to nearest 1 mm. Water depth and wave height measurements were made near the piles.
Prior to conducting each test, the initial bed surface was leveled, measured at the centerline of the flume and every 3 cm by 3 cm grid using a point gauge. The final readings were measured after drainage of water and drying of soil. The depth of scour at any point is the depth between the initial and final readings at that point.
For the experiments, water depth ranged between 15 and 20 cm while wave height at pile location ranged between 10 and 12 cm. For experimental sets 2 to 4, the normalized gap ratio between piles (G/D) was changed to be 1, 2, 3 and 4, which represents a normalized center to center spacing between piles (S/D) of 2, 3, 4 and 5, respectively. The soil comprised sand with a size of d50 = 0.5 mm. All tests were conducted under clear-water scour conditions.
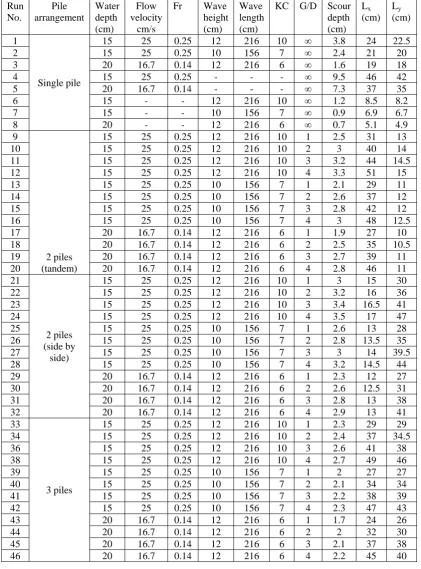
Scour was measured every 15 minutes. It was noticed that scour hole dimensions almost do not change after running the test for 3 hours, which was considered to be the equilibrium stage. Therefore, all measurements were taken after 3 hours. Table 1 presents the test conditions and results.
a)
b)
Figure 1. The flume used in this study showing the case of waves advancing against current. a) Section elevation and plan, b) Illustrative photo of the flume
Plan Sec. Elev. x-x
Current Waves
1.5 m 8 m 8 m 2 m
23.2 m V-notch
Wave generator
x
x
Wave absorber
Model Wave paddle
Sand
4:1
Model Pump
Figure 2. Pile configurations tested in this study
The Keulegan-Carpenter number is defined as:
D
T
U
KC
=
m(1)
where Um is the undisturbed linear near-bed orbital velocity amplitude and T is the wave period. Also, KC can be alternatively expressed as
=
kh
H
D
KC
sinh
2
2
π
(2)
where:
D = pile diameter H = wave height
k = wave number determined from the expressions
ω
2=
gk
tanh(
kh
)
where ω is the angular wave frequency (ω= 2π/T)Waves Current
D
G
D
Waves Current
D
G
D
Current Waves
1) single pile 2) two piles with tandem arrangement
Table 1. Summary of test conditions and scour results Run No. Pile arrangement Water depth (cm) Flow velocity cm/s
Fr Wave height (cm)
Wave length (cm)
KC G/D Scour depth (cm) Lx (cm) Ly (cm) 1 Single pile
15 25 0.25 12 216 10 ∞ 3.8 24 22.5
2 15 25 0.25 10 156 7 ∞ 2.4 21 20
3 20 16.7 0.14 12 216 6 ∞ 1.6 19 18
4 15 25 0.25 - - - ∞ 9.5 46 42
5 20 16.7 0.14 - - - ∞ 7.3 37 35
6 15 - - 12 216 10 ∞ 1.2 8.5 8.2
7 15 - - 10 156 7 ∞ 0.9 6.9 6.7
8 20 - - 12 216 6 ∞ 0.7 5.1 4.9
9
2 piles (tandem)
15 25 0.25 12 216 10 1 2.5 31 13
10 15 25 0.25 12 216 10 2 3 40 14
11 15 25 0.25 12 216 10 3 3.2 44 14.5
12 15 25 0.25 12 216 10 4 3.3 51 15
13 15 25 0.25 10 156 7 1 2.1 29 11
14 15 25 0.25 10 156 7 2 2.6 37 12
15 15 25 0.25 10 156 7 3 2.8 42 12
16 15 25 0.25 10 156 7 4 3 48 12.5
17 20 16.7 0.14 12 216 6 1 1.9 27 10
18 20 16.7 0.14 12 216 6 2 2.5 35 10.5
19 20 16.7 0.14 12 216 6 3 2.7 39 11
20 20 16.7 0.14 12 216 6 4 2.8 46 11
21
2 piles (side by
side)
15 25 0.25 12 216 10 1 3 15 30
22 15 25 0.25 12 216 10 2 3.2 16 36
23 15 25 0.25 12 216 10 3 3.4 16.5 41
24 15 25 0.25 12 216 10 4 3.5 17 47
25 15 25 0.25 10 156 7 1 2.6 13 28
26 15 25 0.25 10 156 7 2 2.8 13.5 35
27 15 25 0.25 10 156 7 3 3 14 39.5
28 15 25 0.25 10 156 7 4 3.2 14.5 44
29 20 16.7 0.14 12 216 6 1 2.3 12 27
30 20 16.7 0.14 12 216 6 2 2.6 12.5 31
31 20 16.7 0.14 12 216 6 3 2.8 13 38
32 20 16.7 0.14 12 216 6 4 2.9 13 41
33
3 piles
15 25 0.25 12 216 10 1 2.3 29 29
34 15 25 0.25 12 216 10 2 2.4 37 34.5
36 15 25 0.25 12 216 10 3 2.6 41 38
38 15 25 0.25 12 216 10 4 2.7 49 46
39 15 25 0.25 10 156 7 1 2 27 27
40 15 25 0.25 10 156 7 2 2.1 34 34
41 15 25 0.25 10 156 7 3 2.2 38 39
42 15 25 0.25 10 156 7 4 2.3 47 43
43 20 16.7 0.14 12 216 6 1 1.7 24 26
44 20 16.7 0.14 12 216 6 2 2 32 30
45 20 16.7 0.14 12 216 6 3 2.1 37 38
3. DISCUSSION OF RESULTS
3.1. Case of Single Pile (Current Only)
An equation for predicting scour depth around bridge piers in steady current was derived by Colorado State University (CSU) and has recently been revised by Richardson and Davis (2001) and issued as Hydraulic Engineering Circular No. 18 (HEC-18).
The equation predicts the maximum scour depth as:
43 . 0 35 . 0
2
.
2
Fr
D
y
D
S
=
(3)Mississippi (Wilson, 1995)
4 . 0 6 . 0
9
.
0
D
y
d
s=
(4)Sumer et al. (1992) stated that the mean value and standard deviation for the normalized equilibrium scour depth (S/D) for a vertical cylindrical pile in steady current are 1.3 and 0.7, respectively.
For a Froude Number (Fr) of 0.25 and 0.14, HEC-18 equation calculated S/D to be 1.33 and 1.19, respectively. For the same Fr, Mississippi equation (eq. 4) predicts the S/D ratio to be 1 and 1.18, respectively.
The experiments conducted in this study for single pile exposed to current only, revealed that for Fr of 0.25 and 0.14, the measured S/D was 1.25 and 0.96, respectively. The measured values of S/D agree reasonably well with HEC-18 and Mississippi equations.
3.2.Case of Single Pile (Waves Only)
It is well known that the horseshoe vortex and the contraction of streamlines are the key elements for scour in case of steady currents. As explained by Sumer and Fredsøe (2001) and Sumer et al. (1992), the key role of vortex shedding in wave scour is that each shed vortex sweeps the sediment grains into its core and carries them away from the pile, thus causing a net scour at the pile in each half cycle of the wave. Sumer et al. (1992) indicated that scour due to waves only ceases to exist when the vortex shedding disappears as this occurs when KC number at which the scour ceases to exist coincides with the critical value of KC number at which the vortex shedding disappears. This critical value is KC = 6 for a single cylindrical pile and KC = 3 to 4 for a 45o arrangement square pile.
Sumer et al. (1992) provided the following empirical expression for scour depth at a circular pile exposed to regular waves:
[
1
exp(
0
.
03
(
6
))
]
3
.
1
−
−
−
=
KC
D
S
KC≥ 6 (5)
Equation (5) implies that if KC ≤ 6, scour does not occur.
For calibration and comparison with literature, experimental tests for case of waves only were conducted to measure scour around single pile due to waves only. The results show good agreement with equation 5. For KC = 6, the measured scour depth was 0.7 cm (i.e., S/D = 0.09). For KC =10, the measured S/D ratio was about 0.16 compared to 0.147 calculated from equation 5.
3.3.Case of Single Pile (Waves and Current)
but rather decrease the scour depth compared with the situation where only currents are present. Also, they concluded that the effect of breaking waves is comparable to the effect of non-breaking waves.
Hogedal, M. and Hald, T. (2005) conducted a desk study for scour assessment and design for scour at monopiles for an offshore wind turbine. They stated that designing for the extreme local scour depth, which will for most locations be subjected to a current only situation, is too conservative as imposed wave actions will tend to reduce the scour depth. They recommended adaptive design scour depth to be used for fatigue calculations and extreme load calculations to be S/D of 0.63 and 0.61, respectively instead of the used practice design normalized scour depth S/D of 1.3.
Sumer and Fredsøe (2001) conducted an experimental study for scour around single pile subjected to waves and currents. In their experiments, they used irregular waves for co-directional waves in the same direction of current and case of waves propagating perpendicular to the current. They did not investigate the case of waves against current.
They introduced the parameter Ucw defined as:
m c
c cw
U
U
U
U
+
=
(6)where Uc is the current velocity at distance of D/2 from bed and Um is the maximum value of orbital velocity of water particles at bed.
In this study, the water depth ranged between 15 and 20 cm which represents a relatively shallow water depth for better representation of case of estuaries. For this shallow water depth, it can be reasonably assumed that the current velocity is constant along the pile and that Ucw is 0.5.
The results from this study agree reasonably well with Fig. 7 of Sumer and Fredsøe (2001). It should be noted that Sumer and Fredsøe (2001) did not consider the case of waves against current and they used irregular waves while this study considers regular waves against current.
Figure 3 shows the results extracted from Fig. 7 of Sumer and Fredsøe (2001) and plotted points representing measured scour from this study. It should be noted that the plotted points represent the maximum measured equilibrium scour depth at single pile for the case of waves against current (waves advancing in opposite direction to current). The curves presented by Sumer and Fredsøe (2001) represent the cases of waves advancing co-directional to currents (waves in the same direction of currents) and waves perpendicular to current. Figure 3 shows that the measured S/D from this study is slightly lower than that of Sumer and Fredsøe (2001). This can be attributed to the different direction of current relative to wave propagation and the wave type (regular or irregular).
Fig. 7 of (Sumer and Fredsøe, 2001) indicates that waves alone with KC of 6 cause a scour of S/D = 0.08 and waves with KC of 10 cause a scour of about S/D=0.14. The measured values in this study of scour depth for case of waves only shows good agreement with the results of Sumer and Fredsøe, 2001.
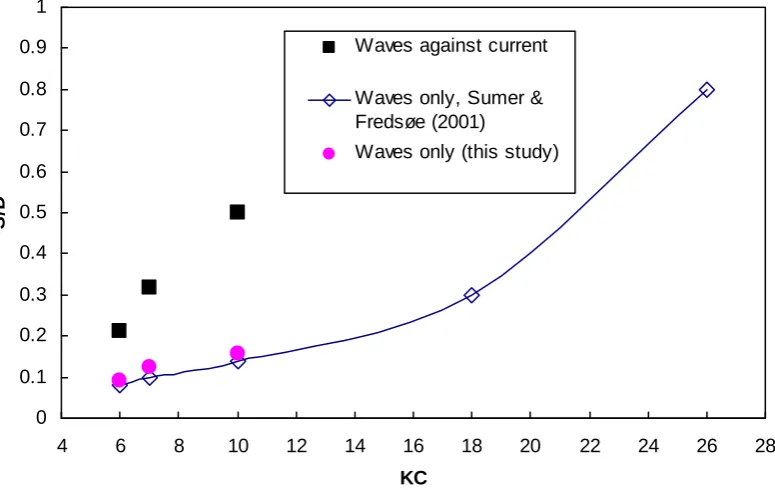
Measured scour depth from this study, plotted in Figure 3, indicates that even with the presence of waves with a small value of KC (KC=6) propagating against current, S/D decreases significantly from 1.3 to 0.21 (i.e., S/D decreases to about 16% of the equilibrium scour in case of current only) . However, with relatively larger value of KC (KC=10), S/D = 0.5 (i.e., S/D decreases to about 38% of the equilibrium scour in case of current only). Figure 4 shows the relationship between KC and the normalized scour depth S/D. For the case of waves only, the results of this study agree very well with results from Sumer and Fredsøe (2001). It should be noted that for case of waves against current, Fr ranged between 0.14 and 0.25. The scour depth for case of waves against current is higher than that for case of waves only. This is due to the dominant effect of current.
Figure 3. Comparison between measured equilibrium scour at single pile and the results of Sumer and Fredsøe (2001). The plotted symbols represent condition of wave against current (this study).
0 0.1 0.2 0.3 0.4 0.5 0.6 0.7 0.8 0.9 1
4 6 8 10 12 14 16 18 20 22 24 26 28
KC
S/D
Waves against current
Waves only, Sumer & Fredsøe (2001)
Waves only (this study)
Figure 4. Relationship between KC and normalized scour depth S/D. Filled symbols represent results of this study, open symbols represent waves only (Sumer and Fredsøe, 2001).
3.4.Case of Two Piles with Tandem Arrangement
In this case, a group of two piles were placed inline with flow (i.e., the line connecting between the two piles is parallel to the direction of wave/current).
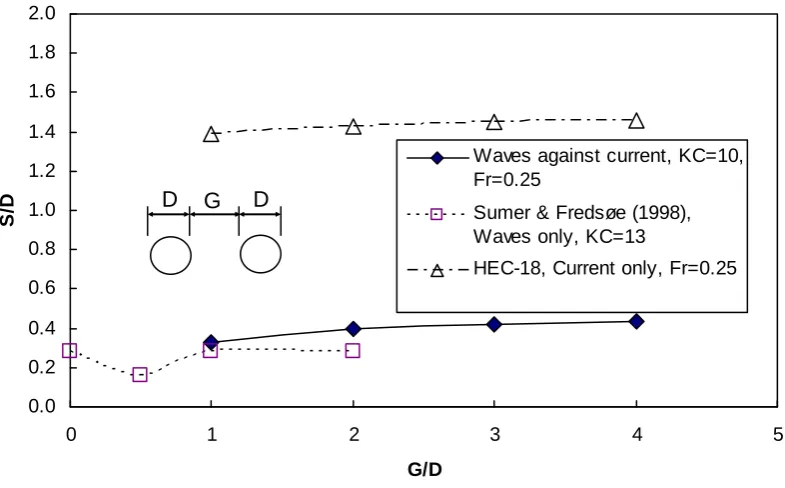
Figure 5 shows the equilibrium normalized scour depth (S/D) plotted against the normalized gap between the two piles (G/D). The filled symbols show S/D values for the case of waves against current (KC=10 and average current velocity of 0.25 m/s, Fr=0.25). Results from Sumer and Fredsøe (1998) are plotted for comparison. It should be noted that Sumer and Fredsøe’s results represent the case of waves only (KC=13). Also, the HEC-18
0.01 0.1 1 10
0 0.2 0.4 0.6 0.8 1
Ucw
S/
D
Sumer & Fredsøe (2001), KC=6 Measured scour, KC =6
Sumer & Fredsøe (2001), KC=10
Measured scour, KC=10
local pier scour equation for pile group recommended by Richardson and Davis (2001) is selected to calculate the scour in case of currents only.
HEC-18 equation for scour at pile group is stated as:
43 . 0 65 . 0 4 3 1
2
=
gy
V
y
K
K
a
K
K
K
K
y
S
proj sp mhpg pg
(7)
where:
Spg = scour component for the piles exposed to the flow y = approach flow depth
Khpg = pile group height factor
K1 = correction factor for pier nose shape K3= correction factor for bed condition
K4 = correction factor for armoring by bed material size aproj = sum of non-overlapping projected widths of piles Ksp = coefficient for pile spacing
Km = coefficient for number of aligned rows
It can be seen from Figure 5 that the scour measured in this study (S/D for case of wave against current) is higher than that for the case of waves alone. The scour increases asymptotically with the increase in the gap between piles. Increasing the gap between piles more than G/D of 4 will not cause increase in the scour depth. Also, the scour in case of waves against current is lower than that predicted if current only is present. By performing regression analysis for the range of testing conditions, it can be concluded that the scour around pile group for case of waves against current (Swcg) can be related to the scour around pile group for case of current only (Scg) by the following equation:
D
G
S
S
cg cwg023
.
0
2
.
0
+
=
(8)It should be noted that equation (8) is valid for case of waves against current where KC ranges between 6 and 10 and Froude Number (Fr) ranges between 0.14 and 0.25 and G/D ranges between 1 and 4. The r2 value of the regression analysis is about 0.77.
Sumer and Fredsøe (1998) showed that scour for case of waves only remains almost constant if G/D is higher than 1. The scour predicted by HEC-18 for the case of currents only indicates that S/D slightly increases with increase in G/D. The Km factor of Eq. (7) (Fig. 6.11 of Richardson and Davis, 2001) indicates that Km increases with the increase in the number of rows in flow direction and also increases with the increase in spacing between piles.
Although previous studies for case of waves only indicated that G/D between 2 and 4 does not affect the scour depth, this study indicates that the scour depth due to waves against current condition slightly increases with increasing G/D even when G/D is between 2 and 4. This may be attributed to the existence of currents.
Figure 6a shows a comparison between the plan view extent of scour hole in the flow direction (Lx), normalized by D, in the case of waves against currents (this study) and the case of waves only (Sumer and Fredsøe, 1998). As expected, Lx/D substantially increases with the increase in G/D because the two piles have tandem arrangement (in line with the flow).
Figure 5. Normalized equilibrium scour depth (S/D) versus normalized gap between piles (G/D) for case of two piles with tandem arrangement
3.5.Case of Two Piles with Side-by-Side Arrangement
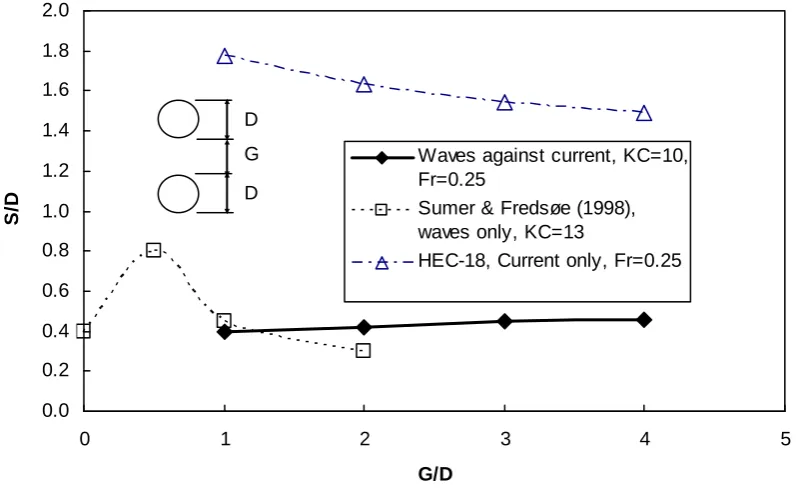
In this case, a group of two piles was placed perpendicular to the direction of wave/current. Figure 7 shows the normalized equilibrium scour depth (S/D) plotted against the normalized gap between the two piles (G/D). Similar to the case of tandem piles, the scour in case of waves against current (KC=10, Fr=0.25) is significantly lower than that predicted if current only is present (Fr=0.25). By performing regression analysis for the range of testing conditions, scour due to waves against current (Swcg) can be related to scour around pile group for case of current only (Scg) by the following equation:
D
G
S
S
cg cwg
0307
.
0
175
.
0
+
=
(9)Figure 8 shows the difference between the experimental results and equation 9 introduced from the regression analysis. The r2 value of the regression analysis is about 0.86.
Results from Sumer and Fredsøe (1998) for scour due to waves only showed that, if G/D is very small, the scour depth becomes maximum as the two piles act as a single larger pile. They concluded that for G/D >2, the interference effect between the piles practically disappears; thus the piles act as single individual piles.
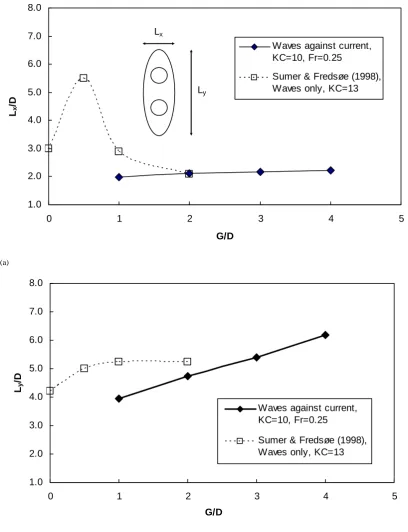
The plan view extent of scour hole in the flow direction (Lx/D) and perpendicular to the flow direction (Ly/D) is illustrated in Figures 9a and 9b, respectively. Figure 9 reveals that Lx/D is almost not affected by the increase of G/D. At G/D=2, Lx/D is almost the same whether current is present or not. Ly/D linearly increases with the increase in G/D for the case of waves against current.
0.0 0.2 0.4 0.6 0.8 1.0 1.2 1.4 1.6 1.8 2.0
0 1 2 3 4 5
G/D
S/
D
Waves against current, KC=10, Fr=0.25
Sumer & Fredsøe (1998), Waves only, KC=13
HEC-18, Current only, Fr=0.25 D
(a)
(b)
Figure 6. Plan view extent of scour hole plotted against G/D for case of two piles with tandem arrangement. (a) Normalized scour hole length in the direction of flow, (b) Normalized scour hole length in the direction normal to the flow.
1.0 2.0 3.0 4.0 5.0 6.0 7.0 8.0
0 1 2 3 4 5
G/D
Lx
/D
Waves against current, KC=10, Fr=0.25
Sumer & Fredsøe (1998), Waves only, KC=13
Lx
Ly
1.0 2.0 3.0 4.0 5.0 6.0 7.0 8.0
0 1 2 3 4 5
G/D
Ly
/D
Waves against current, KC=10, Fr=0.25
Sumer & Fredsøe (1998), Waves only, KC=13
Lx
Figure 7. Normalized equilibrium scour depth (S/D) versus normalized gap between piles (G/D) for case of two piles with side-by-side arrangement
y = 0.0307x + 0.1749 R2 = 0.8614
0.100 0.120 0.140 0.160 0.180 0.200 0.220 0.240 0.260 0.280 0.300
0 1 2 3 4 5
G/D
Scw
g
/S
cg
Figure 8. Normalized equilibrium scour depth (Swcg/Scg) versus normalized gap between piles (G/D) for case of two piles with side-by-side arrangement. The figure shows the difference between the measured results and the equation from regression analysis.
0.0 0.2 0.4 0.6 0.8 1.0 1.2 1.4 1.6 1.8 2.0
0 1 2 3 4 5
G/D
S/
D
Waves against current, KC=10, Fr=0.25
Sumer & Fredsøe (1998), waves only, KC=13
HEC-18, Current only, Fr=0.25 G
D
(a)
1.0 2.0 3.0 4.0 5.0 6.0 7.0 8.0
0 1 2 3 4 5
G/D
Ly
/D
Waves against current, KC=10, Fr=0.25
Sumer & Fredsøe (1998), Waves only, KC=13
(b)
Figure 9. Plan view extent of scour hole plotted against G/D for case of two piles with side-by-side arrangement. a) Normalized scour hole length in the direction of flow, b) Normalized scour hole length in the direction normal to the flow.
1.0 2.0 3.0 4.0 5.0 6.0 7.0 8.0
0 1 2 3 4 5
G/D
Lx
/D
Waves against current, KC=10, Fr=0.25
Sumer & Fredsøe (1998), Waves only, KC=13 Lx
3.6.Case of Three Piles with Triangular Arrangement
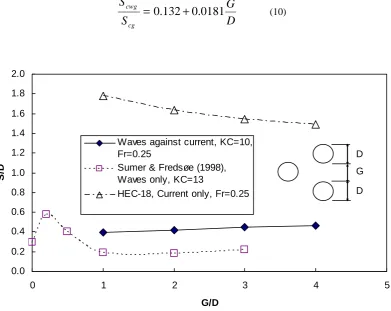
Figure 10 shows the normalized equilibrium scour depth (S/D) for case of waves against current (KC=10, Fr=0.25). For all experimental tests conducted for three piles with triangular arrangement subjected to waves against current, the maximum value of scour was found to be somewhere between the three piles (i.e., not in contact with any one of the piles). Figure 11 shows a photo of the scour hole around the three piles.
By performing regression analysis for the range of testing conditions, scour due to waves against current (Swcg) can be related to scour around pile group for case of current only (Scg) by the following equation:
D
G
S
S
cg cwg
0181
.
0
132
.
0
+
=
(10)Figure 10. Normalized equilibrium scour depth (S/D) versus normalized gap between piles (G/D) for case of three piles with triangular arrangement
Figure 11. Scour hole around three piles with triangular arrangement 0.0
0.2 0.4 0.6 0.8 1.0 1.2 1.4 1.6 1.8 2.0
0 1 2 3 4 5
G/D
S/
D
Waves against current, KC=10, Fr=0.25
Sumer & Fredsøe (1998), Waves only, KC=13
HEC-18, Current only, Fr=0.25
G D
3.7.Effect of Pile Arrangement
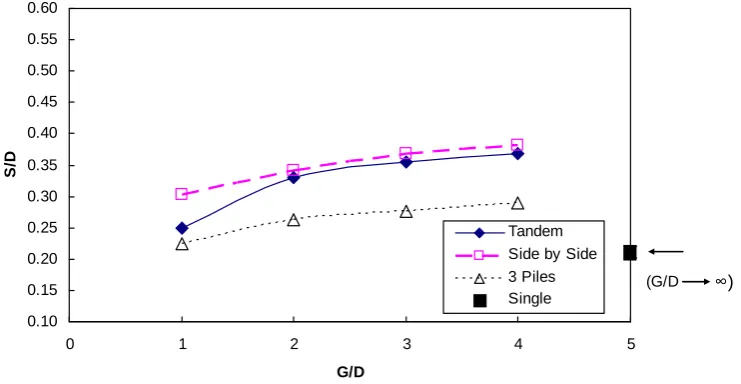
Figures 12 to 14 show the relationship between the normalized equilibrium scour depth (S/D) and the normalized gap between piles (G/D) for different cases of pile arrangements subjected to waves propagating against current flow. The testing comprised waves with Keulegan-Carpenter number (KC) ranging between 6 and 10 and current with Froude number (Fr) ranging between 0.14 and 0.25. It can be seen that S/D generally increases with the increase of G/D because of the dominant effect of current as discussed in the previous sections. For case of KC=10, Fr=0.25, the single pile case had the maximum S/D value of 0.5. By reducing the value of KC and/or Fr, the value of S/D around a single pile decreased significantly.
For the testing conditions, it was found that the case of side-by-side pile arrangement induced more scour compared to the case of tandem pile arrangement and the case of three piles with triangular arrangement. The difference between measured scour depth in the case of side-by-side and tandem conditions became maximum at G/D =1 (difference of about 18% to 20%). This can be attributed to the increase in the area blocking the flow which leads to increase of the horseshoe vortex. For G/D between 2 and 4, the difference between measured scour depths in both conditions was between 3% and 8%.
The decrease in scour depth in the three-pile case can be attributed to flow divergence where some of the incident flow goes around the whole body of the three piles rather than through it. Therefore, the current velocity within the whole body of the three piles is reduced leading to reduction in scour depth.
It was also noticed that scour depth for some cases of pile groups increases as much as about two times more than its magnitude for the case of single pile. Ashtiani and Beheshti (2006) reached similar conclusions for scour due to current only.
The normalized scour hole extent in the flow direction (Lx/D) is plotted against the normalized gap between piles (G/D) in Figures 15 and 16. These figures show results for the limits of testing conditions (KC=10, Fr=0.25 and KC=6, Fr=0.14). As expected, the case of tandem pile arrangement induced the largest Lx/D and the case of side-by-side pile arrangement induced the least Lx/D. The case of three piles with triangular arrangement induced high scour hole extent but slightly lower than the case of tandem piles. This is because of flow divergence in the gaps between the three piles. The case of single pile induced larger value of Lx/D than the case of side-by-side arrangement. This is also attributed to the flow divergence in the case of side-by-side arrangement.
The normalized scour hole extent normal to the flow direction (Ly/D) is plotted against the normalized gap between piles (G/D) in Figures 17 and 18. As expected, the case of side-by-side pile arrangement induced the largest Ly/D and the case of tandem pile arrangement induced the least Ly/D.
Figure 12. Normalized equilibrium scour depth (S/D) versus normalized gap between piles (G/D) (KC=10, Fr=0.25) 0.10
0.15 0.20 0.25 0.30 0.35 0.40 0.45 0.50 0.55 0.60
0 1 2 3 4 5
G/D
S/D
Tandem
Side by Side
3 Piles
Single
Figure 13. Normalized equilibrium scour depth (S/D) versus normalized gap between piles (G/D) (KC=7, Fr=0.25)
Figure 14. Normalized equilibrium scour depth (S/D) versus normalized gap between piles (G/D) (KC=6, Fr=0.14)
1.0 2.0 3.0 4.0 5.0 6.0 7.0 8.0
0 1 2 3 4 5
G/D
Lx
/D
Tandem
Side by Side
3 Piles
Single
(G/D ∞)
0.10 0.15 0.20 0.25 0.30 0.35 0.40 0.45 0.50 0.55 0.60
0 1 2 3 4 5
G/D
S/D
Tandem
Side by Side 3 Piles
Single
(G/D ∞)
0.10 0.15 0.20 0.25 0.30 0.35 0.40 0.45 0.50 0.55 0.60
0 1 2 3 4 5
G/D
S/D
Tandem Side by Side 3 Piles Single
Figure 16. Normalized scour length in flow direction (Lx/D) versus normalized gap between piles (G/D) (KC=6, Fr=0.14)
Figure 17. Normalized scour length normal to flow direction (Ly/D) versus normalized gap between piles (G/D) (KC=10, Fr=0.25)
Figure 18. Normalized scour length normal to flow direction (Ly/D) versus normalized gap between piles (G/D) (KC=6, Fr=0.14) 1.0
2.0 3.0 4.0 5.0 6.0 7.0 8.0
0 1 2 3 4 5
G/D
Ly
/D
Tandem
Side by Side
3 Piles
Single
(G/D ∞)
1.0 2.0 3.0 4.0 5.0 6.0 7.0 8.0
0 1 2 3 4 5
G/D
Ly
/D
Tandem
Side by Side
3 Piles
Single
(G/D ∞)
1.0 2.0 3.0 4.0 5.0 6.0 7.0 8.0
0 1 2 3 4 5
G/D Lx
/D
Tandem
Side by Side
3 Piles
Single
4. CONCLUSIONS
This paper presents an experimental study of scour at single pile and pile groups due to waves and currents. Different pile group configurations have been investigated. For case of single pile, the study considered scour due to waves only, currents only and waves against current. For pile group, the study focused on the case of waves against current flow which occurs in estuaries. The main conclusions drawn from this study can be summarized as follows:
For case of single pile:
1. Scour depth due to steady flow current is significantly larger than scour due to waves only. Scour depth in case of waves against current is larger than that for case of waves only.
2. The scour depth is governed by Keulegan Carpenter number and Froude number. The larger the KC number and Froude number, the larger the scour depth.
3. The case of waves against current leads to slightly reduced values of scour depth around single pile compared to the situation of waves with current or waves perpendicular to currents.
4. Even with a small value of KC (KC=6), S/D decreases to about 16% of the equilibrium scour in case of current only. However, with larger value of KC (KC=10), S/D decreases to about 38% of the equilibrium scour in case of current only.
For case of pile group:
5. The scour hole dimensions increase with increasing KC and Fr.
6. The scour depth around pile groups subjected to waves against current is substantially lower than that subjected to currents only.
7. Scour depth at group of two piles with tandem arrangement and side-by-side arrangement due to waves against current can be calculated using equations (8) and (9), respectively for the range of testing conditions. The equations are related to the HEC-18 equation for current only.
8. Scour depth due to waves against current slightly increases with increasing G/D ratio even when G/D is between 2 and 4. This is different than the case of waves only.
9. For case of three piles with triangular arrangement, the maximum scour depth due to waves against current can be calculated using equation (10) for the range of testing conditions.
10. The case of side-by-side pile arrangement induced more scour compared to the case of tandem pile arrangement and the case of three piles with triangular arrangement.
11. Scour depth for some cases of pile groups increases as much as about two times more than its magnitude for the case of single pile.
5. REFERENCES
[1] Ashtiani, A.B., Beheshti, A.A. (2006). Experimental investigation of clear-water local scour at pile groups. Journal of Hydraulic Engineering, ASCE, 132 (10), 1100-1104.
[2] Chow, W.Y., Herbich, J.B. (1978). Scour around a group of piles. Proc. Offshore Technology Conference. Paper No. 3308, Dallas, Texas.
[3] Frigaard, P., De Vos, L., Christensen, E., Hansen, E. (2006). Offshore wind turbines situated in areas with strong currents. Report 4, Influence of breaking waves on scour processes around circular offshore wind turbine foundations.
[4] Hogedal, M., Hald, T. (2005). Scour assessment and design for scour monopole foundations for offshore wind turbines. Copenhagen Offshore Wind 2005, October 2005, Denmark.
[5] Melville, B.W., Chiew, Y.M. (1999). Time scale for local scour at bridge piers. Journal of Hydraulic Engineering, ASCE, 125(1), 59-65.
[6] Melville, B.W., Coleman, S.E. (2000). Bridge Scour. Water Resources Publications, Colorado, USA.
[7] Melville, B.W., Sutherland, A.J. (1988). Design method for local scour at bridge piers. Journal of Hydraulic Engineering, ASCE, 114(10), 1210-1226.
[8] Myrhaug, D., Rue, H. (2005). Scour around group of slender vertical piles in random waves. Applied Ocean Research, Elsevier, 27, 56-63.
[9] Prepernau, U. Grune, J., Sparboom, U., Schmidtkoppenhagen, R., Wang, Z., Oumeraci, H. (2008). Large-scale model study on scour around slender monopiles induced by irregular waves. Coastal Engineering 2008, Proceedings of the 31st International Conference, Hamburg, Germany, 2707-2716.
[10] Raudkivi, A.J., Ettema, R. (1977). Effect of sediment gradation on clear water scour. Journal of Hydraulic Engineering, ASCE, 103(10), 1209-1213.
[11] Richardson, E.V., Davis, S.R. (2001). HEC-18. Evaluating scour at bridges. Hydraulic Engineering Circular No. 18, Fourth Edition, National Highway Institute, Federal Highway Administration, U.S. Dept. of Transportation.
[12] Sumer, B.M., Bundgaard, K., Fredsøe, J. (2005). Global and local scour at pile groups. Proceedings of the Fifteenth International Offshore and Polar Engineering Conference, Seoul, Korea, pp. 577-583.
[14] Sumer, B.M., Fredsøe, J. (1998). Wave scour around group of vertical piles. Journal of Waterway, Port, Coastal and Ocean Engineering, ASCE, 124 (5), 248-255.
[15] Sumer, B.M., Fredsøe, J. (2001). Scour around pile in combined waves and currents. Journal of Hydraulic Engineering, ASCE, 127 (5), 403-411.
[16] Sumer, B.M., Whitehouse, R., Torum, A. (2001). Scour around coastal structures: a summary of recent research. Coastal Engineering, Elsevier, 44, 153-190.
[17] Wilson, K.V. (1995). Scour at selected bridge sites in Mississippi: Reston, VA, U.S. Geological Survey Water-Resources Investigations Report, 94–4241, 44 p.
6. APPENDIX 1: NOTATION
D = pile diameter
d50 = sediment size of which 50% of material is finer ds = scour depth
G = gap between piles H = wave height Fr= Froude number
KC= Keulegan-Carpenter number
Lx = scour hole extent in x direction (offshore-onshore direction) Ly= scour hole extent in y direction (cross-shore direction) S = equilibrium maximum scour depth
Scwg= equilibrium maximum scour depth at pile group for case of wave against current Scg= equilibrium maximum scour depth at pile group for case of current only
T = wave period