Optimisation of engine operating parameters
for turpentine mixed diesel fueled DI diesel
engine Using Taguchi Method
*R.Karthikeyan, Dr.N.Nallusamy, Dr.N.Alagumoorthi, Dr.V.Ilangovan,
*Professor, Dept.of Mechanical Engineering, Adhiparasakthi Engineering College, Melmaruvathur. Tamil Nadu, India.
Professor, Dept.of Mechanical Engineering, Sri Venkateswara College of Engineering, Sriperumepudur, Tamil Nadu, India.
Professor, Dept.of Mechanical Engineering, Pondicherry Engineering College, Puducherry India. Professor, Dept.of Mechanical Engineering, Karpagavinayagar College of Engineering and Technology,
Maduranthagam, Tamil Nadu, India.
Abstract: In the present investigation a volatile fraction of pinus resin called Turpentine has been tried as an alternative fuel for diesel fuel. As turpentine possess moderate cetane number, the complete replacement of diesel fuel by turpentine oil is not possible. However, blending of turpentine with diesel fuel in large proportion helps to reduce the application of diesel fuel. Hence, the objective of present investigation focused on the maximum possible diesel replacement by turpentine oil. Also, the investigation fixed the optimum level of engine operating parameters suitable for the selected blend operation. As the investigation requires simultaneous optimisation of three parameters, a method called Taguchi was tried in the experiment. The primary advantage of this method is to minimize the number of trails required for the optimisation. As per the taguchi method, nine trials were experimented and the results were used for optimising parameters. In addition, an ANOVA was also performed for the operating parameters to show the percentage contribution of variance over the desired output. The results of the taguchi experiment identified that the 40T blend (40% turpentine and 60% diesel) performed better at 29°BTDC injection timing and at 180 bar injection pressure than other blends and had a capacity to cold start the engine. Using the identified optimum levels, a full range experiment was conducted for 40T blend to compare its performance and emission behaviour with standard diesel operation. The results of the full range experiment showed that the 40T blend offered approximately 2.5% higher brake thermal efficiency than diesel baseline operation without much worsening the exhaust emission.
1 Introduction
Ever increasing fuel price, continuous addition of on road vehicles, fast depleting petroleum resources and continuous accumulation green house gases are the main reasons for the development of alternative fuels. Many alternative fuels have been indentified and tested successfully in the existing engine with and without engine modification. However, still researches are continuing in this field to seek best alternatives which are offering best fuel characteristics.
Most of the alternative fuels suggested today are bio fuels and are proved to be a partial substitute for existing one (Devan.P.K, and Mahalakshmi.N.V (2010)). However, the various admission techniques experimented earlier are giving good solution to apply larger fraction of replacing fuel in the existing engine. The primary advantage of this kind of fuel is renewable and eco-friendly. These fuels are identified well before the exploration of the other promising alternatives fuels (Robert et al (1995)).
triglyceride oil. Also, this kind of oils are available in abundant in some plant species namely eucalyptus, pine tree etc.
The present investigation used one such oil called Turpentine; a volatile fraction of oleoresin obtained from various specious of pine tree. The properties of turpentine fall in between the properties of petrol and diesel fuel. Also, few of them are also closer to that of diesel oil (Karthikeyan R. and Mahalakshmi N.V. (2007)) (Table 1).
Usually, alternative fuels are tested in the existing engines that use petrol or diesel as fuel. These engines are specially designed for petro fuels and also optimised for it. When alternative fuels are applied in it they may not deliver optimum performance. Hence, the engine parameters such as injection timing, injection pressure and compression ratio are needed to be modified for the alternative fuel that is being tested in the engine. As the test involves three parameters and is needed to optimise simultaneously and hence, the method called Taguchi was tried in this experiment to optimise the engine operating parameters in lesser number of trials. After identification of optimum levels of parameters the engine was kept at the optimum levels and a full range experiment was conducted using the selected blend. The results of the full range of experiment were then compared with standard diesel operation. An ANOVA was also performed for the involved parameters to check the percentage contribution of variance over the desired response.
1.1 Turpentine
Turpentine is a kind of volatile essential oil obtained from oleoresin exuded from the pine tree, when subjected to mechanical injury. Pine trees are the world’s known tallest, biggest, oldest and most populated trees (even 5000 year old trees are known to exist). Genus Pinus is one of the most widely distributed genera of trees in the northern and southern hemisphere, extending from the polar region to the tropics.
Pine trees (coniferous trees) naturally has a kind of resin, which is rich in chemical compounds such as terpenes, fatty acids, waxes, tannins and phenolics. This has been collected from the tree by bark chipping and borehole methods. The main function of the resin is to protect the tree against insect, pests and diseases, and act as energy reserves. The crude oleoresin is converted into its primary fractions called gum rosin and turpentine by steam distillation process. Pine trees can be easily cultivated in wastelands and they need very little or no water and human effort.
2 Experimental setup
The engine setup shown in Figure 1 used for experimental investigation is a single cylinder, air cooled, and vertical and direct injection diesel engine. It is capable of developing 4.4 kW at a constant speed of 1500 rpm and coupled to an eddy current dynamometer. The inlet side of the engine consists of anti-pulsating drum, air heater and air temperature measuring device. The exhaust side of the engine consists of EGT indicator, exhaust gas analyzer and smoke sampler. The setup also consists of a separate fuel measuring device for measuring consumption of diesel-turpentine blends. A 64 bit DAQ system is also provided with the test rig to acquire crank angle and cylinder pressure data.
3 Methodology
Bi-fueling or blending is the simplest technique for admitting low cetane fuels in high compression engines. According to this method the fuel selected for investigation is mixed with standard diesel oil in various proportions on volume basis and its properties such as calorific value and viscosity were evaluated before admission. Among the prepared blends, the low turpentine blends such as 10T and 20T were not considered for experimentation as these blends are not providing higher diesel replacement. Other blends such as 30T, 40T and 50T were considered for experimentation. A method called ‘Taguchi’ was used in the experiment for simultaneous optimisation of engine parameters such as injection timing, injection pressure and blend composition.
3.1 Taguchi Method of Optimisation
Taguchi method is a simplest method of optimising experimental parameters in less number of trials. The number of parameters involved in the experiment determines the number of trials required for the experiment. More number of parameters led to more number of trials and consumes more time to complete the experiment. Hence, a method called ‘Taguchi’ was tried in the experiment to optimise the levels of the parameter involved in the experiment.
parameters that need to be made (Yang and Tarng., 1998). The present study uses three factors at three levels and hence, an L9 orthogonal array with four columns and nine rows were used (Palani and Murugan., 2006) for the construction of experimental layout (Table 2). The L9 has four columns and nine rows and the parameters such as injection timing, injection pressure and blend proportions are arranged in column 1, 2 and 4, and column 3 is used for the error of the experiment (Table 3).
According to this layout, nine experiments were designed and trials were selected at random, to avoid systematic error creeping into the experimental procedure (Palani et al., 2004). For each trial the brake thermal efficiency was calculated and used as a response parameter. Taguchi method uses a parameter called signal to noise ratio (S/N) for measuring the quality characteristics. There are three kinds of signal to noise ratios are in practice. Of which, the higher-the-better S/N ratio was used in this experiment because this optimisation is based on higher BTE. The taguchi method used in the investigation was designed by statistical software called ‘Minitab Release 15’ to simplify the taguchi procedure and results.
A full range experiment for the selected blend was also conducted for after modifying the engine operating parameters. This is mainly to compare the performance and emission characteristics of turpentine-diesel blend with standard diesel operation.
4 Results and Discussion
4.1 Taguchi Method of Optimisation
The present study uses three factors at three levels and each one has two degrees of freedom. Also, the interactions between the parameters are neglected as the parameters are independent. Hence, an L9 orthogonal array with four columns and nine rows were used to design taguchi experiment. The factors considered for experiment and its levels are shown in Table 2. The experimental layout of L9 orthogonal array used for the experiment is given in Table 3 and 4. The list of S/N ratio for the response parameter (BTE) is given in Table 5.
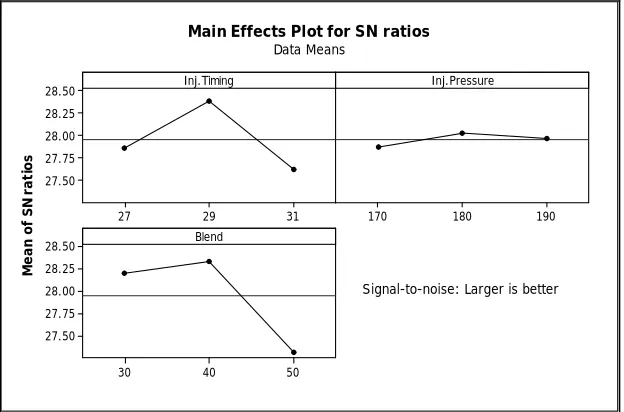
Figure 2 shows the response graph of taguchi experiment. It was used for selecting the optimum level of the parameters. The peak value of each graph is considered as the optimum points as these points are offering highest S/N ratios. The optimum points obtained from the response graph is listed in Table 6. These optimum parameters were used for the full range experiment.
4.2 Analysis of Variance (ANOVA)
The purpose of analysis of variance (ANOVA) is to investigate the percentage contribution of variance over the response parameter. Statically, there is a tool called an F-test named after Fisher to check the significance of variance on the output characteristic (Yang and Tarng., 1998). Usually, when F>4 means the change of the design parameter has a significant effect over the output characteristic. Table 7 indicates the percentage contribution of various parameters involved in Taguchi experiments. A parameter called blend proportion has the highest contribution over output characteristic whereas the injection pressure has the lowest contribution compared to other two parameters. This means that the change of injection pressure has insignificant effect over the output characteristics.
4.3 Experiment of Maximum blend at optimum setting
Using the optimum levels arrived by Taguchi method of optimisation a full range experiment was conducted and its results were compared with diesel baseline operation.
4.3.1 Brake Thermal Efficiency
Figure 3 shows the variation of brake thermal efficiency of 40T blend with load. It shows comparatively higher brake thermal efficiency for 40T blend than that of reference fuel, at all loads. This may be due to the presence of high volatile turpentine in the blend. Basically, turpentine is a cyclic compound of terpene (Basic element of turpentine). It decomposes easily at low temperature and releases more intermediate compounds (lighter HC fractions) immediately after injection. These may be the reasons for better performance of 40T than that of standard diesel operation.
The presence of turpentine in the blend causes longer ignition delay and rapid combustion. During longer ignition delay engine accumulates more fuel before the commencement of combustion and releases more fraction of heat during the premixed phase of combustion. This leads to higher cylinder pressure and higher brake thermal efficiency.
The maximum brake thermal efficiency obtained with 40T blend is 32.5% and it is 8% higher than that of standard diesel operation.
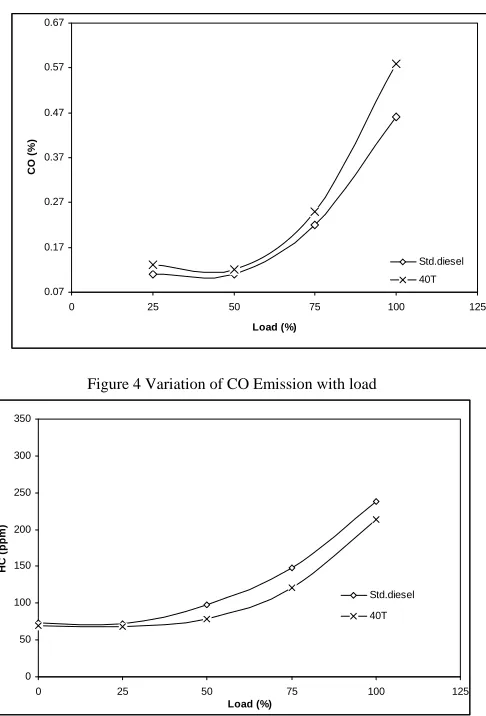
4.3.2 CO Emission
Figure 4 compares the CO emission of 40T blend with standard diesel operation. It shows higher CO emission for 40T blend than that of reference fuel at all loads. This may be due to the presence of considerable portion of lighter fuel (turpentine) in the 40T blend. The presence of lighter fuel in the blend causes longer ignition and releases more heat during the first phase of combustion. This leads to higher combustion temperature and higher exhaust gas temperature and consequently yields low volumetric efficiency. Hence, the injected blend finds relatively lower oxygen and emits more CO. This may be one of the main reasons for high CO emission at all loads.
More fuel admission and poor fuel utilization are the other reasons for high CO emission at high loads. The CO emission of 40T at full load is 22% higher than reference fuel.
4.3.3 HC Emission
Figure 5 compares the HC emission of 40T blend with standard diesel operation. It shows lower HC emission for 40T blend than that of reference fuel at all loads. This may be due to the production of higher combustion temperature, simple molecular structure and unstable nature of turpentine. The higher volatility and better air entrainment are considered as the probable reasons for lower HC emission.
The HC emission of 40T at full load is 210 ppm, which is 35 ppm lower than reference fuel. 4.3.4 NOx Emission
Figure 6 shows the variation of NOx emission with engine load. It shows that the NOx emission of 40T blend is higher than standard diesel operation at all loads. This may be due to the cetane suppressing property of turpentine. Usually, low cetane fuels offer longer ignition delay and release more heat during the premixed phase of combustion. This causes higher combustion temperature and enhances the reaction between oxygen and nitrogen and consequently yields more NOx compounds.
The maximum NOx obtained with 40T at full load is 1380ppm, which is 220 ppm higher than reference fuel.
4.3.5 Smoke Intensity
Figure 7 compares the Bosch Smoke Number (BSN) of 40T blend with standard diesel operation at various engine loads. It is observed that the 40T blend shows higher reduction of smoke at all loads. More specifically, at full load, it offers 50% lower smoke than that of standard diesel operation. This is due to the production of higher combustion temperature and rapid release of intermediate compounds.
The production of intermediate compounds splits the spray particle into finer one and provides least chances for formation of soot. This may be the main reason for lower smoke emission of 40T blend.
4.3.6 Ignition delay
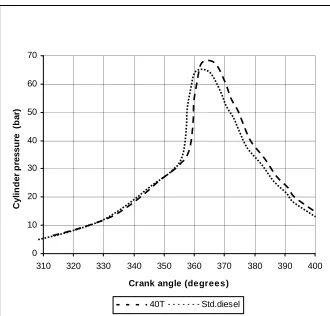
Figure 8 compares the cylinder pressure diagram of 40T with standard diesel operation at full load. It shows that the combustion of 40T occurs approximately 3 degrees later than standard diesel operation and produces peak pressure 5 degrees after TDC.
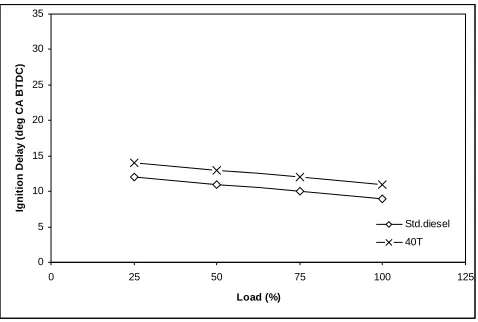
Figure 9 depicts the variation of ignition delay with engine load. The ignition delay of 40T blend is longer than that of standard diesel operation at all loads. This may be due to the reduction of charge temperature by evaporative cooling and the higher latent heat of vapourisation.
The ignition delay of 40T blend at full load is 11degrees. It is 3 degrees longer than standard diesel operation.
4.3.7 Heat Release Rate
Figure 10 compares the heat release rate of 40T blend with standard diesel operation at full load. From the figure, it is seen that the two phase of combustion is clearly visible and distinguishable. The first phase of combustion is higher than that of standard diesel operation as it has low cetane number and offers longer ignition delay. This is the main reason for higher brake thermal efficiency, shorter burn duration and higher peak pressure of 40T blend.
5. Conclusion
1. The results showed that the mixing of turpentine with diesel fuel upto 40% increases brake thermal efficiency by 1-2 % from the reference fuel.
2. Taguchi method of optimisation predicted optimum level of parameters within 9 trials and the 40T blend found working satisfactorily at optimum setting.
3. Comparatively a slighter increment in NOx emission was found while working with 40T blend at optimum setting.
4. Approximately 50% smoke reduction was achieved with 40T operation. 5. A smaller on shoot of CO was found with 40T operation at full load.
The results also proved that the blending of turpentine with diesel fuel upto 40% increases the engine performance without much worsening its emission.
Nomenclature
DBL Diesel baseline CI Compression ignition DI Direct injection BTE Brake thermal efficiency EGT Exhaust Gas Temperature CO Carbon monoxide UBHC Unburned Hydrocarbon NOx Oxides of Nitrogen
BTDC Before Top Dead Centre HRR Heat Release Rate HC Hydro carbon
Reference
[1] Devan.P.K, and Mahalakshmi.N.V (2010), ‘Combustion, Emission and Performance Characteristics of Diesel engine Fueled with Eucalyptus oil with an Ignition Enhancer’, International Journal of Green Energy, Energy and Environment, Vol.1, No.1, April 2010,pp. 40-49.
[2] Robert J. Last, Micheal Kruger, Manfred Durnholz (1995), ‘Emissions and Performance Characteristics of A 4- Stroke, Direct Injected Diesel Engine Fueled With Blends of Biodiesel and Low Sulfer Diesel Fuel’, SAE Trans., 950054, pp 1-13.
[3] Karthikeyan R. and Mahalakshmi N.V. (2005), ‘Performance and emission characteristics of four stroke DI diesel engine fueled with turpentine diesel blends’, Proceedings of the ICEF2005 ASME Internal Combustion Engine Division 2005 Fall Technical Conference, Sep 11-14, 2005, Ottawa, Canada.
[4] Karthikeyan R. and Mahalakshmi N.V. (2007), ‘Performance and emission characteristics of a turpentine–diesel dual fuel engine’, Energy the International Journal, Vol. 32, No. 7, July 2007, pp. 1202-1209.
[5] P.M. George a,Nisha Pillai b, Nisha Shah b. (2004),’Optimization of shot peening parameters using Taguchi technique’ Journal of Materials Processing Technology, 153–154 (2004) 925–930.
[6] W.H. Yang, Y.S. Tarng, (1998), ‘Design optimization of cutting parameters for turning operations based on the Taguchi method’ Journal of Materials Processing Technology, 84 (1998) 122–129.
[7] P.K. Palani and N. Murugan, (2006),’ Ferrite number optimisation for stainless steelcladding by FCAW using Taguchi technique’, Int. J. Materials and Product Technology, Vol. 4, 422–429.
List of Figures and Tables
Figure 1 Experimental setup
1 Diesel Engine, 2 Eddy current Dynamometer, 3 Dynamometer Control, 4 Anti pulsating Drum, 5 TD blends, 6 P-IV computer with DAQ, 7 Gas Analyzer Fumigator, 8 Smoke sampling pump Turpentine, 9 Exhaust temperature indicator, 10 Air inlet temperature indicator, 11 Two way valve, 12 Fuel Injection Pump, 13 Crank angle encoder, 14 Manometer.
31 29
27 28.50 28.25 28.00 27.75 27.50
190 180
170
50 40
30 28.50 28.25 28.00 27.75 27.50
Inj.Timing
Me
a
n
o
f S
N
r
a
ti
o
s
Inj.Pressure
Blend
Main Effects Plot for SN ratios
Data Means
Signal-to-noise: Larger is better
15 17 19 21 23 25 27 29 31 33 35
0 25 50 75 100 125
Load (%)
B
rak
e T
h
e
rm
a
l E
ff
ici
e
n
cy
(
%
)
Std.diesel
40T
Figure 3 Variation of brake thermal efficiency with load
0.07 0.17 0.27 0.37 0.47 0.57 0.67
0 25 50 75 100 125
Load (%)
CO
(
%
)
Std.diesel
40T
Figure 4 Variation of CO Emission with load
0 50 100 150 200 250 300 350
0 25 50 75 100 125
Load (%)
HC (
p
p
m
)
Std.diesel
40T
400 500 600 700 800 900 1000 1100 1200 1300 1400
0 25 50 75 100 125
Load (%)
N
O
x
(
ppm)
Std.diesel
40T
Figure 6 Variation of NOx Emission with load
Figure 7 Variation of Bosch Smoke Number with load
0 10 20 30 40 50 60 70
310 320 330 340 350 360 370 380 390 400
Crank angle (degrees)
C
y
lin
d
e
r p
res
su
re
(
b
a
r)
40T Std.diesel
Figure 8 Variation of cylinder pressure with crank angle at full load 0.5
1 1.5 2 2.5 3 3.5 4 4.5
0 25 50 75 100 125
Load (%)
B
os
c
h S
m
ok
e
numb
e
r
Std.diesel
0 5 10 15 20 25 30 35
0 25 50 75 100 125
Load (%) Igni ti on D e la y ( de g C A B TD C ) Std.diesel 40T
Figure 9 Variation of ignition delay with load
0 25 50 75 100 125 150 175
340 350 360 370 380 390 400 410 420 430 440
Crank angle (degrees)
H e at r el e ase r at e ( J/ d eg re e) Std.diesel 40T
Figure 10 Variation of net heat release rate at full loads
Table 1 - Physical and chemical properties of turpentine
Properties Gasoline Diesel Turpentine
Formula C4 to C12 C8 to C25 C10H16
Molecular Weight 105 200 136
Composition % Wt C 88 H 15 C 87 H 16 C 88.2 H 11.8
Density kg/m3 780 830 860-900
Specific Gravity 0.78 0.83 0.86-0.9
Boiling Point o C 30-220 180-340 150-180
Viscosity c St 0.4 3-4 2.5
Latent Heat of
Vaporization kJ/kg 350 230 305
Lower Heating
Value kJ/kg 43,890 42,700 44,000
Flash Point o C - 43 74 38
Auto Ignition
Temperature o C 300-450 250 300-330
Flammability limit
% Volume 1.4 1.0 0.8
Table 2 Process parameters and their levels
Symbol Parameters Units Level 1 Level 2 Level 3
A Injection timing CA BTDC 27 29 31
B Injection Pressure bar 170 180 190
C Blend % Turpentine 30 40 50
Table 3 Layout of L9 Orthogonal array
A B Error C
1 1 1 1 1 2 2 2 1 3 3 3 2 1 2 3 2 2 3 1 2 3 1 2 3 1 3 2 3 2 1 3 3 3 2 1
Table 4 Layout of Orthogonal Experiments
A B C 27 170 30 27 180 40 27 190 50 29 170 40 29 180 50 29 190 30 31 170 50 31 180 30 31 190 40
Table 5 S/N ratios of brake thermal efficiency
Inj.Timing Inj.Pressure Blend BTE SNR
27 170 30 28.04
27 180 40 28.25
27 190 50 27.27
29 170 40 28.72
29 180 50 27.85
29 190 30 28.59
31 170 50 26.85
31 180 30 27.98
31 190 40 28.01
Table 6 Optimum Value of Parameters
Parameters Value
Injection timing 29°BTDC
Injection pressure 180 bar
Table 7 ANOVA for the variance involved in Taguchi experiment
Parameters DOF SS MS F
Contribution (%)
Inj.Timing 2 0.895 0.469 72.15 32
Inj.Pressure 2 0.084 0.019 2.9 3
Blend 2 1.76 0.905 139.23 63
Error 2 0.06 0.0065 2