Lukas Jonkers and Michal Kuˇcera
MARUM – Center for marine environmental sciences, University Bremen, Leobener Straße 8, 28359 Bremen, Germany
Correspondence:Lukas Jonkers ([email protected])
Received: 17 August 2018 – Discussion started: 6 September 2018
Revised: 12 April 2019 – Accepted: 29 April 2019 – Published: 15 May 2019
Abstract.The species composition of many groups of ma-rine plankton appears well predicted by sea surface tempera-ture (SST). Consequently, fossil plankton assemblages have been widely used to reconstruct past SST. Most applications of this approach make use of the highest possible taxonomic resolution. However, not all species are sensitive to tempera-ture, and their distribution may be governed by other parame-ters. There are thus reasons to question the merit of including information about all species, both for transfer function per-formance and for its effect on reconstructions.
Here we investigate the effect of species selection on planktonic foraminifera transfer functions. We assess species importance for transfer function models using a random for-est technique and evaluate the performance of models with an increasing number of species. Irrespective of using models that use the entire training set (weighted averaging) or mod-els that use only a subset of the training set (modern analogue technique), we find that the majority of foraminifera species does not carry useful information for temperature reconstruc-tion. Less than one-third of the species in the training set is required to provide a temperature estimate with a prediction error comparable to a transfer function that uses all species in the training set. However, species selection matters for pale-otemperature estimates. We find that transfer function mod-els with a different number of species but with the same error may yield different reconstructions of sea surface tempera-ture when applied to the same fossil assemblages. This am-biguity in the reconstructions implies that fossil assemblage change reflects a combination of temperature and other en-vironmental factors. The contribution of the additional fac-tors is site and time specific, indicating ecological and ge-ological complexity in the formation of the sedimentary as-semblages. The possibility of obtaining multiple different
re-constructions from a single sediment record presents a pre-viously unrecognized source of uncertainty for sea surface temperature estimates based on planktonic foraminifera as-semblages. This uncertainty can be evaluated by determining the sensitivity of the reconstructions to species pruning.
1 Introduction
of full taxonomic resolution has been recently tested by Jug-gins et al. (2015), who demonstrated that transfer function techniques are variably sensitive to the influence of non-informative taxa. These authors used highly diverse assem-blages from coastal and lacustrine environments in which the proportion of uninformative or confounding taxa can be ex-pected to be high and species selection for transfer function models is intuitively appropriate.
However, marine microfossil assemblages (notably plank-tonic foraminifera) are less diverse and the species display a low degree of endemicity. In these circumstances, it would appear important to retain as many species in the training set as possible. Indeed, up to now, species pruning in ma-rine microplankton applications has been done, if at all, for practical rather than ecological reasons. Species were re-moved or lumped because of low abundance, preservation, or taxonomic issues (Hayes et al., 2005; Vernal et al., 2001; Zielinski et al., 1998). However, the minimum number of taxa required for a robust transfer function model, or the in-fluence of non-informative or nuisance taxa on such mod-els, has never been formally evaluated. This is remarkable, considering that many species of marine microplankton ap-pear to have similar responses to the modelled variables and that there is also evidence for responses to multiple variables (Telford et al., 2013; Siccha et al., 2009; Steinke et al., 2008). Furthermore, from a practical point of view, reducing the number of species in the model may improve counting statis-tics and reduce counting time. Finally, reducing taxonomic resolution may also be beneficial for the application of au-tomated identification and counting systems (e.g. Beaufort and Dollfus, 2004; Hsiang et al., 2016) and enable the use of legacy datasets with incomplete taxonomy. The lack of a formal evaluation of species pruning in marine microfossil studies is also relevant because of the prolific use of differ-ent transfer function techniques. The evaluation of species pruning by Juggins et al. (2015) was carried out for “global models” for which the entire training set is used to define the species response curve to an environmental variable. Such methods are used on marine microfossil applications as well (e.g. the Imbrie and Kipp method after Imbrie and Kipp, 1971; weighted averaging (WA), or artificial neural networks after Malmgren and Nordlund, 1997). However, in marine studies the most popular approach is the modern analogue technique (MAT). This approach uses similarity measures to identify a small “local” subset of samples from the training set to derive the environmental variable to be reconstructed. Such a local approach is fundamentally different and could be sensitive to species pruning in the training set in a differ-ent way.
Here we evaluate species importance for transfer func-tion performance for two widely differing methods (WA and MAT) representing both ends of the spectrum between lo-cal and global methods. We start by assessing species impor-tance to determine the ranking of species for transfer func-tion performance. We then investigate why some species are
more important than others. Finally, because the behaviour of transfer functions models cannot be assessed within the modern training set only, we assess the influence of species selection on paleotemperature reconstructions.
We use planktonic foraminifera as a model group, but the results from this study are likely of wider relevance to pa-leoecological reconstructions based on marine microfossils. Planktonic foraminifera are ideal for this purpose because of the existence of a large global training set (Siccha and Kuˇcera, 2017a) and because of strong evidence that their dis-tribution in surface sediments can be predicted by sea surface temperature alone (Bé and Hutson, 1977; Morey et al., 2005).
2 Data and methods
To derive the transfer functions, we use planktonic foraminifera assemblage data from core top sediments re-cently compiled in the ForCenS dataset (Siccha and Kuˇcera, 2017a). Multi-species categories and morphotypes were re-moved, and in the case of replicate samples (at the same location) one sample was randomly selected. Annual mean temperature was assigned to each sample in the training set based on data from climatology (Stephens et al., 2002) av-eraged over the upper 50 m and within a 100 km radius of each core top sample. To test the effect of species selec-tion on the performance of the transfer funcselec-tion outside of the calibration dataset, we analysed three fossil datasets. To evaluate the effect on assemblages with different diversity, we use two downcore records from the Atlantic: M35003-4 from the Caribbean (Hüls and Zahn, 2000), which spans 0–55 ka, and a longer 0–180 ka record from the Iberian Mar-gin: MD95-2040 (De Abreu et al., 2003a). To evaluate the effect on past spatial sea surface temperature (SST) patterns, we reanalyse the MARGO Last Glacial Maximum (LGM) dataset from the North Atlantic Ocean (Kuˇcera et al., 2005a). The taxonomy of all fossil samples was harmonized with the ForCenS dataset following the same criteria as in Siccha and Kuˇcera (2017a). Species not reported to be present in the downcore assemblages were assumed to be absent.
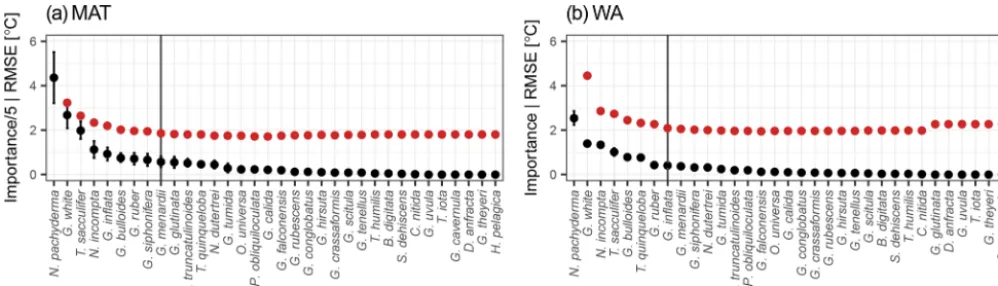
Figure 1.Species importance (black) and transfer function performance (red) for models including all species to the left of the point (e.g. the first red point for the MAT transfer function for the North Atlantic denotes the prediction error (root mean square error; RMSE) of a model withN. pachydermaandG. ruber(white). Error bars on the species importance show the standard deviation of 10 replicates; see “Data and methods” for details. The dark vertical lines indicate the species needed for a transfer function model in which including more species only leads to a marginal reduction in the reconstruction error (arbitrarily set at when the prediction error is within 10 % of the minimum). Note that for display purposes the species importance for MAT has been divided by a factor of 5.
entire approach is repeated 10 times in order to get an er-ror estimate of the species importance. For WA we use in-verse deshrinking to obtain the environmental variables, and for MAT we use the five closest analogues determined us-ing squared chord distance. We note that the way the species importance is assessed and the transfer function models with different numbers are designed implicitly uses a rest group of non-included species. This is because the calculations are based on the relative abundances of the species in the training set with the full taxonomic resolution. This procedure simu-lates a situation in which the total number of fossils in the studied group has been determined, but only a subset of the species has been counted.
Next, we use the species importance to build transfer function models with a successively increasing number of species. We start with the two most important species and in-crease the number according to the species importance rank-ing. The performance of each model (i.e. the prediction er-ror) was assessed using h-block cross-validation to account for the effect of spatial autocorrelation in the training set (Telford and Birks, 2009). We used a cut-off distance of 850 km, which was shown to be appropriate for the North Atlantic (Trachsel and Telford, 2016). Because of the pres-ence of cryptic species with specific ecological preferpres-ences, we have carried out the analyses separately for individual ocean basins following Kuˇcera et al. (2005a), assigning the new Red Sea samples of ForCenS to the Indian Ocean. The discussion below focusses on the North Atlantic Ocean be-cause of the abundance of both core top and downcore data, but the species ranking for the other oceans is provided in the Supplement. All calculations were carried out in R (R core team, 2016) using the packages rioja (Juggins, 2017), raster (Hijmans, 2017), vegan (Oksanen et al., 2018), and ggplot2 (Wickham, 2016).
3 Results and discussion
3.1 Species importance ranking
Irrespective of which regional training set is used, for both WA and MAT only a small number of species appears impor-tant (Fig. 1 and the Supplement). As shown by the example of the North Atlantic, cross-validation of the transfer func-tion models with an increasing number of species shows that there is a large tail of low-importance species that do not add information and hence do not lead to improved transfer func-tion performance (Fig. 1). In general, it appears that recon-structions with similar errors to the full species reconstruc-tion can be achieved with less than a third of the total number of species. The species importance ranking varies somewhat by method and region but is generally similar (Supplement). In the North Atlantic there is a 90 % overlap of the species in the top 10.
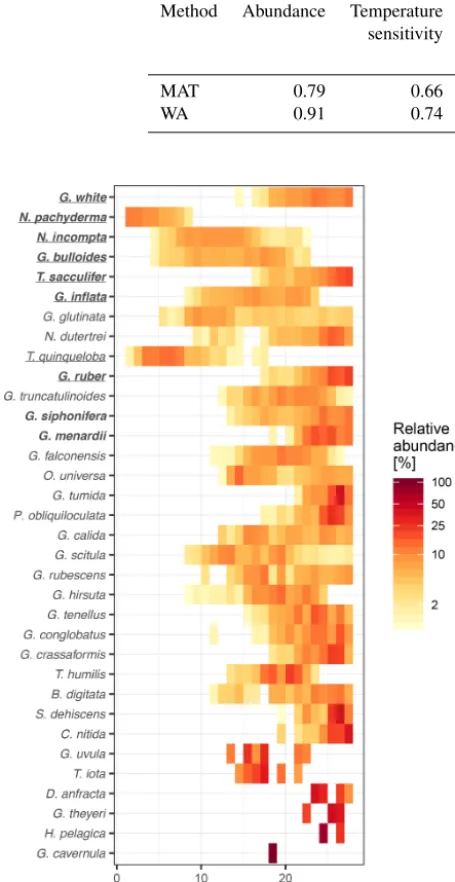
Table 1.Factors explaining species importance: coefficient of determination of linear regression between species importance and maximum abundance, thermal niche width, and temperature sensitivity.
Method Abundance Temperature Niche Abundance Abundance
sensitivity width +niche width +niche width +temperature sensitivity
MAT 0.79 0.66 0.21 0.83 0.84
WA 0.91 0.74 0.31 0.93 0.94
Figure 2. Species thermal niche ranked by average sedimentary abundance (top to bottom). Colours indicate average abundance (on a logarithmic scale) within 1◦C bins. The essential species (see Fig. 1) for MAT are marked in bold and those for WA are un-derlined. Despite their apparently well-defined thermal niche, rare species are not essential for transfer functions and those that are important are all abundant.
niche width are correlated. Counter-intuitively, this correla-tion is positive: species with a narrow thermal niche appear less temperature sensitive (r=0.60; Fig. 3b). We attribute this pattern to a combination of low abundance of species with narrow thermal niches (sensitivity being correlated with abundance) and the possibility that their distribution is not
Figure 3. Relationships between temperature sensitivity and (a)maximum relative abundance and (b) thermal niche width of planktonic foraminifera species in the ForCenS dataset. The posi-tive correlation between temperature sensitivity and abundance sug-gests that the thermal niche of abundant species is better defined than that of rare species, rendering abundance a good predictor of species importance. Panel(b)suggests that species with a narrow thermal niche are relatively insensitive to temperature, suggesting that the distribution of these, often rare, species may not be not pri-marily governed by temperature.
primarily governed by temperature, assuming that the nar-row thermal niche may be an artefact of adaptation to spe-cific oceanic regions or regimes only secondarily correlated with temperature. However, we also note that the detection of rare species is prone to uncertainty due to the limited num-ber of specimens counted, and the characterization of their ecological niche is thus inherently more difficult.
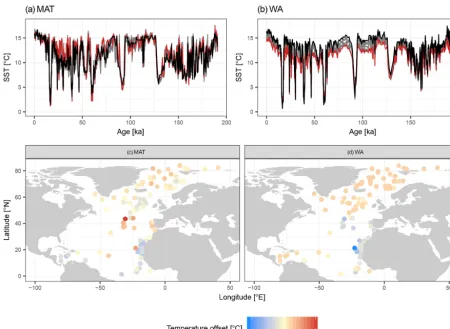
Figure 4.Species selection affects SST reconstructions: examples from two independent datasets showing the effect on temporal and spatial patterns in reconstructed SST.(a, b)SST reconstructions for core MD95-2040 from the Iberian Margin using 33 possible transfer function models with the number of species increasing according to their ranking. Red lines show the reconstructions with essential species only, dark grey lines the reconstructions with more species, and the black line is the “final” reconstruction with all species.(c, d)Spatial pattern of the difference between the SST reconstruction for the LGM with the minimum and with all species included.
3.2 Effect on reconstructions
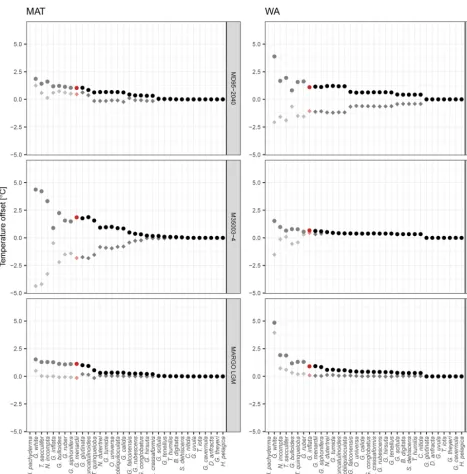
Despite the apparent lack of importance of many species in the transfer function model development, their inclusion matters for the reconstruction based on fossil assemblages. Transfer function models with pruned species numbers yield reconstructions that are systematically different from re-constructions with all species included (Fig. 4). The dif-ferences can be up to several degrees Celsius and variable in time and space, with important implications for paleo-ceanographic interpretations. As expected, the average dif-ference between a reconstruction with all species included and pruned species reconstructions decreases with an in-creasing number of species (Fig. 5). Importantly, species pruning not only results in more variability in the reconstruc-tions, but also leads to a real bias towards either lower or higher temperatures than a reconstruction with all species (Fig. 5).
Inclusion of the most important species leads to a rapid decrease in the difference between species-pruned and
all-species reconstructions, but unlike the all-species importance as-sessment (Fig. 1), adding more species leads to further step-wise decreases in the difference (Fig. 5). Importantly, steps in reconstruction difference occur with the addition of differ-ent species in differdiffer-ent cores, indicating that they result from specific downcore changes in the assemblage composition. The exception appears to beG. glutinatain the case of WA, which leads to an increase in both the prediction error and the difference of the reconstruction, supporting its potential rating as a nuisance species.
sug-Figure 5.Effect of species selection on SST reconstruction. Graphs show mean difference between reconstructions using species-pruned transfer function models and the model that includes all species. The results are ordered according to species importance, with each dot representing the result from a transfer function model with the species up to the marked point (similar to Fig. 1). Grey symbols are the reconstructions with fewer than the minimum number of species and red symbols the reconstructions with the minimum number of species. Dots are the average of the mean absolute difference, and diamonds are the mean difference.
gesting that it is a general pattern of the effect of species se-lection on SST reconstructions using planktonic foraminifera assemblages. In WA species pruning has a greater effect on the reconstruction error than in MAT, but for both meth-ods species pruning leads to different reconstruction with the same error. Taken at face value and in the absence of inde-pendent evidence, such inherent ambiguity renders it impos-sible to decide which of the reconstructions is more realistic.
This adds a previously unrecognized source of uncertainty to quantitative assemblage-based reconstructions.
3.3 Sensitivity to species pruning
recon-n species and its associated prediction error; arrows indicate the direction of increasing species numbers and decreasing species im-portance. The first point details a transfer function model with two species, and one species is added at each subsequent point. Open symbols highlight reconstructions with the essential species, the in-clusion of which leads to a reduction in the prediction error. The re-construction with minimum error and a minimum number of species is marked by a star. All other reconstructions are plotted as dots. Note that for MAT and WA the inclusion of the essential species leads to a reduction of the prediction error, but once these species are included there are still multiple reconstructions with the same error possible.
structions using a different number of species and evaluate its predictability by properties of the assemblages (Fig. 7). The pruning sensitivity for all fossil datasets is higher for MAT than for WA (Fig. 7) despite the fact that the minimum num-ber of essential species is higher for MAT. This suggests that MAT is inherently more sensitive to species pruning, perhaps because the method does not rely on extrapolation to define a species niche.
Intuitively, it would be expected that the effect of species pruning is larger in low-diversity assemblages. However, for both techniques and all datasets, pruning sensitivity is un-related to the number of species present in the fossil sample (Fig. 7). The fact that pruning sensitivity is not related to rich-ness confirms that diverse assemblages contain many unim-portant (redundant or uninformative) species. Especially for MAT, it could be expected that fossil samples with a com-position that differs most from the training set is most sen-sitive to pruning. This could be so if some species that are judged as uninformative in the training set carry environ-mentally relevant information downcore. Indeed, we observe such an effect of analogue quality, with poorer analogue as-semblages being more sensitive to pruning (Fig. 7). As ex-pected, the effect is stronger for MAT, but it is most clear in the downcore records. However, the fact that the effect is gen-erally weak combined with the absence of a clear common pattern in species pruning sensitivity (Fig. 7) highlights the difficulty of attributing assemblage changes to a single envi-ronmental factor and suggests that each site, or time slice, has unique species turnover dynamics. The uniqueness of
Figure 7. Exploring the effect of species richness and analogue quality on the sensitivity to species pruning. This sensitivity is de-fined as the standard deviation of the reconstructions with more than the minimum required number of species (i.e. based on trans-fer function models with uninformative species, which are those to the right of the red dot in Fig. 4). Analogue quality is defined as the average dissimilarity from the five most similar samples in the training set; zero values thus mean perfect analogues. A clear effect of richness cannot be observed, yet for some of the downcore re-constructions (MD95-2040 and M35003-4) poor analogues appear associated with higher pruning sensitivity, particularly for MAT.
Non-analogue situations could arise either secondarily from post-depositional changes in the assemblages or primarily and re-flect a biological response to an environmental variable other than temperature, which is not apparent in the training set because of temporally variable covariation between this pre-dictor variable and temperature.
Post-depositional changes in species assemblages could arise from processes like dissolution (Berger, 1968) or sed-iment (and thus fossil) mixing due to bioturbation (Hutson, 1977; Kuˇcera et al., 2005a). The effect of mixing should be most pronounced around intervals of assemblage change and may create fossil species assemblages with poor analogues in the training set. We have assessed to what degree analogue quality (dissimilarity from the training set) varies as a func-tion of change in the assemblages for the downcore records investigated here (Fig. 8). The observed relationship has a sign consistent with our hypothesis but is weak and not ap-parent in each time series, suggesting that analogue quality varies as a function of multiple parameters and does not sim-ply reflect sediment mixing. Furthermore, we consider the effect of dissolution on the fossil samples negligible and rule out expatriation as the cause of the observed patterns because expatriation is unlikely to have changed considerably in time. We thus infer that the major reason for the observed ambi-guity of the reconstructions is the effect of nuisance (non-temperature) variables on fossil assemblage composition.
3.4 Implications for paleoecological reconstructions Despite its intuitive simplicity and in spite of apparent sta-tistical support (Morey et al., 2005), relating species assem-blage change to a single environmental variable is not trivial (Juggins, 2013; Telford and Birks, 2009, 2005; Telford et al., 2013). This means that quantitative reconstructions based on transfer functions must be interpreted with caution and eval-uated in view of additional, independent evidence. Our anal-ysis provides further evidence for the temporal emergence of apparently non-temperature-related changes in fossil plank-tonic foraminifera assemblages that are not captured by cal-ibration (Telford et al., 2013; Steinke et al., 2008; Siccha et al., 2009). The ambiguity in reconstruction due to species selection thus highlights the potential of environmental vari-ables that appear unimportant in shaping species communi-ties today to explain changes in past assemblages. An impor-tant question is therefore how can this ambiguity be consid-ered when interpreting individual reconstructions? We rec-ommend, as a first step, using the approach outlined here (ranking of species importance for each basin is provided in the Supplement) to quantify the sensitivity of reconstructions to pruning and using this as an indication of the influence of secondary or nuisance variables on the reconstruction. This requires that the data are available at full taxonomic reso-lution, and we therefore explicitly encourage researchers to continue counting all species.
Figure 8.A possible role for sediment mixing in determining ana-logue quality (dissimilarity; see Fig. 6). Sediment mixing would create poor analogue assemblages when different species communi-ties are mixed. The difference between subsequent species commu-nities in the sediment core is defined here in two ways: (i) as the dif-ference in inferred temperature(a–d)and (ii) as the first derivative of the loadings of the first axis of a principal component analysis (PCA) on the species abundances(e–f). A linear regression includ-ing a 95 % confidence interval is shown as a red line with grey shad-ing. Only for core M35004-3 is a weak positive relationship visible, indicating that sediment mixing is a possible contributor to creating poor analogue assemblages but cannot explain them entirely.
Although a method to translate the effect of pruning into a mechanistic and quantifiable uncertainty estimate is not cur-rently available, one may conclude that reconstructions that are highly sensitive to species pruning indicate that the ob-served assemblage changes cannot be attributed solely to the environmental variable that is to be reconstructed.
to their importance for transfer function model development and shown that less than a third of the species is needed to derive a model that performs as well as (or better than) a model with full taxonomic resolution. Nevertheless, even though the addition of more species has little effect on the transfer function model performance, sea surface tempera-ture reconstructions with an increasing number of species are different. Thus, multiple different reconstructions are possi-ble and their reliability cannot be assessed by transfer func-tion performance in the training set. Our analysis suggests that fossil assemblages do not uniquely reflect a single envi-ronmental variable (sea surface temperature in this case) but rather provide an integrated response to biotic (but not tem-perature related) and abiotic (sediment mixing) factors. We have identified a new way to detect uncertainty (ambiguity) in transfer function reconstructions due to nuisance variables. The sensitivity of reconstructions to species selection can be quantified using the approach outlined here, facilitating an assessment of the robustness of the reconstruction.
Code and data availability. All datasets used in this study are in the public domain:
– ForCenS: https://doi.org/10.1594/PANGAEA.873570 (Siccha and Kuˇcera, 2017b);
– WOA: https://www.nodc.noaa.gov/OC5/WOA01/pr_woa01. html (last access: 26 February 2016; Stephens et al., 2002); – Core MD95-2040: https://doi.org/10.1594/PANGAEA.66811
(De Abreu et al., 2003b);
– Core M35003-4: https://doi.org/10.1594/PANGAEA.55756 (Hüls, 1999);
– MARGO LGM: https://doi.org/10.1594/PANGAEA.227329 (Kuˇcera et al., 2005b).
Code is available at https://github.com/lukasjonkers/species_ selection (last access: 2 May 2019).
Supplement. The supplement related to this article is available online at: https://doi.org/10.5194/cp-15-881-2019-supplement.
Competing interests. The authors declare that they have no con-flict of interest.
(grant German climate modeling initiative (PalMod)).
The article processing charges for this open-access publica-tion were covered by the University of Bremen.
Review statement. This paper was edited by Christian Ohlwein and reviewed by two anonymous referees.
References
André, A., Quillévéré, F., Morard, R., Ujiié, Y., Escarguel, G., de Vargas, C., de Garidel-Thoron, T., and Douady, C. J.: SSU rDNA Divergence in Planktonic Foraminifera: Molecular Taxon-omy and Biogeographic Implications, PLOS ONE, 9, e104641, https://doi.org/10.1371/journal.pone.0104641, 2014.
Bé, A. and Hutson, W.: Ecology of planktonic foraminifera and bio-geographic patterns of life and fossil assemblages in the Indian Ocean, Micropaleontology, 23, 369–414, 1977.
Beaufort, L. and Dollfus, D.: Automatic recognition of coccoliths by dynamical neural networks, Mar. Micropaleontol., 51, 57–73, https://doi.org/10.1016/j.marmicro.2003.09.003, 2004.
Berger, W. H.: Planktonic Foraminifera: selective solution and paleoclimatic interpretation, Deep-Sea Research and Oceano-graphic Abstracts, 15, 31–43, https://doi.org/10.1016/0011-7471(68)90027-2, 1968.
Darling, K. F., Wade, C. M., Siccha, M., Trommer, G., Schulz, H., Abdolalipour, S., and Kurasawa, A.: Genetic diver-sity and ecology of the planktonic foraminifers Globige-rina bulloides, Turborotalita quinqueloba and Neoglobo-quadrina pachyderma off the Oman margin during the late SW Monsoon, Mar. Micropaleontol., 137, 64–77, https://doi.org/10.1016/j.marmicro.2017.10.006, 2017.
De Abreu, L., Shackleton, N. J., Schönfeld, J., Hall, M., and Chapman, M.: Millennial-scale oceanic climate variability off the Western Iberian margin during the last two glacial pe-riods, Mar. Geol., 196, 1–20, https://doi.org/10.1016/S0025-3227(03)00046-X, 2003a.
De Abreu, L., Shackleton, N. J., Schönfeld, J., Hall, M. A., and Chapman, M. R.: Planktonic foraminifera, stable isotope record and temperature reconstruction of sediment core MD95-2040, PANGAEA, https://doi.org/10.1594/PANGAEA.66811, 2003b. Hayes, A., Kuˇcera, M., Kallel, N., Sbaffi, L., and Rohling, E. J.:
plank-tonic foraminiferal assemblages, Quaternary Sci. Rev., 24, 999– 1016, https://doi.org/10.1016/j.quascirev.2004.02.018, 2005. Hijmans, R. J.: raster: Geographic Data Analysis and Modeling, R
package version 2.6-7, available at: https://CRAN.R-project.org/ package=raster (last access: 12 May 2019), 2017.
Hsiang, A. Y., Elder, L. E., and Hull, P. M.: Towards a morpholog-ical metric of assemblage dynamics in the fossil record: a test case using planktonic foraminifera, Philos. T. R. Soc. B, 371, 1691, https://doi.org/10.1098/rstb.2015.0227, 2016.
Hüls, M.: Distribution of planktic foraminifera
of sediment core M35003-4, PANGAEA,
https://doi.org/10.1594/PANGAEA.55756, 1999.
Hüls, M. and Zahn, R.: Millennial-scale sea surface temperature variability in the western tropical North Atlantic from plank-tonic foraminiferal census counts, Paleoceanography, 15, 659– 678, https://doi.org/10.1029/1999PA000462, 2000.
Hutson, W. H.: Transfer functions under no-analog condi-tions: Experiments with Indian Ocean planktonic Foraminifera, Quaternary Res., 8, 355–367, https://doi.org/10.1016/0033-5894(77)90077-1, 1977.
Imbrie, J. and Kipp, N. G.: A new micropaleontological method for quantitative paleoclimatology: application to a late Pleistocene Caribbean core, in: The late Cenozoic glacial ages, edited by: Turekian, K. K., Yale University Press, New Haven, 71–181, 1971.
Jonkers, L. and Kuˇcera, M.: Global analysis of seasonality in the shell flux of extant planktonic Foraminifera, Biogeosciences, 12, 2207–2226, https://doi.org/10.5194/bg-12-2207-2015, 2015. Juggins, S.: Quantitative reconstructions in palaeolimnology: new
paradigm or sick science?, Quaternary Sci. Rev., 64, 20–32, https://doi.org/10.1016/j.quascirev.2012.12.014, 2013.
Juggins, S.: rioja: Analysis of Quaternary Science Data, R pack-age version (0.9-15.1), available at: http://cran.r-project.org/ package=rioja (last access: 12 May 2019), 2017.
Juggins, S., Simpson, G. L., and Telford, R. J.: Taxon se-lection using statistical learning techniques to improve transfer function prediction, Holocene, 25, 130–136, https://doi.org/10.1177/0959683614556388, 2015.
Kretschmer, K., Jonkers, L., Kuˇcera, M., and Schulz, M.: Modeling seasonal and vertical habitats of planktonic foraminifera on a global scale, Biogeosciences, 15, 4405– 4429, https://doi.org/10.5194/bg-15-4405-2018, 2018.
Kuˇcera, M., Weinelt, M., Kiefer, T., Pflaumann, U., Hayes, A., Weinelt, M., Chen, M.-T., Mix, A. C., Barrows, T. T., Cortijo, E., Duprat, J., Juggins, S., and Waelbroeck, C.: Reconstruc-tion of sea-surface temperatures from assemblages of planktonic foraminifera: multi-technique approach based on geographically constrained calibration data sets and its application to glacial At-lantic and Pacific Oceans, Quaternary Sci. Rev., 24, 951–998, 2005a.
Kuˇcera, M., Weinelt, M., Kiefer, T., Pflaumann, U., Hayes, A., Weinelt, M., Chen, M.-T., Mix, A. C., Barrows, T. T., Cortijo, E., Duprat, J. M., Juggins, S., and Waelbroeck, C.: Compilation of planktic Foraminifera census data, LGM from the Atlantic Ocean, PANGAEA, https://doi.org/10.1594/PANGAEA.227329, 2005b.
Lombard, F., Labeyrie, L., Michel, E., Bopp, L., Cortijo, E., Retailleau, S., Howa, H., and Jorissen, F.: Modelling plank-tic foraminifer growth and distribution using an
ecophysio-logical multi-species approach, Biogeosciences, 8, 853–873, 10.5194/bg-8-853-2011, 2011.
Malmgren, B. A. and Nordlund, U.: Application of artificial neu-ral networks to paleoceanographic data, Palaeogeogr. Palaeocl., 136, 359–373, https://doi.org/10.1016/S0031-0182(97)00031-X, 1997.
Morey, A. E., Mix, A. C., and Pisias, N. G.: Planktonic foraminiferal assemblages preserved in surface sediments correspond to mul-tiple environment variables, Quaternary Sci. Rev., 24, 925–950, https://doi.org/10.1016/j.quascirev.2003.09.011, 2005.
Oksanen, J., Blanchet, F. G., Friendly, M., Kindt, R., Legendre, P., McGlinn, D., Minchin, P. R., O’Hara, R. B., Simpson, G. L., Solymos, P., Henry, M., Stevens, H., Szoecs, E., and Wagner, H.: vegan: Community Ecology Package. R package version 2.5-2, available at: https://CRAN.R-project.org/package=vegan (last access: 12 May 2019), 2018.
R core team: R: A language and environment for statistical computing, R Foundation for Statistical Computing, Vienna, Austria, available at: https://www.R-project.org/ (last access: 12 May 2019), 2016.
Rebotim, A., Voelker, A. H. L., Jonkers, L., Waniek, J. J., Meggers, H., Schiebel, R., Fraile, I., Schulz, M., and Kuˇcera, M.: Factors controlling the depth habitat of planktonic foraminifera in the subtropical eastern North Atlantic, Biogeosciences, 14, 827–859, https://doi.org/10.5194/bg-14-827-2017, 2017.
Siccha, M. and Kuˇcera, M.: ForCenS, a curated database of planktonic foraminifera census counts in marine surface sediment samples, Scientific Data, 4, 170109, https://doi.org/10.1038/sdata.2017.109, 2017a.
Siccha, M. and Kuˇcera, M.: Compilation of planktonic foraminifera census counts in marine surface sediment samples (ForCenS), PANGAEA, https://doi.org/10.1594/PANGAEA.873570, 2017b. Siccha, M., Trommer, G., Schulz, H., Hemleben, C., and Kuˇcera, M.: Factors controlling the distribution of planktonic foraminifera in the Red Sea and implications for the develop-ment of transfer functions, Mar. Micropaleontol., 72, 146–156, https://doi.org/10.1016/j.marmicro.2009.04.002, 2009.
Steinke, S., Yu, P.-S., Kuˇcera, M., and Chen, M.-T.: No-analog planktonic foraminiferal faunas in the glacial southern South China Sea: Implications for the magnitude of glacial cooling in the western Pacific warm pool, Mar. Micropaleontol., 66, 71–90, https://doi.org/10.1016/j.marmicro.2007.07.008, 2008.
Stephens, C., Antonov, J., Boyer, T., Conkright, M., Locarnini, R., O’Brien, T., and Garcia, H.: World Ocean Atlas 2001. Volume 1, Temperature, in: NOAA Atlas NESDIS 49, edited by: Levi-tus, S., U.S. Government Printing Office, Washington DC, USA, 167 pp., 2002.
Telford, R. and Birks, H.: Evaluation of transfer functions in spa-tially structured environments, Quaternary Sci. Rev., 28, 1309– 1316, 2009.
Telford, R. J. and Birks, H. J. B.: The secret assumption of trans-fer functions: problems with spatial autocorrelation in evaluating model performance, Quaternary Sci. Rev., 24, 2173–2179, 2005. Telford, R. J., Li, C., and Kuˇcera, M.: Mismatch between the depth habitat of planktonic foraminifera and the calibration depth of SST transfer functions may bias reconstructions, Clim. Past, 9, 859–870, https://doi.org/10.5194/cp-9-859-2013, 2013. Trachsel, M. and Telford, R. J.: Technical note: Estimating unbiased


![Stability indicating HPLC method for the determination of chiral purity of r-(-)-5-[2-aminopropyl]-2-methoxybenzene sulfonamide](data:image/gif;base64,R0lGODlhAQABAIAAAP///wAAACH5BAEAAAAALAAAAAABAAEAAAICRAEAOw==)