R E S E A R C H A R T I C L E
Open Access
Method development and validation for
dieckol in the standardization of
phlorotannin preparations
Jiyoung Kim
1, Minyoung Um
1, Hyejin Yang
1, Inho Kim
1, Changho Lee
1, Yuntai Kim
1, Minseok Yoon
1,
Youngkyoung Kim
2, Jimi Kim
2and Suengmok Cho
1*Abstract
Phlorotannins are reported to have diverse biological properties. However, no analytical methods for the standardization of phlorotannin preparations have been reported. Herein, we developed and validated an analytical method for the determination of dieckol in phlorotannin extracts (PRT) using high-performance liquid chromatography (HPLC). The optimum HPLC conditions consisted of a Supelco Discovery C18 column stationary phase, a mobile phase (A: 15 % HPLC grade methanol in deionized water, B: methanol), UV detection at 230 nm, and a flow rate of 0.7 mL/min. The optimized chromatographic conditions were validated and exhibited good specificity and linearity (R2> 0.9994–1.0000). The recoveries were in the range of 100.9–102.3 %. The method had good intermediate (%RSD 1.2) and intra-day (%RSD 0.4–1.7) assay precisions. This HPLC method had good accuracy and quality in the determination of dieckol in PRT.
Keywords: Dieckol, HPLC measurement, Validation, Phlorotannins, Standardization
Background
Marine polyphenol phlorotannins are produced from secondary metabolites via the acetate-malonate pathway in brown seaweeds (Shibata et al., 2004; Isaza Martínez & Torres Castañeda 2013). They have fundamentally dif-ferent structures than the polyphenols of terrestrial plants (Isaza Martínez & Torres Castañeda 2013; Shibata et al., 2002). Terrestrial plant polyphenols are based on gallic acids or flavones, whereas phlorotannins are only derived from oligomers and polymers of phloroglucinol (1,3,5-trihydroxybenzene) (Koivikko et al., 2007). Thus far, many phlorotannins, such as dieckol, eckol, triphlor-ethol A, bieckol, fucol, fucophlortriphlor-ethol, have been identi-fied (Isaza Martínez and Torres Castañeda 2013; Kim et al., 2014; Cho et al., 2012).
Over the past 10 years, studies on the biological activ-ities of phlorotannins have increased exponentially (Isaza Martínez & Torres Castañeda 2013). They have a wide
range of biological properties, such as antioxidant (Zou et al., 2008), inflammatory (Kim et al., 2009), anti-allergic (Li et al., 2008), and neuroprotective effects (Ahn et al., 2012). Recently, Cho et al. (2014) reported that a phlorotannin preparation and its constituent, eck-stolonol, promoted non-rapid eye movement sleep via the benzodiazepine site of gamma-aminobutyric acid type A receptors. Therefore, phlorotannins are consid-ered a promising material for the development of func-tional foods and supplements.
The standardization of phlorotannin preparations is required for the development of functional foods (Hwang et al., 2009). However, a validation for the standardization of phlorotannin products has not been reported. Dieckol is generally the most abundant com-pound in phlorotannin preparations, and is used as an indicator compound (Shibata et al., 2004; Cho et al., 2012; Goo et al., 2010). Therefore, we developed and val-idated an HPLC method for the determination of dieckol for the commercialization of phlorotannin preparations.
* Correspondence:[email protected]
1Korea Food Research Institute, Sungnam 463-746, Korea
Full list of author information is available at the end of the article
Methods
Reagents and materials
Phlorotannin preparations (PRT) were obtained from S&D Co., Ltd. (Cheongwon-gun, Korea). The PRT were prepared from the brown seaweed, Ecklonia cava, using a macroporous adsorption resin, as described in our previous work (Kim et al., 2014). The total phlor-otannin content (TPC) of the PRT was assessed by the Folin-Ciocalteu method (Slinkard and Singleton, 1977), which determined that there were 905 mg phloroglucinol equivalents/g. Dieckol, a standard com-pound, was isolated using silica gel and Sephadex LH-20 column chromatography. All of the reagents used were of HPLC grade and purchased from Sigma-Aldrich Co. (St. Louis, MO, USA).
Preparation of dieckol and PRT samples
A dieckol stock solution was prepared by dissolving 5 mg in 2 mL of dimethyl sulfoxide (DMSO) and 3 mL of methanol. Analytical working solutions were prepared by diluting the stock solution with methanol to seven concentrations, i.e., 12.5, 25, 50, 100, 200, 300, and 400μg/mL. The phlorotannin extract (50 mg) was added to a volumetric flask, and was then dissolved in 10 mL of DMSO and 40 mL of methanol using ultrasonication at ambient temperature. The PRT sample solution was filtered through a 0.45 μm PTFE syringe filter paper (Whatman, Maidstone, UK), and was used as a sample solution for the HPLC analysis.
Method development for dieckol
We evaluated chromatographic variables, such as flow rate, mobile phase, solvent ratio, and column oven temperature to optimize the chromatographic condi-tions. The determination of dieckol, an indicator com-pound in PRT, was performed using an Agilent system (Agilent, Palo Alto, CA, USA) consisting of an autosam-pler, pump, degasser, and column oven. Shideido capcell-pak C18 UG (4.6 mm × 250 mm, 5 μm particle size; Shiseido, Tokyo, Japan), Cadenza C18 (4.6 mm × 150 mm, 3 μm particle size; Imtakt, Kyoto, Japan), and
Supelco Discovery C18 (4.6 mm × 250 mm I.D., 5 μm particle size; Supelco, Bellefonte, PA, USA) columns were used for the separation of dieckol. The analytical conditions (mobile phase composition, flow rate, oven temperature, and injection volume) are summarized in Table 1. The temperature of the column oven was
Table 1Chromatographic conditions for dieckol in phlorotannin preparations
Parameters HPLC measurement conditions
Set 1 Set 2 Set 3
Solutions A: 15 vol% MeOH in deionized water, B: methanol
Column Shideido capcellpak C18 Cadenza C18 Supelco Discovery C18
Mobile phase (A:B) 90:10 90:10 85:15
Flow rate (mL/min) 0.8 0.8 0.7
Oven temperature (°C) 35 35 25
Injection volume (μL) 10 10 5
Elution time (min) 60 60 55
fixed at 25 °C, and the UV detection wavelength for the phlorotannins was set to 230 nm.
Method validation
The method was validated in terms of its specificity, lin-earity, accuracy, recovery, and precision according to the guidelines of the International Conference on the Harmonization of Technical Requirements for Registra-tion of Pharmaceuticals for Human Use (ICH) (Jeong et al., 2013; International Conference on Harmonization ICH 1997).
Linearity
Linearity was tested at seven concentrations, i.e., 12.5, 25, 50, 100, 200, 300, 400 μg/mL. The linear regres-sion equation was calculated from the calibration curve as Y = Ax + B, where A and B are the slope and intercept of the calibration curve, respectively, x is the concentration of dieckol, and Y is the peak area (Goo et al., 2010; Kim et al., 2013). The correlation coefficient (R2) values were determined for the cali-bration curve.
Accuracy and recovery
The accuracy was measured by the recovery, which was determined by the addition of a known amount of dieckol (Ariffin et al., 2014; Moussata et al, 2014). Phlorotannin samples were mixed with three different concentrations of
dieckol, and the percent recoveries were calculated using the following equation:
Recoveryð Þ ¼% amount of dieckol recoveredðμg=mLÞ amount of dieckol addedðμg=mLÞ 100
Precision
The precision was determined using the intermediate (inter-day) and intra-day assays and reported as the percent relative standard deviation (%RSD) (Mittal and Parmar, 2010; Sarkar et al., 2006). The intermedi-ate assay was performed by two different analysts over four days, and the intra-day assay was analyzed through six replicate injections of each sample solu-tion. The %RSD was calculated using the following equation (Jeong et al., 2013):
%
ð ÞRSD¼ standard deviation
mean measured amount 100
Results and Discussion
Development of HPLC conditions for dieckol
Different chromatographic conditions (flow rate, solv-ent ratio, elution time, and oven temperature) were var-ied to optimize the HPLC analysis of dieckol in PRT (Table 1). Using the Set 1 conditions, the dieckol peak was separated from the other minor peaks (19 min), but had an unstable baseline (Fig. 1a). The Set 2
conditions did not show superior chromatographic re-sults (data not shown). However, the Set 3 conditions had the most stable baseline near the dieckol peak (25 min), and the peaks were well resolved (Fig. 1b). The peak stabilities of dieckol and the other phlorotan-nin constituents in the PRT were considerably affected by the chromatographic conditions. To confirm the de-tection wavelength for dieckol, its UV spectrum was re-corded between 200–550 nm, and it strongly absorbed at 230 nm (Fig. 1c). The PRT sample also showed same spectrum (data not shown). Henry and Alstyne (2004) reported that phlorotannins absorbed in the UV-C re-gion between 195–265 nm. These results showed that the optimum conditions for the detection of dieckol in PRT could be found through the use of various condi-tions in the HPLC system.
Validation of the proposed analytical method
The validation provides reliable documentation for standardization through regulated experiments (Shabir, 2003; Epshtein 2004). According to the United States Food and Drug Administration (FDA) and Pharmaco-peia, validation is a critical factor in the development of the functional food industry (Epshtein 2004; Kazakevich and Lobrutto 2007). Therefore, the validation of the analytical HPLC conditions was conducted in terms
of specificity, linearity, accuracy, recovery, and preci-sion (Satinder and Henrik 2011; Meyer, 2010).
Specificity is the ability to separate the target com-pound from interference in a mixture of components (Ariffin et al., 2014; Shabir, 2003). The chromatograms show the absence of any interfering peak near the reten-tion time of dieckol (25 min) (Fig. 2a and b). This indi-cated that the developed chromatographic parameters (Set 3) were adequate for the acceptable resolution of dieckol in the PRT during detection (Shabir, 2003).
Linearity is the ability to elicit results through the analysis of diverse concentrations within a given range (Shabir, 2003; Shah et al., 2014). A linear regression analysis (n= 3) was measured over seven different con-centrations (12.5–400 μg/mL), and its regression equa-tions are given in Table 2. The seven point calibration curves for dieckol were generated using the appropriate peak area ratios (data not shown). The slope ranged from 32.9–34.8 with a correlation coefficient (R2) value of 0.999. The R2 indicated an acceptable linearity over each concentration (12.5–400 μg/mL) (Shabir, 2003; Epshtein 2004). Shabir (2003) reported that R2> 0.999 is generally considered an acceptable value for a regres-sion line. Because each R2 was >0.998, the regression suggested good linearity between the peak areas and the compound concentrations over the tested range (Goo et al., 2010).
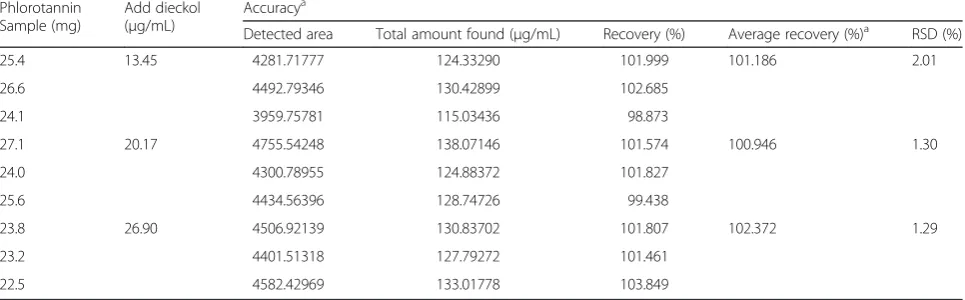
The accuracy was determined nine times at a minimum of three concentrations (13.45, 20.17, and 26.90 μg/mL) and the results are given in Table 3. The recovery of dieckol ranged from 98.8–103.1 % and the %RSD was 1.2–2.0. Shabir reported that the recovery (%) for an accuracy criterion should be 100 ± 2 % at each added concentration (Shabir, 2003). Our results showed re-coveries >98 %, which indicated that the method was acceptable for the quantification of dieckol in PRT.
The intermediate and intra-day (repeatability) assay precision must be evaluated in terms of dieckol
Table 2Linear regression equations for dieckol in phlorotannin preparationsa
Parameters Regression equationsb
Concentration (μg/mL) 12.5–400
Slope 34.575 32.992 34.864
Intercept 30.112 1.297 −24.646
Correlation coefficient (R2) 0.9994 1.000 0.9999
a
Values were calculated using linearity analyses (n= 3)
b
Regression equation is Y = Ax + B, where Y is the peak area and x is the dieckol concentration (μg/mL)
Table 3Accuracy validation for dieckol in phlorotannin preparations
Phlorotannin Sample (mg)
Add dieckol (μg/mL)
Accuracya
Detected area Total amount found (μg/mL) Recovery (%) Average recovery (%)a RSD (%)
25.4 13.45 4281.71777 124.33290 101.999 101.186 2.01
26.6 4492.79346 130.42899 102.685
24.1 3959.75781 115.03436 98.873
27.1 20.17 4755.54248 138.07146 101.574 100.946 1.30
24.0 4300.78955 124.88372 101.827
25.6 4434.56396 128.74726 99.438
23.8 26.90 4506.92139 130.83702 101.807 102.372 1.29
23.2 4401.51318 127.79272 101.461
22.5 4582.42969 133.01778 103.849
RSDrelative standard deviation of recovery
a
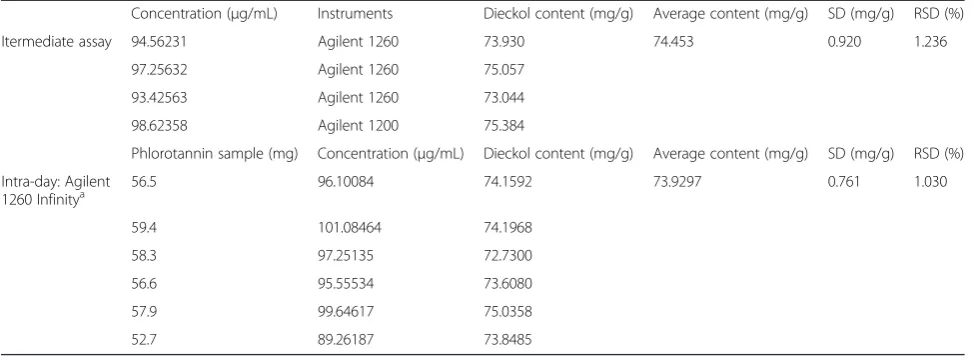
content (mg/g) and %RSD. Therefore, we tested the intermediate and intra-day assays through intra-lab variations, such as different days, analysts, equipment, and six replicate measurements for each sample (Shabir, 2003). As shown in Table 4, the intermediate assay results of the dieckol content and %RSD were 73.0–75.3 mg/g and 1.2, respectively. The intra-day assay results of the dieckol content and %RSD were 72.7–75.0 mg/g and 1.0, respectively. According to the International Con-ference on Harmonization (ICH), the precision criter-ion for the %RSD should be ≤2 % (International Conference on Harmonization ICH 1995; César et al., 2006). Based on our results, we confirmed that both %RSD values were <1.5 %, which indicated a good precision for the analysis of dieckol.
Conclusions
We successfully developed an HPLC method for the determination of dieckol in PRT. In addition, we sys-tematically investigated the validation of this analysis. Because information regarding the standardization of phlorotannin preparations or brown seaweed extracts is limited, our study could be useful for the develop-ment and commercialization of phlorotannins.
Competing interests
The authors declare that they have no competing interests.
Authors’contributions
JK investigated overall HPLC analysis of dieckol from phlorotannin extracts and designed to draft the manuscript. MU participated in the design of the study and performed the statistical analysis. IK, CL and YK helped conceived to the study. HY and MY carried out isolation and purification of dieckol from phlorotannin extracts. YK and JK analyzed quantification and validation of dieckol using the HPLC instrument. SC led of this study, and helped to prepare the manuscript. All authors read and approved the final manuscript.
Acknowledgements
This study was supported by grants from the Korea Food Research Institute (E0191402-07) and the Small and Medium Business Administration (G01981).
Author details
1
Korea Food Research Institute, Sungnam 463-746, Korea.2Korea Health Supplements Institute, Sungnam 463-400, Korea.
Received: 2 February 2016 Accepted: 16 February 2016
References
Ahn BR, Moon HE, Kim HR, Jung HA, Choi JS. Neuroprotective Effect of Edible Brown AlgaeEisenia bicyclison Amyloid Beta Peptide-induce Toxicity in PC12 Cells. Arch Pharm Res. 2012;11:1989–98.
Ariffin AA, Ghazali HM, Kavousi P. Validation of a HPLC method for determination of hydroxymethylfufural in crude palm oil. Food Chem. 2014;154:102–7. César IDC, Braga FC, Soares CDV, Nunan EDA, Pianetti GA, Condessa FA, et al.
Development and validation of a RP-HPLC method for quantification of isoflavone aglycones in hydrolyzed soy dry extracts. J Chromatogr B. 2006; 836:74–8.
Cho S, Yang H, Jeon YJ, Lee CJ, Jin YH, Baek NI, et al. Phlorotannins of the edible brown seaweedEcklonia cavaKjellman induce sleep via positive allosteric modulation of gamma-aminobutyric acid type A-benzodiazepine receptor: A novel neurological activity of seaweed polyphenols. Food Chem. 2012;132: 1133–11424.
Cho S, Yoon M, Pae AN, Jin YH, Cho NC, Takata Y, et al. Marine polyphenol phlorotannins promote non-rapid eye movement sleep in mice via the benzodiazepine site of the GABAAreceptor. Psychopharmacology. 2014;231:
2825–37.
Epshtein NA. Structure of Chemical Compounds, Methods of Analysis and Process Control: Validation of HPLC Techniques for Pharmaceutical Analysis. Pharm Chem J. 2004;38:2120–228.
Goo HR, Choi JS, Na DH. Quantitative Determination of Major Phlorotannins in Ecklonia stolonifera. Arch Pharm Res. 2010;33:539–44.
Henry BE, Alstyne KL. Effects of UV Radiation on Growth and Phlorotannins inFucus gardneri(Phaeophyceae) Juveniles and Embryos. J Phycol. 2004; 40:527–33.
Hwang JS, Kim SJ, Kim HB. Development and Industry of Health Functional Food in Korea. Food Sci Technol Res. 2009;15:1–4.
International Conference on Harmonization (ICH). Q2A: Text on Validation of Analytical Procedures. US FDA Federal Register. 1995;60:11260. International Conference on Harmonization (ICH). Q2b: Validation of Analytical
Procedures: Methodology. US FDA Federal Register. 1997;62:27463. Isaza Martínez JH, Torres Castañeda HG. Preparation and chromatographic
analysis of phlorotannins. J Chromatogr Sci. 2013;51:825–38. Table 4Precision (Intermediate assay and Intra-day) validation for dieckol in phlorotannin preparations
Concentration (μg/mL) Instruments Dieckol content (mg/g) Average content (mg/g) SD (mg/g) RSD (%)
Itermediate assay 94.56231 Agilent 1260 73.930 74.453 0.920 1.236
97.25632 Agilent 1260 75.057
93.42563 Agilent 1260 73.044
98.62358 Agilent 1200 75.384
Phlorotannin sample (mg) Concentration (μg/mL) Dieckol content (mg/g) Average content (mg/g) SD (mg/g) RSD (%)
Intra-day: Agilent
1260 Infinitya 56.5 96.10084 74.1592 73.9297 0.761 1.030
59.4 101.08464 74.1968
58.3 97.25135 72.7300
56.6 95.55534 73.6080
57.9 99.64617 75.0358
52.7 89.26187 73.8485
SDstandard deviation,RSDrelative standard deviation
a
Jeong HC, Shim YS, Rhee YK, Choi SY, Hong HD, Chung J, et al. Quantification of Marker Compounds inCirsium setidensNakai by HPLC-DAD. Food Sci Biotechnol. 2013;22:1481–6.
Kazakevich Y, Lobrutto R. HPLC for Pharmaceutical Scientists. Hoboken, New Jersey, USA: John Wiley & Sons, Ltd; 2007.
Kim AR, Shin TS, Lee MS, Park JY, Park KE, Yoon NY, et al. Isolation and Identification of Phlorotannins fromEcklonia stoloniferawith Antioxidant and Anti-inflammatory Properties. J Agr Food Chem. 2009;57:3483–9. Kim SM, Kang SW, Jeon JS, Jung YJ, Kim WR, Kim CY, et al. Determination of
major phlorotannins inEisenia bicyclisusing hydrophilic interaction chromatography: Seasonal variation and extraction characteristics. Food Chem. 2013;138:2399–406.
Kim J, Yoon M, Yang H, Jo J, Han D, Jeon Y, et al. Enrichment and purification of marine polyphenol phlorotannins using macroporous adsorption resins. Food Chem. 2014;162:135–42.
Koivikko R, Loponen J, Pihlaja K, Jormalainen V. High-performance Liquid Chromatographic Analysis of Phlorotannins from the Brown AlgaFucus Vesiculosus. Phytochem Analysis. 2007;18:326–32.
Li Y, Lee SH, Le QT, Kim MM, Kim SK. Anti-allergic Effect of Phlorotannins on Histamine Release via Binding Inhibition between lgE and FcεRI. J Agr Food Chem. 2008;56:12073–80.
Meyer VR. Practical High-Performance Liquid Chromatogaphy. 5th ed. Chichester, UK: John Wiley & Sons, Ltd; 2010.
Mittal A, Parmar S. Development and Validation of Rapid HPLC Method for Determination of Doxofylline in Bulk Drug and Pharmaceutical Dosage Forms. J Anal Chem. 2010;65:293–7.
Moussata J, Wang Z, Wang J. Development and validation of an HPLC method for the simultaneous quantification of carbinol acetate, indole-3-carbinol, and 3,3’-diindolylmethane in mouse plasma, liver, and kidney tissues. J Chromatogr B. 2014;958:1–9.
Sarkar M, Khandavilli S, Panchagnula R. Development and validation of RP-HPLC and ultraviolet spectrophotometric methods of analysis for the quantitative estimation of antiretroviral drugs in pharmaceutical dosage forms. J Chromatogr B. 2006;830:349–54.
Satinder A, Henrik R. HPLC Method Development for Pharmaceuticals. London, UK: Academic; 2011.
Shabir GA. Validation of high-performance liquid chromatography method for pharmaceutical analysis understanding the differences similarities between validation requirements of the US Food and Drug Administration, the US Pharmacopeia and the International Conference on Harmonization. J Chromatogr A. 2003;987:57–66.
Shah SR, Dey S, Pradhan P, Jain HK, Upadhyay UM. Method development and validation for simulataneous estimation of albendazole and praziquantel in bulk and in a synthetic mixture. J Taibah Univ Sci. 2014;8:54–63.
Shibata T, Fujimoto K, Nagayama K, Yamaguchi K, Nakayama T. Inhibitory activity of brown algal phlorotannins against hyaluronidase. Int J Food Sci Tech. 2002;37:703–9.
Shibata T, Kawaguchi S, Hama Y, Inagaki M, Yamaguchi K, Nakamura T. Local and chemical distribution of phlorotannins in brown algae. J Appl Phycol. 2004; 16:291–6.
Slinkard K, Singleton VL. Total phenol analysis: Automation and comparison with manual methods. Am J Enol Viticult. 1977;28:49–55.
Zou Y, Qian ZJ, Li Y, Kim MM, Lee SH, Kim SK. Antioxidant effects of phlorotannins isolated fromIshige okamuraein free radical mediated oxidative systems. J Agr Food Chem. 2008;56:7001–9.
• We accept pre-submission inquiries
• Our selector tool helps you to find the most relevant journal
• We provide round the clock customer support
• Convenient online submission
• Thorough peer review
• Inclusion in PubMed and all major indexing services
• Maximum visibility for your research
Submit your manuscript at www.biomedcentral.com/submit