ACTIVATED CARBON PREPARED
FROM EICHORNIA CRASSIPES AS AN
ADSORBENT FOR THE REMOVAL
OF DYES FROM AQUEOUS
SOLUTION
Rajeshwari Sivaraj
Department of Biotechnology, Karpagam University, Coimbatore-641021, Tamilnadu, India
R.Venckatesh
Department of Chemistry, Government Arts college, Udumalpet -642 126, Tamilnadu, India
Gowri
Department of Biotechnology, Karpagam University, Coimbatore-641021, Tamilnadu, India
G.Sangeetha
Department of Biotechnology, Karpagam University, Coimbatore-641021, Tamilnadu, India
Abstract :
The ability of the activated carbon prepared from Eichornia Crassipes to remove Reactive Magenta B and Reactive Turquoise Blue dyes from aqueous solution has been carried out as a function of contact time, dose (0.1-0.60 mg/50ml for Magenta B and 0.25-2.0 mg/50ml for Turquoise Blue), pH (2-10) and concentration (25, 50, 75, 100mg.L-1). An amount of 0.6 g of the adsorbent could remove 56.0% of the dye
from 100mg.L-1 Magenta B dye solution and 2.0 g could remove 45.87% of Turquoise Blue dye from 100
mg.L-1 Turquoise Blue dye solution. The amount of dye adsorbed per unit weight of the adsorbent
increased from 15.64 to 56.01mg.g-1 with increasing concentration from 25 to 100 mg.L-1. The kinetics of
adsorption was discussed in view of the kinetic models, the pseudo-first-order Lagergren model, Langmuir, Freundlich, Tempkin, Harkin’s-Jura, Elovich and the pseudo-second-order model.
Keywords: Adsorption, Kinetics, Eichornia Crassipes, Reactive Magenta B, Reactive Turquoise Blue
1. Introduction
Industrial effluents are one of the major causes of environmental pollution because effluents discharged from dyeing industries are highly colored with a large amount of suspended organic solid [1, 2]. Untreated disposal of this colored water into the receiving water body either causes damage to aquatic life or to human beings by mutagenic and carcinogenic effect. As a matter of fact, the discharge of such effluents is worrying for both toxicological and environmental reasons [3, 4]. Conventional wastewater treatment methods for removing dyes including physicochemical, chemical and biological methods, such as coagulation and flocculation [5], adsorption [6,7,8], ozonation [9], electrochemical techniques [10], and fungal decolorization [11]. Among these methods adsorption has gained favour in recent years due to proven efficiency in the removal of pollutants from effluents to stable forms for the above treatment methods [1]. Activated carbon, as an adsorbent has been widely investigated for the adsorption of dyes [12], but its high cost limits its commercial application. In recent years, there has been growing interest in finding inexpensive and effective alternatives to carbon, such as clay minerals [13], fly ash [14], peat [15], wood powder [16], coir pith [17,18] and lignin [19].
their structure and molecular size [1, 2]. Some dyes have been found to act as substrate for metal ions and may import contamination by heavy metals [20]. There are various conventional methods of removing dyes including coagulation and flocculation [21], oxidation or ozonation [22] and membrane separation [23]. However, these methods are not widely used due to their high cost and economic disadvantage. Most of the used dyes are stable to photo-degradation and oxidizing agents [24]. Hence, investigations have been conducted on several physical or chemical methods of removing color from textile effluent. These studies include the use of coagulants [25], ultra-filtration [26], electro-chemical [27, 28] and adsorption techniques [29,30].
2. Materials and Methods 2.1. Adsorbent and Adsorbate
Eichornia crassipes was collected from Kurichi reservoir at Coimbatore city, Tamil Nadu, India. It was cut into small pieces, dried in sunlight until all moisture was evaporated. The dried material was used for preparation of activated carbon by physical treatment method (180°C). The dyes used in the present study are Reactive Magenta HB and Reactive Turquoise Blue. All the dyes were obtained from Hindustan Ciba Geigy, Mumbai. All the reagents used were of analytical reagent grade and were obtained from SD’s Qualigens and Merck’s, Mumbai, India.
2.2 Preparation of activated carbon
Water hyacinth peel was completely filled in copper vessel of 36 x 2.8 cm and covered with a tight fitted lid to avoid contact with atmospheric air excepting the air trapped in the voids of the materials being activated. This set up was placed in the muffle furnace at a thermal temperature of 180°C for 1 hr. After cooling, the material was taken out and stored in plastic containers and used for further studies.
2.3 Preparation of synthetic solution
A stock solution of 1.0 g.L-1 was prepared by dissolving the appropriate amount of reactive Magenta
B, Reactive Turquoise Blue dye in 100 mL and made upto 1000 mL with distilled water. All the chemicals used throughout this study were of analytical-grade reagents. Double-distilled water was used for preparing all of the solutions and reagents. The initial pH is adjusted with 0.1 M HCl or 0.1 M NaOH. All the adsorption experiments were carried out at room temperature (25±2°C).
2.4. Batch sorption studies 2.4.1 Adsorption experiments
Batch mode experiments were carried out using water hyacinth activated carbon as an adsorbent to investigate the factors influencing the rate and extent of uptake of dyes by the adsorbent such as agitation time, dosage of adsorbent, pH and initial dye concentration.
2.4.2 Contact time and initial dye concentration studies
Studies were carried out by shaking (Model L Orbital) the adsorbent with 50 ml aqueous solution of dyes at different concentrations, at their natural pH and at room temperature (37°C) in 250 ml conical flask at 120 rpm.
2.4.3 Effect of adsorbent dose
The effect of the adsorbent dose on the equilibrium uptake of 50 ml of different concentrations of dyes (25, 50, 75, 100 mg.L-1) were investigated by agitating with different doses of adsorbent (0.1-0.6 g for
Magenta B and 0.25-2.0 g for Turquoise Blue), for a time greater than their equilibrium time at 120 rpm at their natural pH.
2.4.4 Effects of pH on Magenta B/Turquoise Blue biosorption
The effect of pH on the equilibrium uptake of the dyes were investigated by using 50 ml of dye solution of desired concentration (25, 50, 75, 100 mg.L-1) and known concentration of the adsorbent. The initial pH
2.5 Batch desorption studies
After adsorption experiments with desired concentration of the dye solution and known amount of adsorbent, the dye-laden adsorbent was separated out by centrifugation and the supernatant was discarded. The adsorbent was then given a gentle wash with double distilled water to remove any unadsorbed dye molecules. Desorption studies was carried out by agitating the carbon with 50 ml of distilled water with various concentrations of known desorption media (0.5, 1.0 and 2.0 N NaOH, H2SO4 andacetic acid) for a
time greater than the equilibrium time and the desorbed dye was estimated spectrophotometrically.
3. Results and Discussion
3.1. Effect of contact time and initial dye concentration
3.1.1 Removal Adsorption
Effect of contact time on adsorption of dyes Reactive Magenta B and Turquoise Blue on water hyacinth activated carbon is determined. Results indicate that the rate of dye removal progressively increased as the agitation time increased. The increase of the rate of colour removal with agitation time may be attributed to the decrease in the diffusion layer thickness surrounding the adsorbent particles and attained a plateau after a particular adsorbent concentration for the dye studied. For the Magenta B maximum Quantitative removal 90.41% was obtained at an adsorbent dose 500mg.L-1 and for the
Turquoise Blue the maximum quantitative removal.84.26% was obtained at an adsorbent dose of 1000mg.L-1. Further, it revealed that with increase in the dye concentration, the percentage removal of the
dye decreased whereas the amount of the dye adsorbed / unit weight of the adsorbent (mg.g-1) increased in
the range of concentration tested suggesting that the dye removal using adsorption technique is concentration dependent. Similar results have been reported by several authors for adsorption of dyes using low cost materials [31].
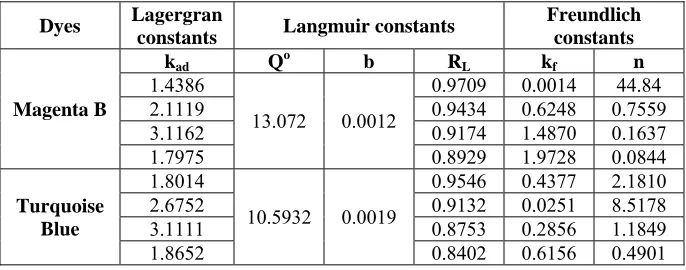
Table 1Constant parameters calculated for various adsorption models
Dyes Lagergran
constants Langmuir constants
Freundlich constants
Magenta B
kad Qo b RL kf n
1.4386
13.072 0.0012
0.9709 0.0014 44.84
2.1119 0.9434 0.6248 0.7559
3.1162 0.9174 1.4870 0.1637
1.7975 0.8929 1.9728 0.0844
Turquoise Blue
1.8014
10.5932 0.0019
0.9546 0.4377 2.1810
2.6752 0.9132 0.0251 8.5178
3.1111 0.8753 0.2856 1.1849
1.8652 0.8402 0.6156 0.4901
3.1.2. Adsorption dynamics
The rate at which the dissolved dye species are removed from aqueous solution by Eichornia Crassipes activated carbon is a highly significant factor for the utilization of this process in the treatment of dye waste.
3.1.3. Adsorption rate constant
The study of kinetics of adsorption is quite significant in wastewater treatment as it describes the solute uptake rate, which in turn controls the residence time of adsorbate uptake at the solid solution interface.
The rate constants adsorption for dye on the adsorbent was determined using the first order expression given by Lagergren.
log (qe-q) = log qe –(KadRT/2.303)t (1)
Where q and qe are the amount of dyes adsorbed (mg.g-1) by adsorbent at time, t and at equilibrium
time, respectively and Kad (min-1) is the rate constant of adsorption. Linear plots of log (qe – q) vs t for the
dye studied at different concentrations show the applicability of the above equation. The Kad values (Table
3.2. Isotherm data analysis
The relationship between the amount of a substance adsorbed at constant temperature and its concentration in the equilibrium solution is called the adsorption isotherm. The adsorption isotherm is important from both a theoretical and a practical view. In order to optimize the design of an adsorption system to remove the dye, it is important to establish the most important correlations of the equilibrium data of each system. Equilibrium isotherm equations are used to describe the experimental sorption data. The parameters obtained from the different models provide important information on the sorption mechanisms and the surface properties and affinities of the sorbent. The most widely accepted surface adsorption models for single-solute systems are Langmuir and Freundlich models. The correlation with the amount of adsorption and the liquid phase concentration was tested with Lagergren, Langmuir, Freundlich, Tempkin (Table 2, Fig. 1), Harkin’s-Jura (Table 3, Fig.2), Elovich (Table 5, Fig. 3a and 3b) and Pseudo second order (Table 4, Fig. 4a and 4b) equations. Linear regression is frequently used to determine the best-fitting isotherm, and judging the correlation coefficients compares the applicability of isotherm equations.
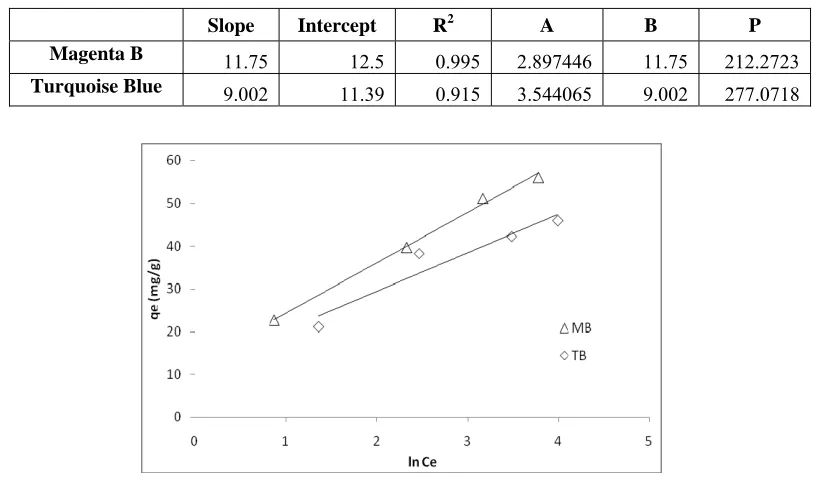
Table 2 Constant parameters and correlation coefficients for Tempkin model
Slope Intercept R2 A B P
Magenta B 11.75 12.5 0.995 2.897446 11.75 212.2723 Turquoise Blue 9.002 11.39 0.915 3.544065 9.002 277.0718
Fig.1 Tempkin isotherm for MB and TB sorption
Table.3 Constant parameters and correlation coefficients calculated for Harkin’s-Jura model
Slope Intercept R2 A B
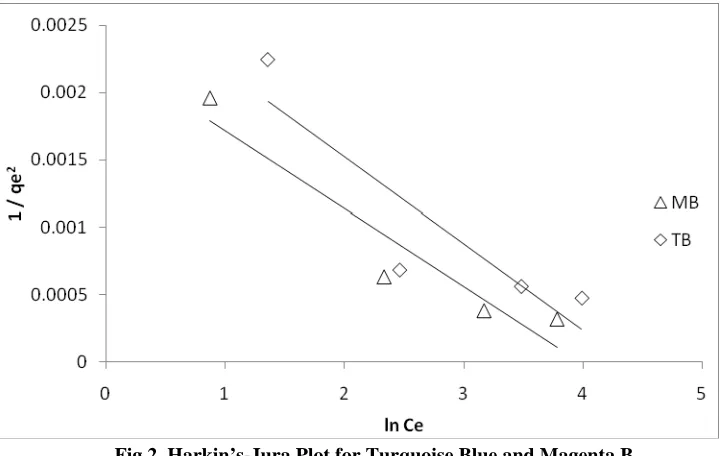
Fig.2. Harkin’s-Jura Plot for Turquoise Blue and Magenta B
Table 4 Constant parameters and correlation coefficients calculated for Pseudo Second order adsorption model
Conc
(mg.l-1) Slope Intercept R
2
K2 h Slope Intercept R2 K2 h
25 0.218 0.391 0.999 53.81586 2.558 0.234 0.385 0.999 47.43594 2.597 50 0.124 0.329 0.999 197.6791 3.04 0.129 0.214 0.999 280.8063 4.673 75 0.095 0.408 0.999 271.5768 2.451 0.118 0.185 0.999 388.2078 5.405 100 0.087 0.375 0.998 352.3143 2.667 0.108 0.167 0.999 513.3765 5.988
Table 5 Constant parameters and correlation coefficients calculated for Elovich adsorption model
Magenta B Turquoise Blue
Conc
(mg.l-1) Slope Intercept R
2
a b Slope Intercept R2 a b
25 0.083 1.114 0.943 3.180696 0.083 0.068 1.12 0.97 3.064854 0.068
50 0.112 1.541 0.919 2.903451 0.112 0.076 1.678 0.918 5.354836 0.076
75 0.159 1.564 0.951 2.614048 0.159 0.044 1.91 0.982 6.753089 0.044
Fig.3a. Elovich model plot for the adsorption of MB onto AC at different concentrations (25, 50, 75, 100 and 125mg.L−1)
3.2.1. Lagergren Equation
The adsorption kinetic data were described by the Lagergren pseudo-first-order model [32], which is the earliest known equation describing the adsorption rate based on the adsorption capacity. The differential equation is generally expressed as follows:
dqt / dt = k1 (qe – qt) (2)
Where qe and qt are the adsorption capacity at equilibrium and at time t, respectively (mg.g−1), k1 is the rate
constant of pseudo-first-order adsorption (L min−1). Integrating Eq. (2) for the boundary conditions t = 0–t
and qt = 0–qt gives
log (qe /(qe – qt)) = (k1 /2.303) t (3)
Eq. (3) can be rearranged to obtain the following linear form:
log(qe-qt) = log(qe) – (k1/2.303) t (4)
In order to obtain the rate constants, the values of log (qe − qt) were linearly correlated with t by plot of log
(qe − qt) versus t to give a linear relationship from which k1 and predicted qe can be determined from the
Fig.4a. Plot of the pseudo-second-order model at different MB concentrations.
Fig.4b. Plot of the pseudo-second-order model at different TB concentrations.
3.2.2. Langmuir isotherm
The theoretical Langmuir isotherm [26] is valid for sorption of a solute from a liquid solution as monolayer adsorption on a surface containing a finite number of identical sites. Langmuir isotherm model assumes uniform energies of adsorption onto the surface without transmigration of adsorbate in the plane of the surface [27]. Therefore, the Langmuir isotherm model was chosen for estimation of the maximum adsorption capacity corresponding to complete monolayer coverage on the sorbent surface. The Langmuir nonlinear equation is commonly expressed as follows:
qe = (QmKaCe / (1+ KaCe)) (5)
The correlation coefficient showed strong positive evidence on the adsorption of Magenta B/ Turquoise Blue onto the adsorbent follows the Langmuir isotherm. The applicability of the four linear forms of Langmuir model to the adsorbent was proved by the high correlation coefficients R2>0.99. This suggests
that the Langmuir isotherm provides a good model of the sorption system. The maximum monolayer capacity Qm obtained from the Langmuir is 13.072 and 10.5932 mg.g-1 for Magenta B/ Turquoise Blue
respectively.
3.2.3. The Freundlich isotherm
The Freundlich isotherm model [30] is the earliest known equation describing the adsorption process. It is an empirical equation that can be used for non-ideal sorption that involves heterogeneous sorption. The Freundlich isotherm can be derived assuming a logarithmic decrease in the enthalpy of sorption with the increase in the fraction of occupied sites and is commonly given by the non-linear equation:
qe = KFCe1/n (6)
Where KF is a constant for the system related to the bonding energy. KF can be defined as the adsorption or
The applicability of the Freundlich sorption isotherm was also analysed, using the same set of experimental data, by plotting log qe versus log Ce. The correlation coefficient (>0.98) showed that the Freundlich model
is comparable to the Langmuir model. The 1/n is lower than 1.0, indicating that Magenta B/ Turquoise Blue is favorably adsorbed by the adsorbent.
3.2.4. Tempkin isotherm
Tempkin adsorption isotherm model was used to evaluate the adsorption potential of the adsorbent for Magenta B/ Turquoise Blue. The derivation of the Tempkin isotherm assumes that the fall in the heat of sorption is linear rather than logarithmic, as implied in the Freundlich equation. The Tempkin isotherm has commonly been applied in the following form [33,34,35]
qe = ((RT / b) ln (A.Ce)) (8)
The Tempkin isotherm Eq.8 can be simplified to the following equation:
qe = βlnα+ βln Ce (9)
where β = (RT)/b, T is the absolute temperature in Kelvin and R is the universal gas constant, 8.314 J (mol K)−1.The constant b is related to the heat of adsorption [36,37]. The adsorption data were
analyzed according to the linear form of the Tempkin isotherm in Eq. (9). Examination of the data shows that the Tempkin isotherm fitted well the Magenta B / Turquoise Blue adsorption data for the adsorbent. The linear isotherm constants and coefficients of determination are presented in Table 2, Fig.1. The heat of Magenta B/ Turquoise Blue adsorption onto the adsorbent was found to increase from 0.356 to 0.681 kJ mol-1 with increase of the adsorbent dose from 2.0 to 6.0 g.L-1. The coefficients R2 obtained from Tempkin
model were comparable to that obtained for Langmuir and Freundlich equations, which explain the applicability of Tempkin model to the adsorption of Magenta B / Turquoise Blue onto the adsorbent.
3.2.5. Harkin’s-Jura isotherm:
Harkin’s-Jura isotherm assumes the presence of multiplayer adsorption with the existence of hydrogenous pore diffusion .The liberalized form of Harkin’s-Jura isotherms is:
1/ qe = (B/A) – (1/A (log Ce)) (10)
Where Ce is the equilibrium concentration of a dye in solution (mg.l-1), qe is the amount of dyes adsorbed
onto the adsorbent (mg.g-1) and A B are constants (Table 3,Fig.2).
3.2.6. Elovich equation
The Elovich equation is another rate equation based on the adsorption capacity generally expressed as following [38,39,40]
(dqt / dt) = BE exp (- AE.qt) (11)
Where BE is the initial adsorption rate (mg.(g.min)−1) and AE is the desorption constant (g.mg−1) during any
experiment.
It is simplified by assuming AEBEt >> t and by applying the boundary conditions qt = 0 at t = 0 and qt = qt at t = t Eq. (11) becomes
qt = (1/AE) ln (BEAE) + (1/AE) ln (t) (12)
If Magenta B/ Turquoise Blue adsorption by the adsorbent fits the Elovich model, a plot of qt versus ln(t)
should yield a linear relationship with a slope of (1/AE) and an intercept of (1/AE) ln(AEBE) .Thus, the
constants can be obtained from the slope and the intercept of the straight line (Table 5, Fig. 3a and 3b)
3.2.7. Pseudo-second-order equation
The adsorption kinetic may be described by the pseudo-second-order model [41].The differential equation is generally given as follows
(dqt / dt) = k2 (qe – qt)2 (13)
where k2 (g (mg min)−1) is the second-order rate constant of adsorption. Integrating Eq. (13) for the
boundary conditions qt = 0–qt at t = 0–t is simplified as can be rearranged and linearized to obtain
(t / qt) = (1 / K2qe2) + (t / qe) (14)
The second-order rate constants were used to calculate the initial sorption rate, given by the following equation
h = K2qe2 (15)
plots of t/qt versus t. The linear plots of t/qt versus t show good agreement between experimental and
calculated qe values at different initial dye and adsorbent concentrations (Table 4, Fig. 4a and 4b)
3.3. Effect of pH on dye adsorption
The pH of the dye solution was adjusted along with the adsorbent and dye solutions were agitated at their respective equilibrium time.50mg.l-1dye concentration used for the study. The removal of dye
decreases from 98.8% (pH 2) to 50.59% for Magenta B. The removal of dye decreases from 87.09% (pH 2) to 15.47% (pH 10) for Turquoise Blue.
3.4. Desorption and regeneration studies
Regeneration of used adsorbents and recovery of loaded pollutants are quite important in adsorption process. Desorption also helps it elucidate the mechanism of adsorption. In the case of Reactive Magenta B it increased from 5.43% to 15.87% and for Reactive Turquoise Blue it increased from 4.97% to 23.39%. The dyes desorbed were very insignificant with the desorbing agent of H2SO4 and acetic acid. The
percentage of desorption was comparatively higher with 0.5, 1.0 and 2.0 N NaOH. The type of desorption is of partially chemisorptions.
4. Conclusions
The results of the present work indicate that the Eichornia crassipes (Water hyacinth) activated carbon has the ability to remove dyes efficiently from the aqueous solution. The amount of dye removed increase rapidly in the initial period and slowly towards equilibrium time, as the agitation time increase for all the dyes. All the dyes obey Langmuir isotherm. The applicability of Langmuir isotherm suggests the monolayer coverage on activated carbon. All the dyes obey Freundlich isotherm. Maximum percentage removal was observed for Magenta B in all the pH range whereas Turquoise Blue shows the maximum removal of 98.5% only at pH 2 and the percent removal decreases as the pH lowered. The same trend was reported in Turquoise Blue. Desorption experiments were carried out with acetic acid, sulphuric acid and sodium hydroxide and was found to be negligible. This study clearly shows the activated carbon can be used as an adsorbent in the place of conventional flocculants like alum and ferric chloride. The cost analysis has not been carried out, but application of activated carbon from water hyacinth, which is found abundance in rivers, lakes and ponds in India, is expected to be economical.
Acknowledgement
The authors acknowledge the financial assistance received from University Grants Commission, New Delhi, India. (Ref. No. F.3-27/2004(SR) dt.12.01.2004)
References
[1] Q.Sun, L.Yang, (2003): The adsorption of basic dyes from aqueous solution on modified peat-resin particle, Water Research, 37, pp.1535–1544.
[2] M.N.V.Ravi Kumar, T.R.Sridhari, K.D.Bhavani, P.K.Dutta, (1998): Trends in color removal from textile mill effluents, Colorage, 40, pp.25-34
[3] P.Baskaralingam, M.Pulikesi, D.Elango, V.Ramamurthi, S.Sivanesan, (2006): Adsorption of acid dye onto organobentonite, J. Hazard, Mater, 128, pp.138–144
[4] A.Tor, Y.Cengeloglu, (2006): Removal of congo red from aqueous solution by adsorption onto acid activated red mud, J. Hazard. Mater, 138, pp.409–415
[5] J.Panswed and S.Wongchaisuwan, (1986): Mechanism of dye wastewater color removal by magnesium carbonate-hydrated basic, Water Sci. Technol., 18, pp.139–144
[6] M.Alkan, S.Celikcapa, O.Demirbas, M.Dogan, (2005): Removal of reactive blue 221 and acid blue 62 anionic dyes from aqueous solutions by sepiolite, Dyes Pigments, 65, pp.251–259.
[7] O.Abdelwahab, A.El Nemr, A.El-Sikaily, A.Khaled, (2006): Biosorption of Direct Yellow 12 from aqueous solution by marine green algae Ulva Lactuca, Chem. Ecol., 22, pp.253–266
[8] A.El-Sikaily, A.Khaled, A.El Nemr, O.Abdelwahab, (2006): Removal of methylene blue From aqueous solution by marine green alga Ulva lactuca. Chem. Ecol., 22 pp.149–157
[9] M.Muthukumar, N.Selvakumar, (2004): Studies on the effect of inorganic salts on decoloration of acid dye effluents by ozonation, Dyes Pigments, 62, pp.221–228.
[10] A.Alinsafi, M.Khemis, M.N.Pons and J.P.Leclerc, (2005): Electro-coagulation of reactive textile dyes and textile wastewater, Chem. Eng. Process, 44, pp.461–470
[11] C.Park, M.Lee, B.Lee, (2007): Biodegradation and biosorption for decolorization of synthetic dyes by Funalia trogii, Biochem. Eng. J., 36, pp.59–65
[13] R.Apak, K.Guclu, M.H.Turgut, (2001): Equilibrium Studies on Adsorption of Cu (II) from Aqueous Solution onto Cellulose, J. Colloid Interf. Sci., 243, pp.81–84
[14] G.S.Gupta, G.Prasad, K.K.Panday, V.N.Singh, (1988): Removal of chrome dye from dye aqueous solutions by fly ash, Water Air Soil Pollut., 37, pp.13.
[15] Y.S.Ho, G.McKay, (1988): Sorption of dye from aqueous solution by peat, Chem. Eng. J., 70, pp.115–124.
[16] F.Ferrero, (2007): Dye removal by low cost adsorbents, hazelnut shells in comparison with wood sawdust, J. Colloid Interf. Sci., 142, pp.144–152
[17] D.Kavitha, C.Namasivayam, (2007): Recycling coir pith an agricultural solid waste for the removal of procion orange from wastewater, Dyes Pigments, 74, pp.237–248
[18] C.Namasivayam, D.Kavitha, (2002): Removal of Congo red from water by adsorption onto activated carbon prepared from coir pith an agricultural solid waste, Dyes Pigments, 54, pp.47–58
[19] S.J.Allen, G.McKay K.Y.H.Khader, (1989): Equilibrium adsorption isotherms for basic dyes onto lignite, J. Chem. Tech. Biotechnol.,45, pp.291–302.
[20] K.A.Stravastava, S.K.Gupta, M.V.S.Iyer, (1984): Color removal from paper mill waste. J. of Inst. Public Health Eng. India, Part 2/3, pp.59-64
[21] J.J.M.Órfão, A.I.M.Silva, J.C.V.Pereira, S.A.Barata, I.M.Fonseca, P.C.C.Faria, M.F.R.Pereira, (2006): Adsorption of reactive dyes on chemically modified activated carbons-Influence of pH, J. Colloid Interf. Sci., 296, pp.480-489
[22] P.K.Malik, S.K.Saha, (2003): Oxidation of direct dyes with hydrogen peroxide using ferrous ion as catalyst, Separation and Purification Technology, 31, pp.241-250.
[23] G.Ciardelli, L.Corsi, M.Marussi, (2001): Membrane separation for wastewater reuse in the textile industry, Resource Conservation and Recycling, 31, pp.109-113.
[24] K.R.Ramakrishna, T.Viraraghavan, (1997): Dye removal using low cost adsorbent, Water Sci. Technol., 36, pp.189-196. [25] A.Bozdogan, H.Goknil, (1987): The removal of the color of textile dyes in wastewater by the use of recycled coagulant, MU Fen.
Billimeri. Dergisi. Sayi, 4, pp.83.
[26] K.Majewska-Nowak, (1989): Effect of flow conditions on ultra-filtration efficiency of dye solutions and textile effluents, Desalination, 71, pp.127.
[27] O.R.Shendrik, (1989): Electro membrane removal of organic dyes from wastewaters, Kimiyi. Technol. Vody, 11, pp.467 [28] Z.Ding, C.W.Min, W.Q.Hui, (1987): A study on the use of bipolar particles-electrode in the decolorization of dying effluents and
its principle, Water Sci. Technol., 19 (3/4), pp.39.
[29] A.Gurses, C.Dogar, M.Yalc-in, M.Acikyildiz, R.Bayrak, S.Karaca, (2006): The adsorption kinetics of the cationic dye methylene blue onto clay. J. Hazard. Mater. 131, pp.217–228
.[30] A.El-Sikaily, A.Khaled, A.El Nemr, O.Abdelwahab, (2006): Removal of methylene blue from aqueous solution by marine green alga Ulva lactuca, Chem. Ecol., 22, pp.149–157.
[31] G.Mckay, Oterburn M.S, D.A.Aga, (1985): Fullers earth and fired clay as adsorbent for Dye Stuffs. Equilibrium and rate constants, Water Air Soil pollut., 24, pp.307-322.
[32] S.Lagergren, (1898): Zur theorie der sogenannten adsorption geloster stoffe Kungliga Svenska Vetenskapsakademiens, Handlingar, 24, pp.1–39.
[33] C.Aharoni and D.L.Sparks, (1991): Kinetics of soil chemical reactions—a theoretical treatment. In: D.L.Sparks and D.L.Suarez, Editors, Rate of Soil Chemical Processes, Soil Science Society of America, Madison, WI pp.1–18.
[34] C.Aharoni and M.Ungarish, (1977): Kinetics of activated chemisorption. Part 2. Theoretical models, J. Chem. Soc., Faraday Trans. 73, pp.456–464.
[35] X.S.Wang and Y.Qin, (2005): Equilibrium sorption isotherms for of Cu2+ on rice bran, Process Biochem. 40, pp.677–680.
[36] G.Akkaya and A.Ozer, (2005): Adsorption of acid red 274 (AR 274) on Dicranella varia: determination of equilibrium and
kinetic model parameters, Process Biochem. 40 (11), pp.3559–3568.
[37] C.I.Pearce, J.R.Lioyd and J.T.Guthrie, (2003): The removal of color from textile wastewater using whole bacterial cells: a review, Dyes Pigments, 58, pp.179–196.
[38] S.H.Chien and W.R.Clayton, (1980): Application of Elovich equation to the kinetics of phosphate release and sorption on soils, Soil Sci. Soc. Am. J. 44, pp.265–268.
[39] D.L.Sparks, (1986): Kinetics of Reaction in Pure and Mixed Systems, in Soil Physical Chemistry, CRC Press, Boca Raton,.
[40] J.Zeldowitsch, (1934): Über den mechanismus der katalytischen oxidation von CO a MnO2, Acta Physicochim. URSS, 1, pp.364–
449.