Examination of hospital length of stay in Canada among patients with acute bacterial skin and skin structure infection caused by methicillin-resistant <em>Staphylococcus aureus</em>
Full text
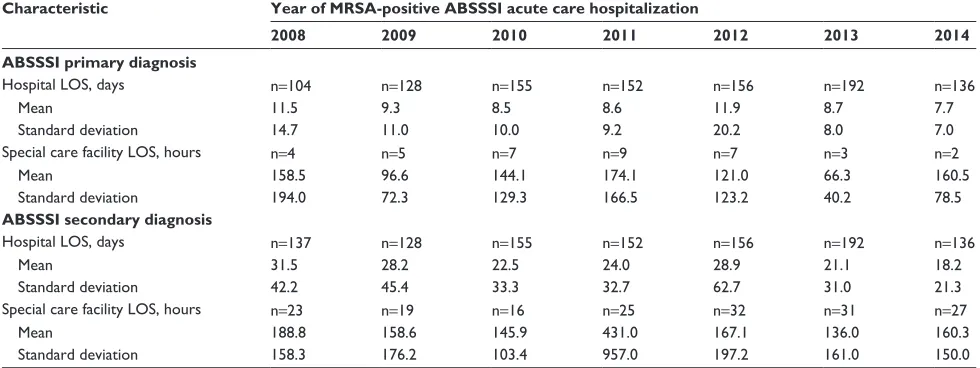
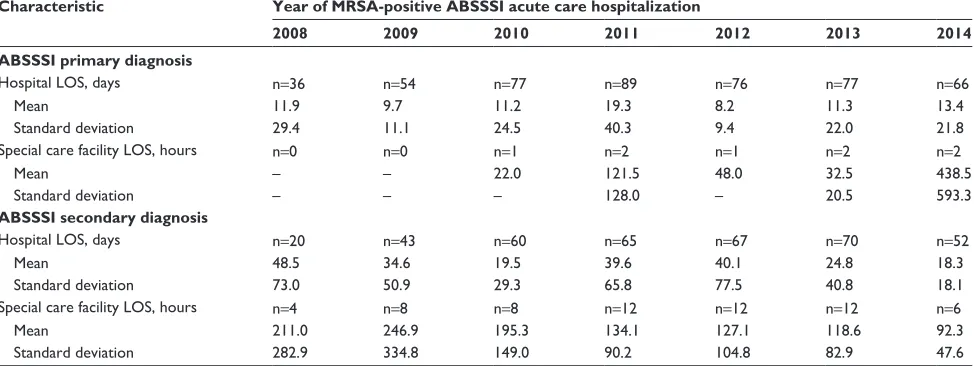
Figure
Related documents
received B.Tech degree (2014) in Mechanical Engineering at Jyothi Engineering College, Thrissur-679531, Kerala under University of Calicut, Kerala, India. He had presented one paper
Variations of the class and study, as I discussed in more depth in chapter four, would provide better results: additional assistance with Second Life, more time for unit one,
Apollo hospitals group, Wockhardt, Escorts, Fortis, Hinduja and Breach Candy are some of the names in healthcare that have come forward to tie up with tourism industry
The results of simulations show that the pattern synthesized by the traditional least square method fits the targeted pattern badly and is worse in the key performance indicators of
Since the air-gap flux density generated by the proposed machine is greater than that of the existing machine, the iron loss of the proposed machine both in stator and rotor is
Figure 3: Current Voltage Characteristics [14] Junctionless fabrication process is greatly simplified, compared to standard CMOS since there are no doping concentration
Unnamable , to come back to Deleuze, is the encounter of the narrative voice with the exigency of its radical suffering, and it is this encounter that exposes Beckett’s writing
(2009): 'Circular Migration and Multi locational Livelihood Strategies in Rural India', Oxford University Press, New Delhi.. Soft copy, India D-series,
