Correspondence author: [email protected]
TRUE MECHANICAL BEHAVIOUR AND THE ASSOCIATED STRUCTURE
MORPHOLOGY OF POLY(LACTID ACID) POLYMER IN STRAIN INDUCED
CRYSTALLISATION BY IN-SITU TIME RESOLVED X-RAY DIFFRACTION
AND SCATTERING TECHNIQUE
Muhammad Rawi Mohamed Zin*1,2, Arumugam Mahendrasingam2,
Chris Konkel3 and Theyencheri Narayanan4
1
Material Technology Group, Malaysia Nuclear Agency, 43000 Kajang, Malaysia
2
Keele University, Department of Physics and Astrophysics,Staffordshire, ST5 5BG, United Kingdom
3
Innovia Films Ltd. Station Road Wigton, Cumbria CA7 9BG, United Kingdom
4
European Synchrotron Radiation Facility (ESRF), 38000 GRENOBLE, France
ABSTRACT
Changes in molecular structure configuration during strain induced crystallisation of an amorphous Poly(Lactic Acid) (PLA 4032D) polymer was monitored in-situ by simultaneously recording the wide angle x-ray scattering (WAXS) and small angle x-ray scattering (SAXS) patterns together with polymer deformation images and force data. The amorphous chain orientation from the beginning of deformation until the onset of crystallisation was studied from the WAXS patterns. The true mechanical behaviour described by the true stress-true strain curve related to an amorphous chain orientation exhibited a linear behaviour. Approaching critical amorphous orientation, the true stress-true strain curve deviated from linear into non-linear behaviour. After the onset of crystallization, when the deformed polymer became a semicrystalline state, the true mechanical behaviour exhibited true strain hardening which greatly affected by the formation of the morphology. The gradual true strain hardening was associated with the formation of micro-fibrillar structure containing thin crystallite morphology whilst sharp increased in true strain hardening was associated with the formation of stacked lamellar morphology in the form of macro-lattice structure. The study was accomplished by the application of high brilliance synchrotron radiation at beamline ID2 of ESRF, Grenoble in France and the usage of the high contrast resolution of WAXS and SAXS charge-couple device (CCD) camera as well as 40 milliseconds temporal resolution of data acquisition system.
Keywords: PLA, crystallisation, WAXS, SAXS, synchrotron, micro-bril, stacked lamellar
INTRODUCTION
54 been made.
In the past, the structural morphology that causes the gradual and the sharp strain hardening were limited to the WAXS and SAXS studies through interrupted drawing only. It should be noted that, the phase transformation from an amorphous to the crystals during strain induced crystallisation is a rapid process and involved complex mechanism [Kawakami et al., 2008; Gorlier et al., 2001], particularly at the early stage of crystallisation, where the strain hardening is likely to take place. In the interrupted drawing, more caring should be given to the sample because phase transformation is likely to occur while bringing the drawn sample to WAXS or SAXS experiment [Blundell et al., 2000]. Therefore, the WAXS and SAXS data obtained by this approach may not truly represent the actual crystal or morphology developed during strain induced crystallisation. The purpose of this article is to investigate the phases transformation of polymer PLA 4032D during orientation and crystallisation in uniaxial deformation and the development of the morphology and their effect to the mechanical behaviour. The investigations were conducted in-situ by the time-resolved WAXS and SAXS techniques utilising the high brilliance X-ray source from synchrotron radiation at ID2 instrument of the ESRF, Grenoble, France, with 40 milliseconds temporal resolution.
EXPERIMENTAL
The 400,000 g mol-1 with 1.4 % D-isomer content) have been prepared by extrusion process were cut to a uniaxial sample. The height and the width of the sample are approximately 36.0 mm and 10.0 mm respectively with the thickness around 1.0mm. The permanent ink was line-up horizontally on the sample as a strain gauge. The sample was clamped into the jaws which mechanically coupled to the shaft and pinion of the motor of Keele Polymer camera [Blundell et al., 2000; Hughes et al., 1999]. Before stretching, the sample has been soaked at temperature 70oC and 80oC for two minutes. The stretching began once the motor was activated and the same time, the WAXS, SAXS camera and force transducer were recoding the data simultaneously with a drawing speed of 0.093s-1. The internal temperature of the oven is maintained at drawing temperatures around
±1oC variation. The temperature was measured by thermocouple via a feedback controller and the circulating fans were used to distribute and maintain the heat evenly around the sample in the oven.
The heated samples had been drawn while the force, the WAXS and the SAXS patterns have been recorded. The energy of the X-ray was fixed at a wavelength of 0.9965 Å with the fluxes on the sample plane around the order of magnitude of 24. The SAXS camera was placed at 10.0 metre from the sample and the WAXS camera was position horizontally next to the SAXS at an angle of 35o relative to direct X-ray beam from the pin-hole collimator. The force-transducer was calibrated to measure the force due to the stretching.
-diode, with the displacement of the pen- true stress was calculated from the
draw ratio and the force, f, using Eq. (1) and true strain or Henky strain, true strain, was calculated using
55
true stress = (1)
true strain (2)
The mechanical behaviour was described by the evolution of true stress and true strain curve in relation with the development of the amorphous orientation and during crystallisation. The crystallisation rate Kc during strain induced crystallisatio
the crystallisation time, t, using Avrami formula shown in Eq. (3)[Mahendrasingam et al., 2000; Mahendrasingam et al., 1999; Avrami, 1941 is the final relative crystallinity used in the fitting. The ratio of the area under the Bragg peak (200)/(110) to the total area has been used to determine the relative crystallinity.
cn (3)
The crystallisation rate was calculated by assuming the formation and changes in the amorphous orientation prior to crystallisation occurs by first order transformation (n=1). At 70oC, the evolution of microfibril morphology was studied based on radius of Gyration. At 80oC, the long spacing of lamellar morphology was determined from the evolution of four-point and two-point SAXS patterns.
RESULTS AND DISCUSSION
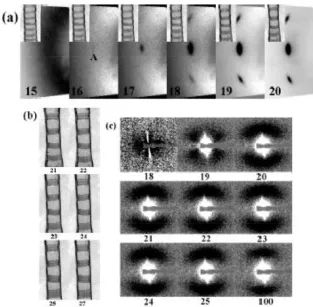
The amorphous halo at frame 8 shows that the polymer chains are isotropic and randomly distributed at the initial stage of deformation. Upon drawing, the chain became oriented in the direction of the applied force causes the WAXS pattern intensified around scattering vector of 0.18 Å-1 as shown by frame 19. This indicates the nearest distance of neighboring chains. Increasing strains induced the onset of crystallisation as shown by Bragg peaks (200)/(110) at frame 20 and Bragg peak (203) clearly seen on the WAXS pattern at frame 20 onwards. This shows the
56
Fig. 1: The WAXS (a) and SAXS (b) patterns during the early stage of crystallization at 70oC at draw rate of 0.093 s¡1. The inset in the WAXS pattern shows the video image of the sample
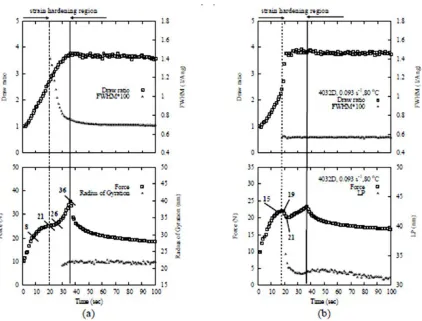
Fig. 1(b) shows the streak SAXS pattern at frame 28 indicates the formation of the planar structure morphology perpendicular to the stretching direction. The zig-zag microfibril was developed at later stage as shown at frame 33. It is believed that the cross-linkages between amorphous and crystallite increases with the development of planar and zig-zag microfibril structure. They would act as a physical cross-linkages and resists the deformation, therefore induced a gradual strain hardening. The gradual increased in the true strain hardening curve from frame 28 onwards until deformation has ceased at frame 36 is shown in Fig. 2(a). The development of planar structure is described by the increase in the radius of gyration as shown in Fig. 3(a). This Figure shows the radius of gyration increases within true strain hardening region.
57
Fig. 3: The force, draw ratio, Rg and FWHM of PLA 4032D drawn at 70oC (a) and the LP of 80oC and (b) with the draw rate of 0,093s-1. First dash line shows the onset of crystallization and the solid line shows the end of draw
The development of crystallite size is shown by the reduction of Full Width at Half Maximum (FWHM) in Fig. 2(b). This Figure shows a large FWHM value at the onset of crystallization that is reduced drastically with the development of true strain hardening and later remained constant after deformation has ceased. This indicates that the hardening process is related to the development of crystallite associated with the formation of zig-zag microfibril and a planar morphology. The crystallisation rate at this temperature determined from relative crystallinity curve is 0.11s-1.
The mechanical behaviour during orientation process is exhibited by a linear increase in the true stress-true strain curve shown in Fig. 2(a). This stress-true stress-stress-true strain curve was calculated from the force and draw ratio shown in Fig. 2(b). The true strain hardening coincides with the increased in the draw ratio and the force after the onset of crystallisation as shown by a small deviation from the linear curve that can be seen around frame 20. It is expected there is only a minimal increased in the true stress due to a weak cross-linkages between amorphous and crystallites.
58
Fig. 4: (a) The WAXS patterns show the formation of Bragg peaks at the onset of crystallization onward, (b) the video images show the drawing at the weaker part and (c) the SAXS pattern shows the formation of kidney-bean SAXS pattern of PLA 4032D sample drawn at 80oC with the draw rate of 0.093s-1
The yielding and necking started around frame 16 or 17, reduces the force and increases the local draw ratio sharply until frame 21 as shown in Fig. 3(b). Within these frames, due to high chain mobility the true stress still exhibited a linear fashion. At this stage, the crystallites form chess-board macro-lattice morphology and the formation lasted very rapidly as shown by drastic changes in the SAXS pattern as shown in Fig. 4(c). At frame 21 onwards, the force increased again with steeper gradient with a constant local draw ratio until the end of deformation, therefore, causing a sharp rise in the true strain hardening after frame 21. A rapid force and sharp rise in true strain hardening are associated with the formation of stacked lamellar structure as shown by two bar SAXS pattern. This causes an increase in the density of cross-linkages between polymer chains and the crystallite, results in a more stronger structure and stops the deformation at the X-ray impact position hence drawn the weaker part above and below the centre. The increased in the density of the cross-linkages probably can be explained from the reduction in the long spacing (LP) within strain hardening region as described in Fig. 3(b).
59 CONCLUSION
The in-situ time-resolved and simultaneous WAXS and SAXS technique utilising brilliance X-rays from synchrotron radiation and force measurement technique was found to able to determine the crystal phase and morphology and their relation to the mechanical behaviour of PLA 4032D at 70oC and 80oC drawn at 0.093s-1
polymorph associated with zig-zag microfibrillar and a planar morphology while a sharp increased was associated with the development of macrolattice of stacked lamellar morphology. The crystallisation rate at 70oC and at 80oC was found to be 0.50s-1 and 0.11s-1, respectively.
ACKNOWLEDGEMENTS
The authors would like to thank the Agency Nuclear Malaysia and the Malaysian Civil Service Department for sponsoring the research degree at Keele University. The thanks also goes to the ESRF for allowing the experiment using high brilliance X-ray source with the time-resolved SAXS and WAXS instruments at ID2 beamline.
REFERENCES
Auras, R., Harte, B. and Selke, S. (2004). "An overview of polylactides as packaging materials."
Macromol Biosci 4(9): 835-64
J. Chem. Phys. 9: 177-184.
Blundell, D. J., Mahendrasingam, A., Martin, C., Fuller, W., MacKerron, D. H., Harvie, J. L., Oldman R. J. and Riekel, C. (2000). "Orientation prior to crystallisation during drawing of poly(ethylene terephthalate)." Polymer 41(21): 7793-7802.
Cakmak, M. and Muligan, J. (2005). "Nonlinear Mechanooptical Behavior of Uniaxially Stretched Poly(lactic acid): Dynamic Phase Behavior." Macromolecules 38(6): 2333-2344.
Cakmak, M. and Martin, C. I. (2005). "Large Deformation Mechano-Optical and Dynamical Phase Behavior in Uniaxially Stretched Poly(ethylene naphthalate)." Macromolecules 38(10): 4260-4273.
Gorlier E., Haudin, J.M. and Billon, N. (2001) Strain-induced crystal-lisation in bulk amorphous PET under uni-axial loading. Polymer,42:9541-9549.
Hughes, D. J., A. Mahendrasingam, C. Martin, W. B. Oatway, E. L. Heeley, S. J. Bingham and W. Fuller (1999). "An instrument for the collection of simultaneous small and wide angle x-ray scattering and stress-strain data during deformation of polymers at high strain rates using synchrotron radiation sources." Polymer 41(10): 4051-4054
Kawakami, D., C. Burger, S. Ran, C.