R E S E A R C H
Open Access
An algorithm to assess methodological quality of
nutrition and mortality cross-sectional surveys:
development and application to surveys
conducted in Darfur, Sudan
Claudine Prudhon
1*, Xavier de Radiguès
1, Nancy Dale
2and Francesco Checchi
3Abstract
Background:Nutrition and mortality surveys are the main tools whereby evidence on the health status of populations affected by disasters and armed conflict is quantified and monitored over time. Several reviews have consistently revealed a lack of rigor in many surveys. We describe an algorithm for analyzing nutritional and mortality survey reports to identify a comprehensive range of errors that may result in sampling, response, or measurement biases and score quality. We apply the algorithm to surveys conducted in Darfur, Sudan.
Methods:We developed an algorithm based on internationally agreed upon methods and best practices. Penalties are attributed for a list of errors, and an overall score is built from the summation of penalties accrued by the survey as a whole. To test the algorithm reproducibility, it was independently applied by three raters on 30 randomly selected survey reports. The algorithm was further applied to more than 100 surveys conducted in Darfur, Sudan.
Results:The Intra Class Correlation coefficient was 0.79 for mortality surveys and 0.78 for nutrition surveys. The overall median quality score and range of about 100 surveys conducted in Darfur were 0.60 (0.12-0.93) and 0.675 (0.23-0.86) for mortality and nutrition surveys, respectively. They varied between the organizations conducting the surveys, with no major trend over time.
Conclusion:Our study suggests that it is possible to systematically assess quality of surveys and reveals considerable problems with the quality of nutritional and particularly mortality surveys conducted in the Darfur crisis.
Introduction
The prevalence of acute malnutrition and mortality rates are crucial indicators to benchmark the severity of a cri-sis, to track trends, and to inform funding and opera-tional decisions [1,2]. Cross-secopera-tional sample surveys are the main method currently used to estimate these indica-tors [3,4]. An adequate sampling design is indispensable to ensure the representativeness and accuracy of a survey. Moreover, standardized field data collection through sui-table interview and measurement instruments and tech-niques is paramount to guarantee quality.
Despite recent improvements in standardization of nutrition and mortality survey methodology and analysis [5-7], errors in the field application of survey methods persist, potentially resulting in biased data and harmful operational decisions. Reviews of surveys carried out in various crisis settings have consistently revealed a lack of rigor in many nutritional [8-12] and most mortality surveys [10,11].
Cross-sectional surveys are generally conducted in relatively small areas corresponding to zones of inter-vention of non-governmental organizations (NGOs); therefore, an overall picture of the situation and its evo-lution at the regional and country level might be diffi-cult to compose. Meta-analyses of mortality and * Correspondence: [email protected]
1Health and Nutrition Tracking Service, Geneva, Switzerland Full list of author information is available at the end of the article
nutrition data can help to infer crisis-wide trends [13]. Given the sparseness of data in most crises, it may be useful to include in the analyses survey reports with lim-ited quality; however, to do this, weighting of surveys according to their relative quality seems necessary. More broadly, monitoring trends in the quality of surveys and the relative frequency of different errors can help to evaluate the strength of evidence on which many huma-nitarian decisions are predicated and fulfill a didactic role in improving field capacity for data collection.
The quality of a survey is determined by five compo-nents; coverage, sampling, nonresponse, measurements, and data processing. Errors could occur with each com-ponent. There are several guidelines for conducting and reporting on surveys in normal conditions published by the United States Office of Management and Budget (OMB) and the American Association for Public Opi-nion Research (AAPOR).
In this article, we describe an algorithm based on sys-tematic and comparable criteria for analyzing nutritional and mortality survey reports to identify a comprehensive range of errors that may result in sampling, response, or measurement biases and score the quality of a survey as a whole. We apply the algorithm to surveys conducted in Darfur, Sudan between 2004 and 2008.
Methodology
Components of the algorithm
The algorithm is based on internationally agreed upon methods and best practices [2,14]. It is divided into seven components of quality checking: 1) selection bias of sampling design; 2) precision of cluster sampling (if done); 3) measurement biases for mortality; 4) measure-ment errors for nutrition; 5) response biases for mortal-ity; 6) analysis errors for mortalmortal-ity; 7) analysis errors for nutrition [[15]; see Additional File 1]. These seven com-ponents are further grouped into three main sections: sample selection, data collection, and data analysis. For each of these, penalties are attributed for a list of possi-ble more or less severe errors, and an overall score is built from the summation of penalties accrued by the survey as a whole. The criteria used are a mix in equiva-lent proportions of genuine errors and of lack of evi-dence of best practice.
Penalties
A Delphi survey was conducted among experts to help determine consensus penalties for each criterion [16]. Experts commented on the algorithm and ranked each criterion from 0, defining a minor problem likely to have a negligible effect on the validity of the survey, to 5, a critical flaw indicating a serious error or an insuffi-cient description that would thoroughly invalidate find-ings. Based on expert recommendations, the algorithm
was refined further. The median penalty attributed by the experts was calculated for each error, and a geo-metric progression (an = a * rn-1, with a = 1, r = 2.34,
and n = 5) was used to rescale penalties to a range from 2 points, corresponding to 1 in the Delphi survey, to 70 points, corresponding to 5.
For nutritional surveys, selection of the sample, data collection, and analysis represented 37%, 31%, and 32% of the maximum possible penalty, respectively, when cluster sampling was used; 25%, 37%, and 38% when systematic random sampling was used; and 20%, 39%, and 41% when simple random sampling was used. For mortality surveys, which are arguably more vulnerable to nonsampling biases, these proportions were 48%, 38%, and 14% when cluster sampling was used; 36%, 46%, and 18% when systematic random sampling was used; and 31%, 50%, and 19% when simple random sam-pling was used.
Overall quality scores
A continuous score, ranging from 0 to 1, is calculated from the sum of the penalties attributed to the survey, as follows:
S = 1−L/T
where S is the score, T the maximum number of pen-alty points a survey can accrue, and L the actual number of penalty points. For example, a score of 0.85 means that only 15% of the maximum penalty points were accrued by this survey. In a combined nutritional-mor-tality survey, the same error can have a different weight in the nutrition score compared to the mortality score; scoring for nutrition and mortality should therefore be interpreted independently.
T was calculated separately for different types of sam-pling design (simple random, systematic random, and cluster sampling), since each carries specific potential errors.
Based on the algorithm, a software application was developed for data entry of quality reviews and auto-matic calculation of scores [17].
Testing of reproducibility
To test the reproducibility of the algorithm, 30 survey reports from Darfur were randomly selected and three expert raters, blinded to one another’s ratings, were asked to apply the algorithm to these surveys. Total penalties for mortality and nutrition surveys were calcu-lated for each rater and the intraclass correlation coeffi-cient was calculated to assess the consistency of rating [19]. Raters also provided their feedback on the use of the algorithm.
Each criterion for which the classification was differ-ent among the raters for more than 20% of the 30 sur-vey reports analyzed was reviewed. Some of these criteria were reformulated to facilitate straightforward interpretation. A criterion about data cleaning procedure was deleted as it seemed impossible to judge with objectivity.
Real-life application
The algorithm was further applied to the entire dataset of surveys from Darfur by one of the raters. Alto-gether, this dataset includes all nutrition and mortality surveys publicly released from the beginning of the cri-sis in 2004 to the end in 2008, and was chosen as it provides a case study of trends in quality across an entire crisis over time. Accordingly, the median and range of quality scores were calculated separately for mortality and nutrition surveys, overall, by year and by agency. Median scores between years and agencies were compared using a Kruskal-Wallis test [19]. The main reasons for critical flaws, main sources of penal-ties, and relative share of penalties by type of error were also computed. Some reports included more than one survey result if several areas or populations had been independently surveyed or if the survey was stra-tified. In this case, each survey result was considered as a separate survey, even if the methodology described in the report applied equally to the different survey strata. Calculation and statistical analyses were per-formed with Microsoft Excel and STATA (Stata Cor-poration, College Station, TX, USA).
Results
One hundred and seventeen survey reports conducted by 19 NGOs and international agencies in Darfur, Sudan between June 2004 and December 2008 were col-lected. Twenty-eight preliminary reports were discarded from the analysis because the methodology was not reported with sufficient detail. In total, 108 mortality surveys and 100 nutrition surveys were analyzed. Of these, 107 mortality surveys and 97 nutrition surveys used cluster sampling, while one mortality and three nutrition surveys were conducted using systematic sampling.
Reproducibility of the algorithm
The algorithm was independently applied by three raters on 30 randomly selected survey reports from 11 NGOs, including 29 mortality surveys and 30 nutri-tion surveys. Of the 108 quality criteria in the algo-rithm, raters disagreed on whether the criterion was fulfilled in more than 50% of the surveys for seven (6.5%) criteria and in 20% to 50% of the surveys for 20 (18.5%) criteria. The Intra Class Correlation coeffi-cient was 0.79 for mortality surveys and 0.78 for nutrition surveys. The three-way average Intra Class Correlation coefficient (the three raters considered as a group of raters rather than as independent raters) was 0.92 and 0.91 for mortality and nutrition surveys, respectively.
Quality of Darfur surveys
Twenty-six mortality survey results (24%) and 13 nutri-tion survey results (13%) featured a critical flaw. Critical flaws were due to unclear description of the first stage sampling of clusters for six mortality surveys and three nutrition surveys, unclear description of household sam-pling in the last stage of cluster samsam-pling for 14 mortal-ity surveys and four nutrition surveys, and to both of these criteria for six mortality and six nutrition surveys. For some of these surveys, the methodology used was not described at all (eight mortality surveys and nine nutrition surveys). For the others, a reference to a guide-line or paper was given (18 mortality surveys and three nutrition surveys) but pointed to the description of sev-eral choices of first or second step cluster sampling, making it impossible for the reader to identify which methodology was used. Most of the surveys with critical flaws were conducted in 2004 (10 mortality and eight nutrition surveys) and 2005 (13 mortality and two nutri-tion surveys).
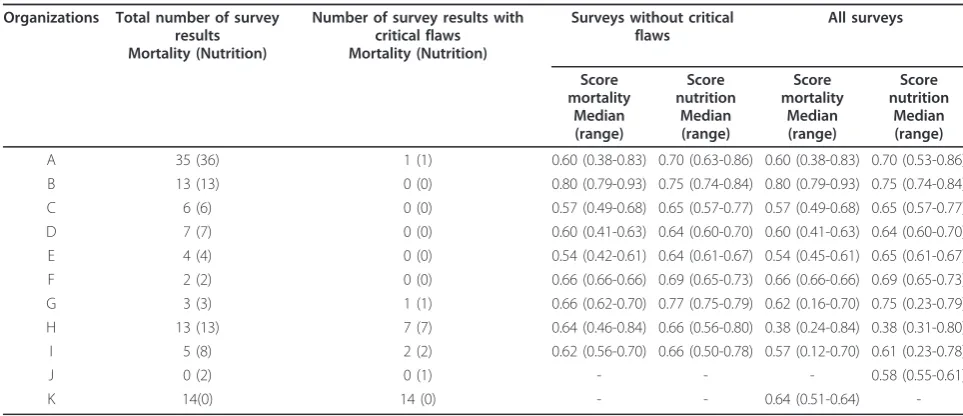
Median scores for mortality and nutrition surveys, excluding surveys with critical flaws, varied among orga-nizations from 0.54 to 0.80 and from 0.63 to 0.75, respectively (Table 1), and were significantly different for both mortality (Kruskal-Wallis Chi-square = 38.86, 13 degrees of freedom [DF], p = 0.0002) and nutrition (Kruskal-Wallis Chi-square = 38.34, 14 DF, p = 0.0005). Median scores among agencies were even more different when surveys with critical flaws were taken into account, varying from 0.38 to 0.80 for mortality surveys (Kruskal-Wallis Chi-square = 43.82, 15 DF, p = 0.0001) and from 0.38 to 0.75 for nutrition surveys (Kruskal-Wallis Chi-square = 44.93, 15 DF, p = 0.0001).
There was no apparent trend in median score for either mortality or nutrition surveys considering the year of survey completion, when surveys with critical flaws were discarded from the analysis (Table 2) (mor-tality: Kruskal-Wallis Chi-square = 0.24, 4 DF, p = 0.99;
nutrition: Kruskal-Wallis Chi-square = 2.65, 4 DF, p = 0.62). Ranges were larger for mortality scores than for nutrition scores for all years. By contrast, when surveys with critical flaws were included in the analysis, differ-ence in median scores among years was borderline sig-nificant (mortality: Kruskal-Wallis Chi-square = 9.38, 4 DF, p = 0.052; nutrition: Kruskal-Wallis Chi-square = 10.97, 4 DF, p = 0.027), especially because of low med-ian scores in 2004.
Around 90% of the penalty points were due to lack of evidence from the survey reports, ranging between 70% to 99% in mortality surveys and between 49% to 100% in nutrition surveys. Of the three sections of the algo-rithm, “data collection”accrued the highest proportion of maximum penalty points for surveys (54% for mortal-ity, 49% for nutrition), while around 30% of maximum penalty points were accrued for the section on“selection of basic sampling.” The least problematic section was “analysis, “ with only about 15% of maximum penalty points accrued.
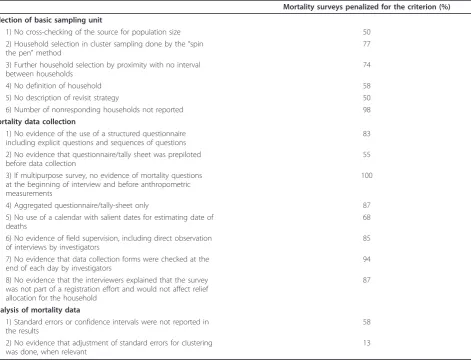
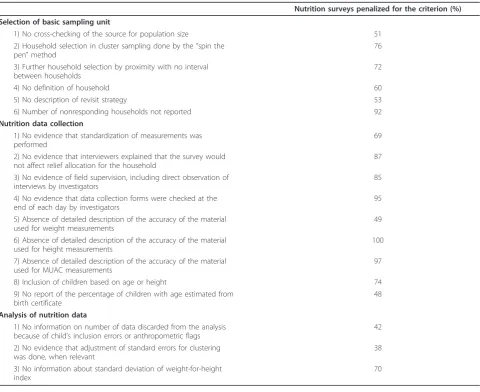
For mortality, the most striking error in data collec-tion procedures was the absence of a structured ques-tionnaire with explicit questions and sequences of questions, which limits standardization and reproduci-bility of interviews among different households for the same interviewer and among interviewers (Table 3). Moreover, most of the time, only aggregated data were collected, precluding a detailed person-time analysis. For nutrition, the major problem of quality of data collec-tion was the absence of detailed descripcollec-tions of the accuracy of the material used for height and mid-upper arm circumference (MUAC) measurements (Table 4). Reports also lacked clarity about on-site supervision and data checking for both mortality and nutrition. The most frequent flaw in the selection of the basic sampling unit for mortality and nutrition surveys was that the number of nonresponding households was not reported.
Discussion
Use of the algorithm and its limitations
The analysis and interpretation of nutrition and mortal-ity data in crisis settings are notoriously challenging tasks. First, the quality of data is often questioned. Sec-ond, the coverage of data is frequently sparse, limiting inference beyond a few sites or time periods for which estimates are available. The algorithm presented in this paper allows for standardization of the assessment of quality of nutrition and mortality surveys according to systematic and comparable criteria.
The algorithm is intended to be used by epidemiolo-gists experienced in nutrition and mortality surveys but without prior training on the algorithm itself. The test of reproducibility that we conducted with three different raters suggested that the algorithm was sufficiently
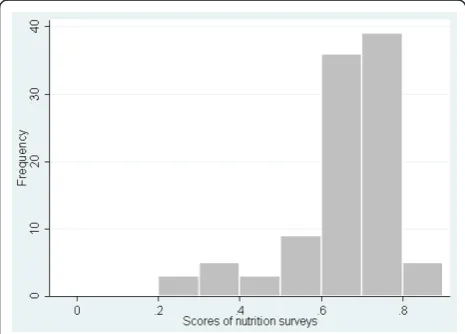
Figure 1Frequency distribution of quality scores for 108 mortality surveys, Darfur, Sudan, June 2004 - December 2008.
reliable to broadly benchmark a given survey’s quality. The three-way average Intra Class Correlation also sug-gested that quite good reliability could be achieved by having two raters per survey. This could be applied to the most difficult surveys and the most critical and sen-sitive situations. Depending on the familiarity with the algorithm, rating of a survey takes between 30 minutes and one hour.
The algorithm can be used to gauge the overall quality of data at the regional or country level. It can also be utilized to assess trends in quality of surveys and the impact of initiatives aimed at improving survey practice. Furthermore, agencies can apply the algorithm to the surveys they perform in order to review their overall quality, investigate their strengths and weaknesses, and take adequate measures to improve major flaws. In this respect, the algorithm could serve as a training tool, but also to help enforce performance targets.
The main limitation of the algorithm is that it is based on information available in the reports, which for most of the criteria may partly reflect the completeness of the report. Because the algorithm generally assumes that a given best practice was not implemented if there is no mention of it in the report, it may be biased towards worst case scenarios, and the quality of some surveys might in fact be better than evaluated through the algo-rithm. However, in the absence of raw data, evaluating the quality of surveys from reports, including the miss-ing information, is the best available proxy for survey quality. The writing of lengthy survey reports might appear cumbersome but is of paramount importance and is inherent to sound epidemiological practices to document procedures and allow others to assess the quality of data. This is part of the epidemiological rigor to thoroughly describe the methodology used in surveys and trials to allow others to evaluate the soundness of
Table 1 Quality scoring of 108 mortality surveys and 100 nutrition surveys by organization (for organizations having conducted more than one survey), Darfur, Sudan, June 2004 - December 2008
Organizations Total number of survey results Mortality (Nutrition)
Number of survey results with critical flaws Mortality (Nutrition)
Surveys without critical flaws
All surveys
Score mortality
Median (range)
Score nutrition
Median (range)
Score mortality
Median (range)
Score nutrition
Median (range)
A 35 (36) 1 (1) 0.60 (0.38-0.83) 0.70 (0.63-0.86) 0.60 (0.38-0.83) 0.70 (0.53-0.86)
B 13 (13) 0 (0) 0.80 (0.79-0.93) 0.75 (0.74-0.84) 0.80 (0.79-0.93) 0.75 (0.74-0.84)
C 6 (6) 0 (0) 0.57 (0.49-0.68) 0.65 (0.57-0.77) 0.57 (0.49-0.68) 0.65 (0.57-0.77)
D 7 (7) 0 (0) 0.60 (0.41-0.63) 0.64 (0.60-0.70) 0.60 (0.41-0.63) 0.64 (0.60-0.70)
E 4 (4) 0 (0) 0.54 (0.42-0.61) 0.64 (0.61-0.67) 0.54 (0.45-0.61) 0.65 (0.61-0.67)
F 2 (2) 0 (0) 0.66 (0.66-0.66) 0.69 (0.65-0.73) 0.66 (0.66-0.66) 0.69 (0.65-0.73)
G 3 (3) 1 (1) 0.66 (0.62-0.70) 0.77 (0.75-0.79) 0.62 (0.16-0.70) 0.75 (0.23-0.79)
H 13 (13) 7 (7) 0.64 (0.46-0.84) 0.66 (0.56-0.80) 0.38 (0.24-0.84) 0.38 (0.31-0.80)
I 5 (8) 2 (2) 0.62 (0.56-0.70) 0.66 (0.50-0.78) 0.57 (0.12-0.70) 0.61 (0.23-0.78)
J 0 (2) 0 (1) - - - 0.58 (0.55-0.61)
K 14(0) 14 (0) - - 0.64 (0.51-0.64)
Table 2 Quality scoring of 108 mortality surveys and 100 nutrition surveys by year, Darfur, Sudan, June 2004 -December 2008
Year Number of
organizations
Total number of survey results Mortality (Nutrition)
Number of survey results with critical flaws Mortality (Nutrition)
Surveys without critical flaws
All surveys
Score mortality
Median (range)
Score nutrition
Median (range)
Score mortality
Median (range)
Score nutrition
Median (range)
2004 9 17 (19) 10 (8) 0.59 (0.46-0.93) 0.67 (0.50-0.84) 0.51 (0.24-0.93) 0.55 (0.28-0.84)
2005 11 39 (29) 13 (2) 0.61 (0.49-0.80) 0.66 (0.56-0.79) 0.64 (0.16-0.80) 0.66 (0.23-0.79)
2006 7 21 (21) 1 (1) 0.61 (0.51-0.83) 0.73 (0.57-0.86) 0.61 (0.38-0.83) 0.73 (0.53-0.86)
2007 5 19 (19) 1 (1) 0.60 (0.42-0.82) 0.71 (0.63-0.77) 0.60 (0.12-0.82) 0.71 (0.23-0.77)
results. Data with established good validity could have a stronger influence on decision-makers and donors. Indeed, the criteria included in the algorithm can be used as a basis for minimum reporting.
As shown in the algorithm, some analysis errors (e.g., lack of weighting or design effect adjustment) can be rectified using raw data; however, these are seldom available. Re-analysis of datasets can also reveal potential quality problems. For example, the Emergency Nutrition Assessment (ENA) software performs a series of plausi-bility and quality checks on anthropometric indices, mainly based on the frequency of outliers and depar-tures from normality, and based on these attributes an overall score to the survey [7]. It could be possible to combine the quality score of our algorithm (which focuses more on methods and procedures) and the qual-ity score of ENA (which focuses on the data) into a summary score of a given nutritional survey.
The precision of survey results was not included in the scoring system because it was not seen as a quality
issue but as an impediment to meaningful interpretation of survey results.
Lastly, our algorithm necessarily relies on arbitrary decisions on the relative gravity of different errors. We have attempted to address this limitation through a Del-phi survey, a standard approach to eliciting expert opi-nions. As the algorithm is adopted for routine practice, penalties for individual errors could be revisited and re-adjusted if necessary.
Quality of surveys in Darfur
Darfur has been one of the major humanitarian opera-tions in the past few years [20]. Our study suggests con-siderable problems with quality of nutritional and particularly mortality surveys conducted in this crisis. In such a highly politicized environment, it is especially crucial that evidence is robust. Poor quality of surveys may have contributed to conflicting estimates of the number of deaths in Darfur in the early period of the crisis [21].
Table 3 Main sources of penalty for 82 mortality surveys, Darfur, Sudan, June 2004 - December 2008
Mortality surveys penalized for the criterion (%)
Selection of basic sampling unit
1) No cross-checking of the source for population size 50
2) Household selection in cluster sampling done by the“spin the pen”method
77
3) Further household selection by proximity with no interval between households
74
4) No definition of household 58
5) No description of revisit strategy 50
6) Number of nonresponding households not reported 98
Mortality data collection
1) No evidence of the use of a structured questionnaire including explicit questions and sequences of questions
83
2) No evidence that questionnaire/tally sheet was prepiloted before data collection
55
3) If multipurpose survey, no evidence of mortality questions at the beginning of interview and before anthropometric measurements
100
4) Aggregated questionnaire/tally-sheet only 87
5) No use of a calendar with salient dates for estimating date of deaths
68
6) No evidence of field supervision, including direct observation of interviews by investigators
85
7) No evidence that data collection forms were checked at the end of each day by investigators
94
8) No evidence that the interviewers explained that the survey was not part of a registration effort and would not affect relief allocation for the household
87
Analysis of mortality data
1) Standard errors or confidence intervals were not reported in the results
58
2) No evidence that adjustment of standard errors for clustering was done, when relevant
Previous reviews conducted in other humanitarian crises of the quality of nutrition and mortality surveys based on survey reports have shown that quality was generally limited [8-12]. One study, however, suggested that the quality of nutrition (but not mortality) surveys conducted between 1993 and 2004 in 17 countries improved over time [11]. Our study also suggests some improvements in quality of mortality and nutrition sur-veys between 2004 and 2008. However, this might be due to the fact that the two agencies that contributed to the majority of surveys with critical flaws only con-ducted surveys in 2004 and 2005. When surveys with critical flaws were removed from the analysis, no differ-ence was eviddiffer-enced.
The proportion of critical flaws appeared high, espe-cially for mortality surveys. However, it is possible that some of the 16% of mortality surveys that, instead of clearly describing methodology, provided a reference for methodology of first and second stage cluster sampling,
were actually conducted adequately. They had overall no more errors than surveys without critical flaws.
There were obvious differences in median score among agencies for both mortality and nutrition surveys. The same discrepancy was shown in a paper analyzing survey quality from 1993 to 2004 [11], suggesting that international initiatives have failed to improve uniformly survey quality across agencies.
The release of manuals on nutrition and mortality sur-vey methodology [2,14] and the development of user-friendly tools to analyze nutrition and mortality surveys [7] have probably contributed to the standardization of survey methodology and improvement of data analysis. Our reading of multiple survey reports, however, sug-gested that these tools are sometimes used in a simplis-tic way with no understanding of the underlying epidemiology principles. Training initiatives on survey methodology have recently intensified and are the best way to improve survey quality. Training should not only
Table 4 Main sources of penalty for 87 nutrition surveys, Darfur, Sudan, June 2004 - December 2008
Nutrition surveys penalized for the criterion (%)
Selection of basic sampling unit
1) No cross-checking of the source for population size 51
2) Household selection in cluster sampling done by the“spin the pen”method
76
3) Further household selection by proximity with no interval between households
72
4) No definition of household 60
5) No description of revisit strategy 53
6) Number of nonresponding households not reported 92
Nutrition data collection
1) No evidence that standardization of measurements was performed
69
2) No evidence that interviewers explained that the survey would not affect relief allocation for the household
87
3) No evidence of field supervision, including direct observation of interviews by investigators
85
4) No evidence that data collection forms were checked at the end of each day by investigators
95
5) Absence of detailed description of the accuracy of the material used for weight measurements
49
6) Absence of detailed description of the accuracy of the material used for height measurements
100
7) Absence of detailed description of the accuracy of the material used for MUAC measurements
97
8) Inclusion of children based on age or height 74
9) No report of the percentage of children with age estimated from birth certificate
48
Analysis of nutrition data
1) No information on number of data discarded from the analysis because of child’s inclusion errors or anthropometric flags
42
2) No evidence that adjustment of standard errors for clustering was done, when relevant
38
3) No information about standard deviation of weight-for-height index
include the “how” to conduct a survey but also the “why,“ i.e., basic principles in epidemiology and statis-tics. This would increase survey investigators’ under-standing of the rules governing survey methodology and analysis of data. A better knowledge of epidemiology principles should also be promoted among policymakers to guide more rational commissioning of surveys and allocation of resources based on correct interpretation of findings.
Conclusion
Our study suggests that it is possible to systematically assess quality of surveys and reveals considerable pro-blems with the quality of nutritional and particularly mortality surveys conducted in the Darfur crisis. Improving survey quality will strengthen the evidence-based funding and operational decisions.
Additional material
Additional file 1: Additional file1shows the algorithm for checking the quality of mortality and nutrition surveys.
Acknowledgements
We would like to acknowledge the members of the Health and Nutrition Tracking Service’s Steering Committee and Expert Reference Group (Oleg Biloukha, Rebecca Grais, Yves Martin-Prevel, Carlos Navarro Colorado, Jon Petersen, and Bradley Woodruff) who provided comments and feedback on the algorithm, as well as Bridget Fenn and Catherine Sprecher-Bachy who piloted the algorithm and software application.
FC and ND were funded by a consultancy agreement from the Health and Nutrition Tracking Service. FC received further salary support from the World Health Organization and from an AXA Research Fund post-doctoral fellowship. CP and XdR received salary support from the Health and Nutrition Tracking Service. The main donors of the Health and Nutrition Tracking Service are the department of Humanitarian Aid and Civil Protection (ECHO) of the European Commission and the United States Agency for International Development (USAID). No funding bodies had any role in the study design, data collection and analysis, decision to publish, or preparation of the manuscript.
Author details 1
Health and Nutrition Tracking Service, Geneva, Switzerland.2Department of International Health, University of Tampere, Finland.3Faculty of Infectious and Tropical Diseases, London School of Hygiene &Tropical Medicine, London, UK.
Authors’contributions
All authors read and approved the final manuscript and agreed with the manuscript’s results and conclusions. CP, XdR and FC designed the study. CP analyzed the data. CP, XdR, and ND participated in the collection of the data and did experiments for the study. CP wrote the first draft of the paper and all authors revised the manuscript.
Competing interests
The authors declare that they have no competing interests.
Received: 17 May 2011 Accepted: 9 November 2011 Published: 9 November 2011
References
1. The Sphere Project:Humanitarian charter and minimum standards in disaster responseGeneva: The Sphere Project.; 2004.
2. SMART:Measuring mortality, nutritional status, and food security in crisis situations: SMART methodology, version 1.[http://www.
smartmethodology.org/images/stories/SMART_Methodology_08-07-2006. pdf], Accessed December 1, 2010.
3. Bostoen K, Bilukha O, Fenn B,et al:Methods for health surveys in difficult settings: charting progress, moving forward.ETE2007,4:13.
4. Checchi F, Roberts L:Documenting Mortality in Crises: What Keeps Us from Doing Better?PLoS Med2008,5(7):e146.
5. Salama P, Spiegel P, Talley L,et al:Lessons learned from complex emergencies over past decade.Lancet2004,364:1801-1813. 6. Young H, Borrel A, Holland D,et al:Public nutrition in complex
emergencies.Lancet2004,364:1899-1909.
7. ENA; software for Emergency Nutrition Assessment.[http://www. nutrisurvey.net/ena/ena.html], Accessed December 1, 2010. 8. Boss LP, Toole MJ, Yip R:Assessments of mortality, morbidity, and
nutritional status in Somalia during the 1991-1992 famine.JAMA1994, 272:371-376.
9. Garfield R:Studies on young child malnutrition in Iraq.Nutr Rev2000, 58:269-277.
10. Grais FR, Luquero FJ, Grellety E,et al:Learning lessons from field surveys in humanitarian contexts: a case study of field surveys conducted in North Kivu, DRC 2006-2008.Conflict and Health2009,3:8.
11. Prudhon C, Spiegel PB:A review of methodology and analysis of nutrition and mortality surveys conducted in humanitarian emergencies from October 1993 to April 2004.ETE2007,4:10.
12. Spiegel PB, Salama P, Maloney S,et al:Quality of malnutrition assessment surveys conducted during famine in Ethiopia.JAMA2004,292:613-618. 13. Degomme O, Guha-Sapir D:Patterns of mortality rates in Darfur conflict.
Lancet2010,375:294-300.
14. World Food Programme/Center for Disease Control and Prevention:A Manual: Measuring and Interpreting Malnutrition and MortalityRome: WFP; 2005.
15. Health and Nutrition Tracking Service:Algorithm for quality checking of mortality and nutrition surveys.[http://www.thehnts.org/en/27], Accessed December 1, 2010.
16. Hsu CC, Sandford BA:The Delphi Technique: Making Sense Of Consensus.Practical Assessment, Research and Evaluation2007,12:10. 17. Health and Nutrition Tracking Service:Surveys, a spreadsheet application
for data entry and automatic analysis of nutrition and mortality surveys, and quality scoring.[http://www.thehnts.org/en/27], Accessed December 1, 2010.
18. Nielsen J:Trends in malnutrition and mortality in Darfur, Sudan, between 2004 and 2008: a meta-analysis of publicly available surveys.2011, 40(4):971-984.
19. Armitage P, Berry G:Statistical methods in medical research.Third edition. Oxford: Blackwell Science; 1994.
20. Moszynski P:Violence in Darfur region is jeopardizing world’s largest aid operation.BMJ2006,333:319.
21. GAO:Report to congressional requesters. Darfur crisis- Death estimates demonstrate severity of crisis, but their accuracy and credibility could be enhanced.2006 [http://www.gao.gov/new.items/d0724.pdf], Accessed December 1, 2010.
doi:10.1186/1478-7954-9-57
Cite this article as:Prudhonet al.:An algorithm to assess