Experimental Analysis of Flexural Behaviour
and Crack Pattern of RCC Composite Beam
Mita Ann Zachariah Sunitha A Daniel
PG Student Assistant Professor Department of Civil Engineering Department of Civil Engineering
Saintgits College of Engineering, Kottayam, Kerala, India Saintgits College of Engineering, Kottayam, Kerala, India
Abstract
In recent days the problem faced by the construction industry is acute shortage of raw materials. We have responsibility to reduce the effect the application of concrete materials to environmental impact. The concrete should be used as efficiently as much as possible. In structural design, an ideal situation in material saving is to reduce the weight of the structure without having to compromise on its strength and serviceability. Partial replacement of the concrete below the neutral axis is an idea that can create reduction in weight and savings in materials. In this paper, an experimental investigation is on partial replacement of concrete below the neutral axis by placing bricks with spacing and without spacing. Specimens of solid RC beams and two composite beams with different variations are casted and tested under two-point flexure loading. The results of Load deflection relationship, Load strain relationship, first crack, Ultimate load, concrete saving and reduction of Self weight of the beam are compared and effects are studied.
Keywords: Composite Beam, Neutral Axis, Light Weight Material, Self-Weight, Mix Design, Crack Pattern
________________________________________________________________________________________________________
I. INTRODUCTION
Reinforced cement concrete is one of the important component in the construction industry. Now a days, the use of concrete increased very much. In this paper an attempt is made for reduction of concrete and self-weight of the beam by replacing the concrete below neutral axis. However, concrete have low tensile strength and when a concrete member is subjected to flexure, the region under the neutral axis of the cross-section is considered ineffective when it is in tension at ultimate limit states. The behaviour of brick and RCC composite beams is same to that of reinforced concrete beams. Therefore, bricks are used within the un-utilized area. Steel bars are good for tension, so placing steel bars at bottom of beams will resist the tensile bending stresses and also overcome the tensile weakness of the bricks. It should be noted that the bonding between the steel bar, brick and concrete should be good for avoiding the slip between them. In this study by reducing weight of the beam and saving quantity of concrete by saving cement reduced the greenhouse gasses emissions. So it is environmental friendly.
II. LITERATURE REVIEW
Table – 1 Literature Review
Author Year Summary
Piyush Kumar et. al., 2015 Conducted a study carried out on Crack Pattern of RCC and RCC Composite Beams. S. Aswathy Kumar et
al., 2015
An experimental investigation on partial replacement of concrete below the neutral axis by creating air voids using polythene balls is discussed.
R Prabhakara et. al., 2015 Studied the flexural behaviour of the normal beam and steel composite beam with different configurations of steel.
B S Karthik et al., 2014 Compared the behaviour of the beam with partially replaced beam of different grades of concrete below and above the neutral axis.
Dubey S. K et. al., 2012 By the method of initial functions, it analyzed that behaviour of reinforced concrete brick-filled beams is similar to that of reinforced concrete beams.
W. Godwin
Jesudhason et al., 2013
Studied on replacing the portion below the neutral axis of the beam with expanded polystyrene sheet (EPS). In this the flexural behaviour of beams are studied.
III. SIGNIFICANCE OF THE WORK
Objectives of the Project
Methodology of the work consists of – Testing of materials
– Selection of proper grade and mix design of M20 – Test on Fresh concrete and Hardened concrete – Design of beam
– Casting, curing and testing of beams – Result comparison
IV. MATERIAL TEST
Table – 2 Material Test
Test Material Equipment Used Values Obtained
Cement Specific Gravity Le Chateliers Flask 3.2
Cement Consistency Test Vicat Apparatus 34
Fine Aggregate Specific Gravity Pycnometer 2.96
Coarse Aggregate Specific Gravity Wire Basket 2.92
Coarse Aggregate Crushing Value Cylindrical Measure And Plunger 32.58%
Coarse Aggregate Water Absorption Test Vessel 10%
Brick Water Absorption Test Vessel 12.3%
V. MIX DESIGN
Table - 3
Design mix proportion of M20 mix (1 m3 of concrete)
Cement (kg/m3) Fine Aggregate (kg/m3) Coarse Aggregate (kg/m3) Water- Cement Ratio Mix Ratio
415.12 641.52 1350.65 0.47 1:1.55:3.25
VI. EXPERIMENTAL INVESTIGATION
Three specimens were casted and tested. Three of these experimental specimens were singly reinforced concrete beams with variation parameters i.e.
– Control Beam
– Beam with bricks are placed below the neutral axis without spacing – Beam with bricks are placed below the neutral axis with spacing.
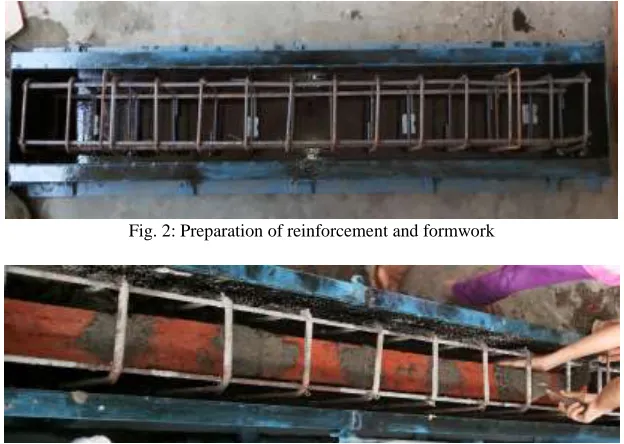
Fig. 2: Preparation of reinforcement and formwork
Fig. 3: Casting of beam with bricks are placed below the neutral axis without spacing
Fig. 4: Casting of beam with bricks are placed below the neutral axis with spacing Test Procedure
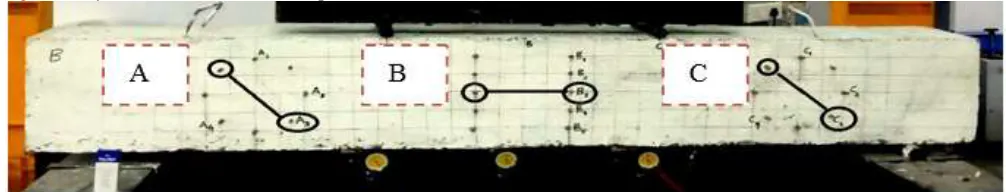
The flexural strength of the specimens was tested using a 50T loading frame. The effective span of the test specimen was taken as 1800mm which achieved by using cast iron support. The flexural strength of the beam is done as Two Point loading using the jack attached to the loading frame. The behavior of beam is keenly observed from beginning to the failure. The loading was stopped when the beam was just on the verge of collapse. The first crack propagation and its development and propagation are observed keenly. The values of load applied, strain and deflection are noted directly and further the plot of load vs. deflection is performed which is taken as the output. The load in ton was applied with uniformly increasing the value of the load and the strain and deflection under the different applied loads have been noted down. The applied load increased up to the breaking point or till the failure of the material.
Fig. 5: Combined graph of Load Vs Deflection at point A Fig. 6: Combined graph of Load Vs Deflection at point B
Fig. 7: Combined graph of Load Vs Deflection at point C
On comparison of load deflection graph of all three beams at right support (Point A) Fig 5, shows linear deflection curve upto 5T of load. Composite Beam B shows more deflection compared to other two beams and beam A and C have similar curve pattern. For the load deflection behaviour of centre point Fig 6, shows linear deflection pattern proportional to increase in load till 5T. Here composite Beam B and C have more deflection compared to the Beam A. Similarly, Fig 8.6 shows same curve pattern for Beam B and Beam C for the load deflection pattern at left hand support. Linearity of curve is till the 4.5T load. Here composite Beam B and C have more deflection compared to the Beam A.
From all three graphs it is clear that normal beam and composite beam has got similar load deflection behaviour. Therefore composite beams can be preferred.
Load vs. Strain Behaviour
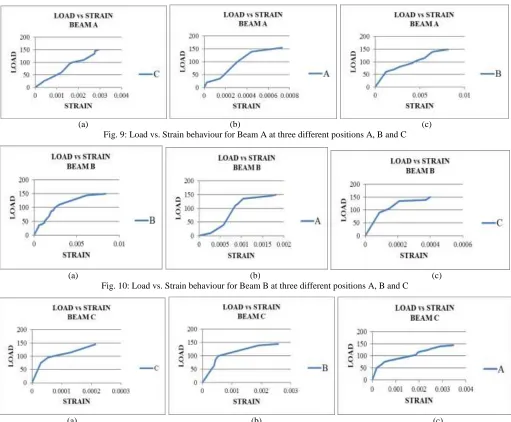
(a) (b) (c) Fig. 9: Load vs. Strain behaviour for Beam A at three different positions A, B and C
(a) (b) (c) Fig. 10: Load vs. Strain behaviour for Beam B at three different positions A, B and C
(a) (b) (c) Fig. 11: Load vs. Strain behaviour for Beam C at three different positions A, B and C
First Crack Load and Ultimate load
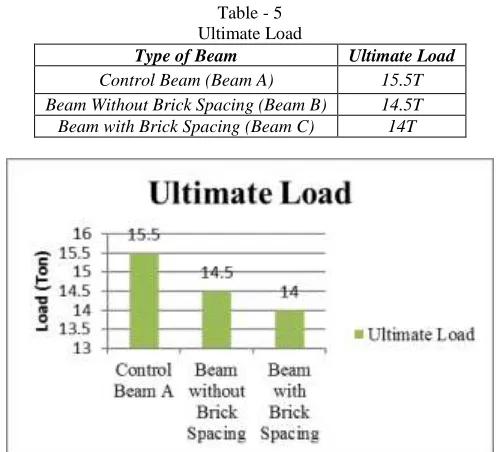
Ultimate strength of beams under Two-point flexural test was confirmed through recording the maximum load indicated by load dial, but the cracking load was specified with developing the first crack on the concrete. It was found that there is not much difference in the load carrying capacity of solid control beam section and that of beam section with bricks on neutral axis. The comparison of First Crack and Ultimate Load results between the solid control beam and beams with bricks below neutral axis is shown in graphs.
Table - 4 First Crack
Type of Beam First Crack
Control Beam (Beam A) 5.5t
Fig. 12: Graphical Representation of First Crack Load Table - 5
Ultimate Load
Type of Beam Ultimate Load
Control Beam (Beam A) 15.5T
Beam Without Brick Spacing (Beam B) 14.5T Beam with Brick Spacing (Beam C) 14T
Fig. 13: Graphical Representation of Ultimate Load
Crack Pattern
The initial cracks were occurred at about 15% to 30% of the ultimate load. It was noticed that first crack always appeared close to the midspan of the beam. The most of the cracks are being seen at point L/3 and 2L/3 where load is also applied and small cracks appear near L/3 and 5L/6 of beams for both RCC and composite beams. All the beams of composite shows large deflection and cracks with respect to the RCC beam.
Concrete Saving
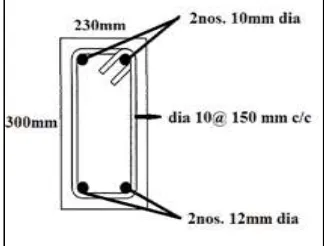
If we consider the beam in this study, the dimensions are of length = 2m, breadth = 0.23m and depth = 0.3m with brick having length = 0.19m, breadth =0.09m and depth = 0.06m.
Table - 6
Calculation of reduction of concrete
Type of Specimen Volume of Beam % Of Reduction of Concrete ( 𝑽𝟐
𝑽𝟏* 100)
Control Beam 0.138cu.m
Specimen with Brick Without Spacing Below Neutral Axis 0.014364cu.m 10.4%
Specimen with Brick with Spacing Below Neutral Axis 0.01026cu.m 7.43%
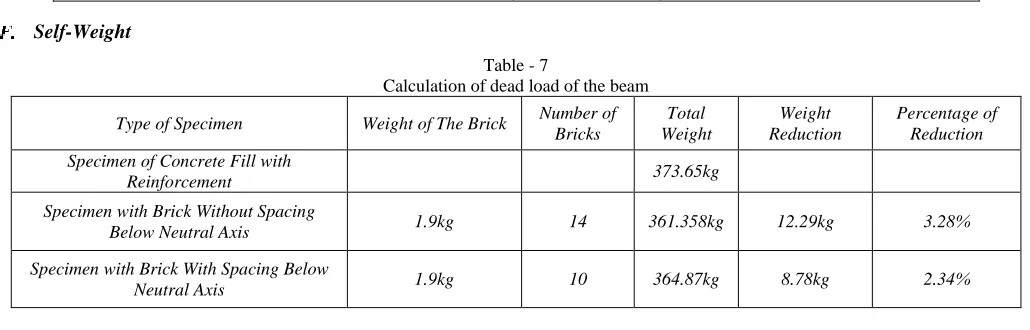
Self-Weight
Table - 7
Calculation of dead load of the beam Type of Specimen Weight of The Brick Number of
Bricks Total Weight Weight Reduction Percentage of Reduction Specimen of Concrete Fill with
Reinforcement 373.65kg
Specimen with Brick Without Spacing
Below Neutral Axis 1.9kg 14 361.358kg 12.29kg 3.28%
Specimen with Brick With Spacing Below
Neutral Axis 1.9kg 10 364.87kg 8.78kg 2.34%
VIII. CONCLUSIONS
Based on the experimental study for the flexural behaviour of the beam with composite beams, the results obtained are concluded as:
1) Flexural behaviour of the composite beam having bricks below the neutral axis shows very close resemblances to the conventional beam.
2) Composite beam has withstood the same quantity of load as like the normal beam. 3) Composite beam without spacing for bricks have saved 10.4% of concrete in casting. 4) Similarly, Composite beam with spacing for bricks have saved 7.43% of concrete in casting. 5) Self weight of the composite beam got reduced 3.28% for brick without spacing.
6) Similarly, Self weight of the composite beam got reduced 2.34% for brick with spacing.
Thus, behaviour of composite beams has shown similar strength and characterstics to that of reinforced concrete beams. Therefore, Brick reinforced concrete beams can be used for sustainable and environment friendly construction work as it reduces the consumption of cement and also reduces the dead load.
Scope for Future Study
Further investigations can be carried out by placing bricks only on neutral axis. Comparative study can be done by keeping different size of bricks in vertically and their flexural and shear can be evaluated. Several other parameters can be tested like impact resistance, abrasion, crack width etc. It can also be studied analytically using software using ANSYS. The work can be extended in other mixes also.
REFERENCES
[1] Piyush Kumar and Mr. R.D. Patel., 2015,“ Comparative Study on Crack Pattern of RCC and Brick & RCC Composite Beams, IJSRD - International Journal for Scientific Research & Development| Vol. 3(6), pp.2321-223.
[2] Patel Rakesh, Dubey S. K and Pathak K.K.., 2012, “Brick filled reinforced concrete composite beams, IJEAT International Journal of Advanced Engineering Technology| Vol.3/ 2 124-126.
[3] Piyush Kumar and Mr. R.D. Patel, 2015, “Brick filled reinforced concrete composite beams “IJSETR International Journal of Scientific Engineering and Technology Research, Vol.04,Issue.10, Pages:1923-1925.
[4] K.Vinayaki and R.Theenathayalan, 2015,” Experimental and analytical study on flexural behaviour of concrete filled GFRP Box Beams, International Journal of Science and Engineering Applications Vol 4 Issue 3, ISSN-2319-7560
[5] B S Karthik, Dr.H.Eramma & Madhukaran (2014), ―Behaviour of Concrete Grade Variation in Tension and Compression Zones of RCC Beams,International Journal of Advanced Technology in Engineering and Science, Volume No.02, Issue No. 07, ISSN 2348– 7550 July
[6] Jain Joy and Rajesh Rajeev (2014)—Effect of Reinforced Concrete Beam with Hollow Neutral Axis, International Journal For Scientific Research And Development (2014), volume3, November.
[7] Ade S. Wahyuni, Hamid Nikraz, and Vanissorn Vimonsatit (2012), ―Reinforced Concrete Beams With Lightweight Concrete Infill, Scientific Research and Essays Vol. 7(27), pp. 2370-2379, 19 July, ISSN 1992-2248.