Michael I Chen. User-Enacted Determinants of Presence: Sound Effects and Feedback in Multiplayer Console Gameplay. A Master’s Paper for the M.S. in I.S. degree. August, 2016. 116 pages. Advisor: Brian W. Sturm
A 1 x 2 multivariate analysis of covariance was conducted to assess the influence of auditory feedback on presence in Super Smash Bros. Brawl. 41 participants were assigned to a gameplay treatment condition of muted audio or sound effects only. Dependent variables were measured by the Self-Assessment Manikin, ITC-Sense of Presence Inventory, and Temple Presence Inventory. Covariates included familiarity with controls, visuospatial working memory, the Immersive Tendencies Questionnaire, recent gameplay experience, computer opponent difficulty level, age, sex, and handedness. A significant multivariate effect of treatment condition was observed, but further results were inconclusive. Possible explanations and reliability analyses are discussed.
Headings: Presence Immersion Video games Console gaming Working memory
USER-ENACTED DETERMINANTS OF PRESENCE:
SOUND EFFECTS AND FEEDBACK IN MULTIPLAYER CONSOLE GAMEPLAY
by Michael I Chen
A Master’s paper submitted to the faculty of the School of Information and Library Science of the University of North Carolina at Chapel Hill
in partial fulfillment of the requirements for the degree of Master of Science in
Information Science.
Chapel Hill, North Carolina August 2016
Approved by
Table of Contents
Introduction ... 3
What is Presence? ... 4
Definitional Issues ... 4
Typology and Definitions ... 5
Layers of Presence: The Bio-Cultural Approach ... 7
Conceptualizing Presence in Console Gaming ... 12
Presence in Gameplay ... 13
Determinants of Presence in Gaming ... 14
Performance feedback. ... 18
Working memory and presence. ... 19
The Problem and Goal ... 23
The Game ... 26
Types of Performance Feedback in Super Smash Bros. Brawl ... 28
The Manipulation: Sound Effects ... 30
Methods... 31
Measurements ... 31
Presence measurements. ... 31
Covariate measurements. ... 33
Other Materials ... 38
Procedure ... 40
Participants ... 41
Results ... 43
Hypotheses ... 43
Main Analyses ... 44
Comparison of Reliability of Similar Dependent Measures ... 56
Free-Response Comments ... 60
Discussion ... 61
Main Hypotheses ... 61
Other issues with instruments. ... 64
Concluding Remarks ... 65
References ... 67
Appendix A – Questionnaire ... 89
Appendix B – Consent Form ... 105
Appendix C – Visuospatial Working Memory Task Instruction Sheet ... 106
Appendix D – Standard Procedure ... 108
Introduction
Different ontologies, approaches, disciplines, domains, assumptions – they all converge when it comes to studying presence. Related fields include psychology and cognitive science, computer science and virtual reality (VR), games studies and ludology, anthropology and folklore, game design and user experience, human-computer
What is Presence?
Definitional Issues
Basically speaking, presence is “a psychological state in which the virtuality of experience is unnoticed" (Lee, 2004, p. 32). But, in a surface examination of the literature on presence, it is obvious that definitional issues abound (Brockmyer et al., 2009;
Darken, Bernatovich, Lawson, & Peterson, 1999; Grimshaw, Charlton, & Jagger, 2011; Mantovani & Riva, 1999; McCreery, Schrader, Krach, & Boone, 2013; Nacke & Lindley, 2008; Slater, 1999; Slater, 2003; Waterworth & Waterworth, 2003; Zahorik & Jenison, 1998). Various proposals for standardizing the vocabulary used in presence research have been made (Lee, 2004; Mantovani & Riva, 1999; Slater, 2003; Waterworth &
Waterworth, 2003; Zahorik & Jenison, 1998), though even if a good controlled vocabulary exists, it must be adopted by researchers to serve as an actual standard.
use immersion to describe features of the VR system. For example, does the system offer haptic feedback? Does it track both eye and head movements? Is there a surround sound system, or are only over-the-ear headphones used? By and large, many VR systems attempt to simulate a reality with high fidelity, which is less often the case for video and computer games. So, for VR researchers, a system’s immersion are the features offered; ergo, a system is immersive if it offers such features while presence is a user’s reaction to them (Slater, 2003).
Typology and Definitions
Lee (2004) presents a comprehensive typology of human experience that
reconciles conundrums of terminology in the field of presence research. Moreover, Lee’s (2004) account is also able to account for the experience of presence in media such as books, film (Schubert & Crusius, 2002), or narrative performance (Busselle & Bilandzic, 2009; Sturm, 2000), which do not allow the user to actively modify the mediated
environment, in addition to other “low-tech” virtual environments, such as text-based online games (Schiano, 1999; Towell & Towell, 1997; Voiskounsky, Mitina, &
Avetisova, 2004). Indeed, according to McCreery et al., (2013), “Lee (2004) provides the most inclusive conceptualization” (p. 1636). Therefore, Lee’s (2004) typology provides primary guidance for this research and delineates key definitions.
Lee (2004) more precisely defines presence as “a psychological state in which virtual (para-authentic or artificial) objects are experienced as actual objects in either sensory or [non-sensory] ways” (p. 37). That is to say, when presence happens, the virtual experience merges with real experience. Sensation, which “is triggered by some
from perception, which “includes a conception of an object or a relationship that is being perceived, plus the immediate and irresistible conviction of the existence of objects or a spatial organization” (Coren, 2003, p. 88). More simply, sensation is the process of sensing while perception is the interpretation of such. When complete presence is experienced, it is perceived.
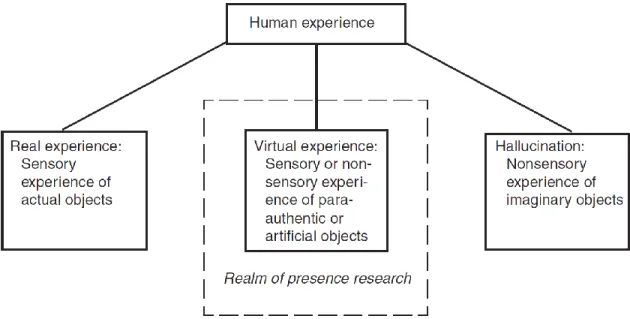
Here (Lee, 2004), “[v]irtual experience is the sensory or [non-sensory] experience of virtual (either para-authentic or artificial) objects” (p. 37). More granularly, a virtual object can be para-authentic or artificial. An artificial object has no “authentic connection to actual objects” (p. 35) while a para-authentic object “holds some kind of valid
connection with the actual object that it represents” (p. 34). Further, virtual experience is encompassed in three domains: physical, social, and self. These ideas are contextualized in Figure 1, which graphically represents Lee’s (2004) typology of human experience, and further in Figure 2, which focuses on the typology of human virtual experience, which is the concern of presence research.
Figure 2. Typology of virtual experience (Lee, 2004, p. 41). Layers of Presence: The Bio-Cultural Approach
of presence is presented here as well, as it is akin to Marr’s (1982) intentional and representational levels of theory.
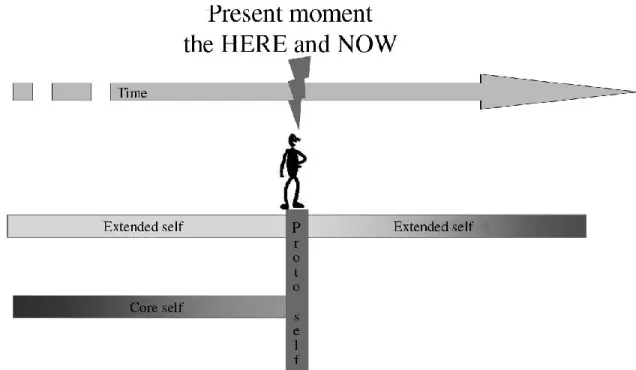
According to Riva et al. (2004), presence is a layered psychological experience that evolved because it was adaptive to survival. First, three layers of self (Damasio, as cited in Riva et al. 2004) and consciousness are laid out: proto, core, and extended self (or consciousness). The proto self is cognizant of the present moment; the core self integrates the present with past experience; and the extended may potentially transcend both the past and a hypothetical future. Arising from these three layers are three
analogous layers of presence:
Proto presence – The proto self is proposed to have evolved “[t]o predict the
characteristics of the external world as it is experienced through sensorial inputs” (p. 406). Accordingly, the sense of presence that is possessed by the proto self is proto presence, which is defined as “an embodied presence related to the level of perception-action coupling (self vs. non-self)” (p. 406-407). Since proto presence “is based on proprioception and other ways of knowing bodily orientation in the world” (Riva, Waterworth, Waterworth, & Mantovani, 2011, p. 30), it allows an organism to distinguish between what constitutes its self and what does not.
Core presence – The evolutionary goal of the core self is to integrate “specific
sensory occurrences into single precepts” (Riva et al., 2004, p. 407).
Extended presence – The role of extended presence is to verify the relevance of
possible and future events and to assess the significance of events experienced in the real world to survival, broadly speaking (Riva et al., 2004; Riva et al., 2011). Because extended consciousness involves tracking goal states and hypothetical events, it relies crucially on working memory (Damasio, as cited in Riva et al., 2004). In addition, extended presence “requires intellectually and/or emotionally significant content” (p. 411). When extended consciousness is concerned with one thing but proto and core consciousness are attending to another, absence of mind arises (Riva et al., 2004).
Figure 3 illustrates Riva et al.’s (2004) conceptualization of the three layers of consciousness with respect to time, while Figure 4 summarizes their model and indicates that presence is optimized when all three layers of consciousness are simultaneously directed at the same point of focus.
Figure 4. Layers, media, and mental states (Riva et al., 2004, p. 413).
Here, consciousness is type-independent; that is to say, all three layers of consciousness are involved in the perception of all three domains of human experience, as outlined by Lee (2004). Consciousness becomes presence when it deals with virtual experience. Interestingly, to the extent that dreams may be treated as virtual
Conceptualizing Presence in Console Gaming
This study is concerned with user-enacted determinants of the phenomenon of presence console gaming. The following section will situate console gameplay under the theoretical frameworks described above.
As of 2016, the current three most popular developers of game consoles – Microsoft (Xbox series), Nintendo (Wii-U, most recently as of 2016), and Sony
(PlayStation series) – released online console gaming capabilities within the last twenty years. Xbox live became available for the original Xbox in 2002 (James, 2015); Nintendo first launched its Nintendo Wi-Fi Connection in 2005 (Machkovech, 2015); Sony
released its PlayStation Network in 2006 (Arce, 2015).
In contrast to many VR systems, console gaming systems often make no attempt to make invisible the hardware of mediation. Only in limited cases, such as the Wii-mote of the Nintendo Wii, is proprioception even a salient factor. Therefore, console games tend to elicit low levels of proto presence. However, according to the bio-cultural
approach described above, “if presence is really an evolved psychological mechanism, it should exist independently of a given medium” (Riva et al., 2004, p. 412). Indeed, evidence of presence has been confirmed in a variety of media:
Storytelling (Busselle & Bilandzic, 2009; Stallings, 1988; Sturm, 1999; 2000)
Novels and other text (Schubert & Crusius, 2002)
VR systems (Malbos, Rapee, & Kavakli, 2012; Mikropoulos, Tzimas, & Dimou, 2004; Pausch, Proffitt, & Williams, 1997; Slater & Usoh, 1993)
Film (referred to in film theory as the diegetic effect, Burch, 1982)
Text-based multi-user domains/dungeons (Schiano, 1999; Towell & Towell, 1997)
As it stands, both immersive VR systems and games played on console platforms (as well as other media described above) may be characterized as virtual environments. VR and most console games are similar in that they generally afford user interaction with the virtual environment. Consequently, to the extent that both VR systems and console gameworlds are virtual environments through which technology mediates virtual experience, and to the extent that presence arises out of consciousness, many of the findings from research on presence in VR systems should be generalizable to console gameplay as well.
Presence in Gameplay
Presence is often simply defined as a sense of ‘being there’ in a virtual
environment (e.g., Heeter, 1992; IJsselsteijn et al., 2000; Sheridan, 1994). This idea is salient in virtual reality, where a user may literally be inside a rendered environment (Tougaw & Will, 2003), as in the case of the cave automatic virtual environment, a type of immersive virtual reality environment made up of three (Cruz-Neira, Sandin, &
DeFanti, 1993) to six walls (Cruz-Neira et al., 1993), inside which the human user stands. But in non-immersive virtual environments, the converse gains saliency. Presence
dimensions of presence; in some cases, the sense of departure may even be more pronounced than the sense of arrival (Kim & Biocca, 1997). According to Schubert, Friedmann, & Regenbrecht (2001), construction of a mental model for the virtual environment (as in arrival) and suppression of stimuli from the real world (as in
departure) “go hand in hand. Both processes are active processes, which must be learned and may break down under overload” (p. 268).
Using a grounded theory approach, Brown & Cairns (2004) asked gamers what immersion was like for them. Their findings suggest that presence is a gradual
phenomenon that progresses sequentially from a feeling of engagement (an interest in the game and a desire to keep playing) to engrossment (engagement, accompanied by an emotional investment and a sense of departure) before “total immersion”, which is akin to presence. These findings are roughly consistent with Riva and colleagues’ (2004) model, in which “emotional processes directly influence … core presence and extended
presence” (p. 409).
Determinants of Presence in Gaming
According to Riva et al. (2004), “proto presence is determined only by form, core presence by both form and content, and extended presence only by content” (p. 413). To evoke proto presence, the technology that constitutes form tends to impose greater technical demands. As such, console game systems would ostensibly elicit presence by engaging extended consciousness and core consciousness, which is the pivot for
example, Ermi and Mäyrä’s (2005) gameplay experience model identifies sensory, challenge-based, and imaginative immersion.
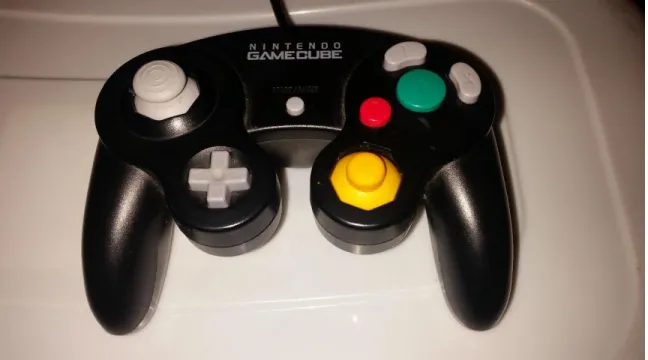
In regards to form, the most traditional input devices are handheld controllers such as the Nintendo GameCube controller depicted in Figure 5. But more and more, console developers have begun innovating in input devices. For example, games in the You Don’t Know Jack series published in the early 2010s require an internet browser to
Figure 5. A standard black Nintendo GameCube controller.
As for content, Ermi and Mäyrä (2005) found that the three key dimensions of presence in the gameplay experience are sensory immersion, challenge-based immersion, and imaginative immersion (in their terms):
Sensory immersion refers to “the audiovisual execution of games”. With advances
in processing power and computer-generated graphics, game designers can generate “audiovisually impressive, three-dimensional[,] and stereophonic worlds that surround their players in a very comprehensive manner”. Players may play on a large screen and turn up the volume to “overpower the sensory information coming from the real world” (Ermi & Mäyrä, 2005, p. 7). Indeed, “[a]ny mediated presence is in competition with presence in the real world” (Riva et al., 2004, p. 410). Unrelated stimuli can distract players from experiencing the virtual
Challenge-based immersion is attained when a player achieves “a satisfying
balance of challenge and abilities” (Ermi & Mäyrä, p. 7), not unlike the classic flow state (Csikszentmihalyi & LeFevre, 1989; Moneta & Csikszentmihalyi, 1996). Challenges can involve one or more of a variety of skills, such as hand-eye coordination, fine motor skills, logic and problem solving, strategy, etc.
Imaginative immersion is more amorphous and comprised of heterogeneous
elements. Ermi and Mäyrä (2004) describe it as “the area in which the game offers the player a chance to use her imagination, [empathize] with the characters, or just enjoy the fantasy of the game” (p. 8). However, this idea strongly
resembles Riva et al.’s (2004) extended presence.
Ermi and Mäyrä (2004) call their model of these three dimensions the SCI-model, which is illustrated in Figure 6. They include in this model a player component. Sacau and colleagues (2008) review the influence of individual factors on presence. IJsselsteijn et al. (2000) also identify user characteristics as one of the four classes of factors that function as determinants of presence. Such factors may include gender differences (Heeter, 1992), hypnotizability (Wiederhold & Wiederhold, 1999; 2000) or
Figure 6. The SCI-model (Ermi & Mäyrä, 2005, p. 8)
Performance feedback. According to Riva and colleagues (2011), the main experiential outcome of the presence process is a sense of agency, in which the player is both author and owner of his/her actions within the virtual environment; the feeling of presence is in fact closely related to the quality of agency. For Lee (2004) the quality of agency is exemplified as successfully supported user action. In the context of interactive realms, user actions are successfully supported when the user perceives the virtual environment’s reaction to his/her actions as legitimate.
player, a victory theme song is played each time. Or perhaps the game controller vibrates when the on-screen environment is disturbed or when the player’s character takes
damage. For example, Brown and Cairns (2004) found that for even low levels of presence to be realized, game controls and associated feedback need to correspond in an appropriate manner such that the players can become adept in at least the main controls of the game.
Clear goals and immediate performance feedback are “conditions for flow” (Rich, 2013, p. 48). Moneta and Csikszentmihalyi (1996) define flow as “a psychological state in which the person feels simultaneously cognitively efficient, motivated, and happy” (p. 277). In accordance with this notion, Limperos, Schmierbach, Kegerise, and Dardis (2011) found that enjoyment may be driven more by a player’s sense of control than by achieving a game’s designed goals (though one may conceivably experience presence without enjoyment). According to flow theory and Brown and Cairns (2004), flow
parallels presence in that “attention is needed, sense of time is altered, and sense of self is lost” (p. 1300). Though the precise relationship between flow and presence may not be clear, it is evident that there is a strong connection between the two constructs
(Brockmyer et al., 2009; Brown & Cairns, 2004; Bryce & Rutter, 2001; Ermi & Mäyrä, 2005; Limperos et al., 2011; Nacke, Grimshaw, & Lindley, 2010; Nacke & Lindley, 2008; Voiskounsky et al., 2004).
of awareness exist” (Baddeley, as cited in Nunez, 2004, p. 44). Given a set of stimuli, the contents of working memory equates to all stimuli that are attended to (Jonides et al., 1996; Nunez, 2004).
A cognitive load or cognitive burden can be characterized as a hindrance to working memory or an allocation of working memory capacity (van Merriënboer & Sweller, 2005). Cognitive load theory, though primarily concerned with theories of learning, identifies three types of load (Schrader & Bastiaens, 2012) that are relevant to information processing in general (Paas, Tuovinen, Tabbers, & Gerven, 2003; Rey & Buchwald, 2011; Sweller, 2008; Sweller, van Merrienboer, & Paas, 1998):
Intrinsic load is induced by the complexity of the information involved with the
task itself that must be processed. In learning contexts, it is often analogous to level of difficulty of content to be learned (Edgcomb, Vahid, & Lysecky, 2015). Intrinsic cognitive load is typically treated as an inherent constant (Sweller, 2010). In multiplayer gameplay, this may involve tracking the actions and positions of an opponent’s avatar in relation to one’s own.
Extraneous load is induced by the manner in which information or tasks are
device for Super Smash Bros. Brawl, which is a game for the Nintendo Wii. Though Brawl may be played using the Wii Remote as well, the older GameCube controller is the preferred input device at the competitive level because of its greater ease of use and more-reliable responsivity.
Generally speaking, instructional designers seek to minimize extraneous load while enhancing germane load. Germane load reflects the mental effort by which cognitive schemata are formed to organize information. Efficient use of schemata for pattern matching and pattern identification is essential in the development of expertise (Sweller et al., 1998). Simon and Gilmartin (1973) found that chess grandmasters could accurately reproduce configurations of chess pieces with ease, so long as the configurations were taken from real chess games. When the
configurations were instead random pieces dispersed on a chessboard, they performed no better than did novices. In gameplay, germane load may be involved in identifying and recognizing recurrent patterns in gameplay. Because “[e]xtended consciousness relies on working memory” (Damasio, as cited in Riva et al., 2004, p. 404) individual differences in working memory capacity influence the experience of presence (Rawlinson, Lu, & Coleman, 2012). Of course, different types of games involve different domains of working memory to differing degrees. The gameplay environment presents a set of external stimuli that must be processed. Logically, some engagement of working memory is a prerequisite for achieving presence (Nunez, 2004, p. 45):
The Problem and Goal
Measuring presence with reliability and validity is a significant problem for presence researchers (Slater, 1999). It can be difficult to disentangle the construct of presence from related or epiphenomenal constructs such as flow, attention, or
psychological absorption (Slater, 2003). Following from such definitional issues, it is pointedly difficult to develop good standardized measures for presence. Darken et al. (1999) identify two major concerns in this vein (p. 1):
1. As previously noted, “[p]resence is an extremely ambiguous term with no widely accepted definition.”
2. Consequently, “[t]here are no reliable, repeatable measures for presence. There is something of a ‘chicken-and-egg’ problem here. If there is no accepted definition of presence, then there can be no measures for presence”.
The self-report approach (e.g., Witmer & Singer, 1998; Jennet et al., 2008; Lessiter, Freeman, Keogh, & Davidoff, 2001; Lombard et al., 2000; Wissmath, Weibel, & Mast, 2010) is typically used in the assessment of presence (Schubert et al., 2001; Slater, 2004) and commonly in related concepts as well, such as flow (Jackson & Marsh, 1996) or game engagement (Brockmyer et al., 2009). However, the limitations to relying solely on subjective self-reported questionnaires are well known in social science
a fictitious concept (colorfulness of one’s day) could be fabricated and “measured” using a questionnaire and discusses other special limitations to using questionnaires to evaluate presence. A questionnaire alone cannot rule out that resultant evidence of the occurrence or experience of presence is merely a methodological artifact. Logically, a number of presence researchers have advocated for the inclusion of objective physiological or behavioral measures alongside traditional questionnaires (Guger et al., 2004; IJsselsteijn et al., 2000; Malbos et al., 2012; Mikropoulos et al., 2004; Nacke & Lindley, 2008; Slater, 2004; Slater & Steed, 2000). That is not to say that questionnaires are completely meritless. Even Slater (2004), who encourages researchers to “abandon the easy but ultimately useless employment of questionnaires”, concedes that “previous questionnaire-based studies might be thought of as hypothesis generators” (p. 492) at least. But since presence is a psychological phenomenon (Lee, 2004; McCreery et al., 2013; Riva et al., 2004; Schubert et al., 2001), it is necessarily subjectively experienced. Therefore, subjective measures are still appropriate, but due to the shortcomings of subjective measurement, they should be corroborated with objective measures (IJsselsteijn et al., 2000). Even with abundant consensus of subjective evidence, the additional support of objective measurement can only strengthen a claim. The broader goal of this study is thus consistent with that of Darken et al. (1999, p. 14):
“If a number of studies such as this can be completed to show what does and what does not seem to be related to presence, we can then work towards an aggregate model, and subsequently a measurement, of presence that is reliable, repeatable, and consequently widely accepted by our research community.”
First, this study seeks to manipulate the presence experienced during multiplayer console gameplay (Super Smash Bros. Brawl) against a computer opponent by
The Game
Super Smash Bros. Brawl is a console game published by Nintendo in 2008 for the Wii. Its standard multiplayer play mode can be classified as a fighting
two-dimensional platformer. The default multiplayer mode is a timed battle in which each player seeks to score the most points. After navigating to the multiplayer play mode through the game’s GUI, players select a character, whose avatar they control during gameplay proper. After the selection screen, a stage is selected. When the match commences, players may attempt to use their characters’ attacks to inflict damage upon other players. As a character accumulates more and more damage, the character becomes more susceptible to knockback from subsequent attacks. In the default timed mode, knocking another character out of the stage scores +2 points, while falling off or being knocked off scores -1 points. Whichever player has scored the most points by the end of the match is the winner.
Super Smash Bros. Brawl was chosen as the game of study for several reasons:
Super Smash Bros. Brawl is a game with which I am personally familiar. Many
two predecessors (Super Smash Bros. and Super Smash Bros. Melee) as well. I have also played its successor (Super Smash Bros. for Wii U) a few times as well.
In my view, Brawl is just old enough to reach a sort of “critical mass” in player audience. Its two sequels (Super Smash Bros. for Wii U and Super Smash Bros. for Nintendo 3DS) were only just released in 2014. Sales for Brawl then may theoretically have already reached an upper limit. Yet, only eight years have elapsed since its release, so its original intended audience is probably comprised of living people who still play games.
Brawl is non-controversial. The extent of its violence is cartoon violence. The
parental advisory rating given it by the Entertainment Software Rating Board is T for Teen. Thus, the game should be appropriate for a sample population of adults.
Brawl is popular, or at least it was around its release date. On January 11, 2016, it
As evidenced by the four generations of the franchise, findings regarding Brawl are likely to be replicable in future sequels of the franchise, and perhaps to other games of the genre.
Finally, certain gameplay settings of interest are customizable. In particular, haptic vibratory performance feedback and a damage gauge overlaid on the bottom of the screen, which are enabled by default, can be disabled.
Types of Performance Feedback in Super Smash Bros. Brawl
Performance feedback features of Brawl can be broken down into three sensory modalities: visual, auditory, and haptic.
Visually, in-game avatars will move a certain way when certain buttons are pressed on the controller. If a player is hit, the avatar will flinch or fly opposite the direction of impact. Damage accrued by a character is demarcated at the bottom of the screen as a percentage next to an icon representing the character; this percentage may range from 0% to 999%, with 0% anchored at no damage. Or, if a player’s avatar interacts with the environment in some way, this will generally be reflected in some graphical animation on-screen.
victory scene at the end of a match. Otherwise, music serves primarily as a soundtrack for stages or for GUIs.
From my experience, the vast majority of players prefer playing using GameCube controllers like that depicted in Figure 5. Haptic feedback correlates with significant game events by vibrating the controller. For example, consistent vibration patterns are differentially generated when a character is ringed out, is hit by an attack, or wins a match. In addition, players can perceive with their thumbs whether certain buttons are depressed or if a joystick is tilted in a certain direction.
The Manipulation: Sound Effects
Auditory feedback is the chosen manipulation of this experiment. More specifically, the comparison group will play the game with all audio muted, while the treatment group will play with only sound effects enabled (no music).
Sound effects were chosen over visual modalities of feedback to increase the generalizability of findings. It is not uncommon for many games of different genres and eras for different platforms to include some sort of sound feedback. On the other hand, visual feedback in Brawl as described above is either immutable, peculiar to Brawl, or uncharacteristic of other game genres. Manipulation of auditory feedback was preferred over haptic feedback also for generalizability, as many older consoles do not support vibrating input devices. Moreover, nearly every possible player action with any character generates a sound effect (with the exception of Zelda’s down taunt).
It should be noted that the default audio setting is for both music and sound effects to be enabled. The deviation from the default setting for the comparison condition is justified by the potential burden to both verbal (Iwanaga & Ito, 2002) and visuospatial (Crawford & Strapp, 1994) working memory that background music may present.
Methods
Measurements
Appendix A contains the final conglomerate paper-and-pencil instrument
administered. Some changes from the originals in format and the instructional text were made so that each questionnaire would be more consistent with each other. The
dependent construct, presence, was measured by ten variables. Eight covariate factors were taken as well.
Presence measurements. Three instruments for measuring presence were administered in conjunction, since the secondary goal of this research is to compare existing measures of presence.
Independent Television Commission-Sense of Presence Inventory (ITC-SOPI).
The ITC-Sense of Presence Inventory (ITC-SOPI) was developed by Lessiter et al. (2001). In development, it was tested with over 600 participants on a variety of media, including a console video game. The ITC-SOPI has seen recent use (as of 2016) by other authors as well (Khan, van de Kraan, Mason, & Aliakseyeu, 2016; Kosunen et al., 2016; Newbutt et al., 2016; Perpiñá & Roncero, 2016; Rosa, Morais, Gamito, Oliveira, & Saraiva, 2016).
validity/naturalness, and negative effects (e.g., headaches or eyestrain). This yields four different factor scores.
Temple Presence Inventory (TPI). The Temple Presence Inventory (TPI) was
developed by Lombard et al. (2000) with about 300 participants and later refined in 2009 by Lombard, Ditton, & Weinstein. Like the ITC-SOPI, it has also seen recent use in other studies (Cesta, Cortellessa, Orlandini, & Tiberio, 2016; Vrellis, Avouris, & Mikropoulos, 2016). Similarly, the TPI was also designed to be useful with a variety of media.
The TPI also measures different dimensions of presence using 7-point Likert items. This study subsets the TPI dimensions to yield five different factor scores: spatial presence, passive interpersonal social presence, active interpersonal social presence, engagement, and social richness. Here, social presence has to do with “the extent to which a medium is perceived as sociable, warm, sensitive, personal[,] or intimate when it is used to interact with other people” (Lombard & Ditton, 1997, p. 3) while social
richness has to do with the intimacy and immediacy of the experience (Lombard & Ditton, 1997). The parasocial interaction, social realism, and perceptual realism modules were omitted. A console video game played on a single two-dimensional monitor is low in system immersion compared to a virtual reality apparatus. In addition, the gameplay is set in a fantasy realm. As such, items like ‘The way in which the events I saw/heard occurred is a lot like the way they occur in the real world’ or ‘Overall how much did touching the things and people in the environment you saw/heard feel like it would if you had experienced them directly?’ may be absurd in the context of this study.
Presence Self-Assessment Manikin (SAM). Wissmath et al. (2010) developed a
Lang (1994). Using 162 participants, the authors found no difference in reports of presence using the self-assessment manikin (SAM) online during an immersive task and afterwards. Their findings also suggested that the manikin may assess presence more directly than a verbal measures and that it may take less effort for participants to respond. A simplified 5-point version is used in this study.
Covariate measurements. Given the smaller sample size of this study, eight covariates were included in the model to statistically manage variability between treatment groups.
Previous gameplay experience. According to Lee (2004), “[s]uccessfully
supported action occurs when environmental reaction to user action meets user
expectations” (p. 30-31), thereby according to the player a sense of agency, which may be important in the experience of presence. For example, if a player does not anticipate strong vibratory haptic feedback, the sensation may startle him/her out of the progression towards presence. Moreover, having to learn a new control scheme may tax working memory capacity such that presence is precluded (van Merriënboer & Sweller, 2005, p. 149):
“Working memory must inevitably be limited in capacity when dealing with novel, unorganized information because as the number of elements that needs to be organized increases linearly, the number of possible combinations increases exponentially.”
Therefore, participants were asked, “Prior to today, have you played Super Smash Bros. Brawl in the past year (12 months)?” This response was recorded as a binary covariate.
Familiarity with controls. The participant’s familiarity with the default control is
familiar were you with the controller scheme you just used?”), included in Appendix A. As noted above, only players with recent experience were recruited. However, Brawl allows customization of the control scheme. Also, there are several input devices available that may be used with the Wii console. Therefore, it is critical to collection additional information regarding participants’ familiarity with the controls.
Sex. Other researchers have identified potential gender differences in
experiencing presence (Eastin, 2006; Nicovich, Boller, & Cornwell, 2005). Therefore, biological sex was included as a covariate as well. Since all participants identified as either male or female, this is a binary covariate.
Age. Although almost all participants were between the ages of 18 and 24 years
old, there was some variation in the sample. It has been hypothesized that due to age-related cognitive decline, older people may find it more difficult to experience presence, due to problems with working memory faculties (Sacau et al., 2008). In fact, Salthouse (1996) found age differences in processing speed on a variety of cognitive tasks while van Schaik, Turnbull, Wersch, and Drummond (2004) found a significant negative rank-order correlation between age and spatial presence. To mitigate any potential statistical noise this factor may present, age was included as a covariate in the model. Ages were recorded as one of the following: 18-24 years, 25-30 years, 31-35 years, 35+ years.
endpoint and midpoint anchor text that yield a single score between 18 and 126 for each participant.
Computer player difficulty level. Participants chose the difficulty level of the
computer opponents themselves prior to gameplay, much as a player would outside a laboratory. Because this factor was not controlled and because it influences the intrinsic load of the task, this difficulty level was taken as a covariate as well. Computer player level may range from 1 to 9, discretely.
Visuospatial working memory task. As noted above, engagement of working
memory faculties plays a central role in experiencing presence. Therefore, visuospatial working memory capacity was chosen as a covariate as well. Stone & Towse (2015) developed a set of open-source computerized versions of cognitive tasks commonly used in cognitive research. Of these, there are three verbal tasks and four visuospatial tasks. Of the visuospatial tasks, two are complex span tasks, which “follow the paradigm of item storage with concurrent processing of a demanding task in which there are a set number of item storage and cognitive processing events” (p. 1). Of these remaining two, only the symmetry span task was chosen over the rotation span task for ease of administration; although a composite score may be desirable, only one task was chosen to avoid participant fatigue.
responds with the left or right arrow key. Once all the grid locations have been displayed, the participant will be presented with a blank 4 x 4 grid and will recall the grid locations, clicking or tapping them in the order displayed. The instruction sheet for this task is included in Appendix C.
Figure 7. An example of a two-span trial of the symmetry span visuospatial working memory task (Stone & Towse, 2015).
2003). Trials are presented in random order. For each participant, this measure yields a discrete score between 0 and 20, counting each successfully completed recall trial; the symmetry judgments do not factor into this score.
Handedness. Participants were asked, “Which is your dominant hand?”
Handedness has been a factor of consideration in other studies of presence (Bouchard et al., 2012; Ma & Kaber, 2006) and in cognition more broadly (Gur et al., 1982; Moffat & Hampson, 1996; Mazoyer et al., 2016; Sahu, Christman, & Propper, 2016).
Other Materials
The lights were turned off during gameplay and all blinds were closed. The room measured approximately 13.5 x 13.5 x 7.25 feet. A sign that read “VIDEO GAME STUDY” was placed on the playing room’s door. Figure 8 illustrates the approximate layout of the room. The game was displayed on an LCD screen (LG Model No.
55UF7600-UJ), which measured approximately 4 feet by 2 feet 4 inches and placed about 6 feet away from the chair. For the treatment group, the monitor’s volume level was set to 50 (with a maximum value of 100). The visuospatial working memory task was
Figure 8. Room layout.
Procedure
The administration area was staged as described above and all equipment calibrated according to treatment condition prior to the arrival of participants. When a participant arrived, they were welcomed and consent was obtained. The consent form (Appendix B) includes a brief description of the study as well. In addition, at the end of the consent form, participants marked what level opponent they would like to play against.
Before the consent process, participants were verbally screened; they were asked if they were over 18 years of age, fluent in English, or prone to seizures. All participants met these criteria (over 18, fluent, not prone to seizures). Once the consent form was signed, participants were asked to close their eyes and take a few deep breaths for about 30 seconds (timed). This act served two purposes. First, participants may feel more relaxed and acclimate their eyes for the dark room they were about to enter. Second, thirty seconds was sufficient time for the administrator to set the computer opponent’s level, so that participants would not have to set it themselves.
As the participant was escorted into the playing room, the sound was unmuted for those in the treatment condition. Gameplay began at the character selection screen. The administrator asked the participant to inform the administrator when the match was over and then left the room to allow gameplay to carry on.
completed the task. Finally, participants were debriefed, thanked, and dismissed. See Appendix D for the standardized script used with all participants.
Participants
A total of N = 41 participants were recruited via convenience sampling in the Durham-Chapel Hill area. The treatment group consisted of 21 participants (10 male, 10 female) and the comparison group of 20 participants (6 female, 14 male). Almost all participants (n = 37) were right-hand dominant; of the remaining 4, 1 left-hand dominant participant was assigned to the treatment group while 2 left-hand dominant and 1
ambidextrous participant were assigned to the comparison group. All were fluent in English as a recruitment prerequisite. 9 participants in the comparison group and 8 participants in the treatment group had played Brawl at least once in the past twelve months prior to study participation. Participants were assigned to treatment groups on order of intake. See Table 1 for a summary of participant demographics and other covariate scores.
Covariate
Prior Recent Experience (12 months) Sex
Yes No
9 11
Table 1
Dominant Hand
14 2 0
Female Male
6 14
18-24 25-30 31-35 35+ Age
4
17 2
Visuospatial Working Memory Task Score 10.00 Familiarity with Controller Scheme
M SD
4.95 2.95 Computer Opponent Difficulty Level
Immersive Tendencies Questionnaire Score
1 Comparison
(n = 20)
83.23 16.11 5.41 1.57 3.07 18-24 25-30 Female 3.00 Treatment
(n = 21) 31-35 35+
14 3 1 3
Right Left Amb.
Male
5 16
Yes No
Right Left Amb.
20 1 0
1.48 11.52 5.07 89.62 11.33 8 13 M SD 4.81 2.70 3 1
18-24 25-30 31-35 35+
28 5 1 7
Sample Total (N = 41) Summary of Covariate Data
2.98 1.51 10.78 5.23 86.50 14.07 17 24 M SD 4.88 2.85 Female Male 11 30 Yes No
Results
Hypotheses
The treatment condition was hypothesized to result in higher ratings of presence than the comparison condition. Namely, a main effect of treatment condition was expected to be observed.
Measures of presence are expected to correlate with each other, since they purport to measure the same or highly related constructs. The most similar measures of presence (e.g., spatial presence as measured by the ITC-SOPI and TPI) were expected to correlate strongly. Some correlation between the other measures was expected as well. For
instance, the immersive tendencies scores ostensibly would predict measures of presence, since those scoring highly on the ITQ would be naturally more predisposed to
experiencing presence in any situation.
Main Analyses
Data analyses were conducted with SPSS. The dependent variables were measures of presence and treated as ordinal variables. From the ITC-SOPI were the following: spatial presence, engagement, ecological validity/naturalness, and negative effects. From the TPI were the following: spatial presence, passive interpersonal social presence, active interpersonal social presence, engagement, and social richness. Finally, the SAM yielded one dependent measure as well. This was a total of ten dependent measures (Table 2).
First, normality of dependent variables was assessed. A Shapiro-Wilk test of normality at an alpha level of .05 revealed that the SAM (W(41) = 0.68, p < .001),
passive interpersonal social presence (W(41) = 0.94, p = .041), active interpersonal social presence (W(41) = 0.94, p = .023), ITC-SOPI engagement (W(41) = 0.93, p = .015), and negative effects (W(41) = 0.92, p = .007) violated assumptions of homoscedasticity for subsequent analyses; the SAM (KS(41) = 0.239, p < .001) and ITC-SOPI engagement (KS(41) = 0.15, p = .022) were additionally flagged by a Kolmogorov-Smirnov test of normality with Lilliefors significance correction at an alpha level of .05 (Table 3).
Table 2
Dependent Measures
Lessiter et al. (2001) Lombard et al. (2000) Wissmath et al. (2010) ITC-Sense of Presence Inventory Temple Presence Inventory Self-Assessment Manikin
Engagement Engagement Presence
Spatial Presence Spatial Presence
Ecological Validity/Naturalness Passive Interpersonal Social Presence Negative Effects Active Interpersonal Social Presence
Next, a correlation matrix between all dependent variables was generated to assess possible multicollinearity (Table 4). Since certain dependent variables were not normally distributed, both Pearson’s product-moment correlation and Spearman’s rank-order correlation were used. Though some multicollinearity was detected, no significant correlation coefficient (parametric or nonparametric) at α = .05 exceeded .80, also confirming the hypothesis that correlations would be observed between measures of presence.
Table 3
Statistic df p Statistic df p
Self-Assessment
Manikin 0.24 41 .000
*** 0.86 41
.000***
TPI Spatial Presence 0.07 41 .200* 0.97 41 .481
TPI Passive Interpersonal
Social Presence 0.11 41 .200
* 0.94 41
.041**
TPI Active Interpersonal
Social Presence 0.12 41 .138 0.94 41 .023
**
TPI Enagement 0.12 41 .177 0.97 41 .365
TPI Social Richness 0.10 41 .200* 0.98 41 .560
ITC-SOPI Spatial
Presence 0.07 41 .200
* 0.97 41 .377
ITC-SOPI Engagement 0.15 41 .022** 0.93 41 .015**
ITC-SOPI Ecological
Validity/Naturalness 0.12 41 .161 0.95 41 .057
ITC-SOPI Negative
Effects 0.12 41 .168 0.92 41 .007
**
a. Lilliefors Significance Correction **. p < .05
***. p < .001
Tests of Normality
Dependent Variable
Kolmogorov-Smirnova Shapiro-Wilk
Box’s test of equality of covariance matrices revealed no multivariate
heterogeneity of variance between treatment groups (M = 58.69, F(55, 4885.72) = 0.77, p
Table 4
Correlations Between Dependent Variables
Measure 1 2 3 4 5 6 7 8 9 10
ρ 1.00 .16 -.38* .00 -.21 -.05 -.23 -.24 -.04 -.12 p (2-tailed) ––– .309 .015 .980 .197 .758 .155 .129 .806 .453 ρ .16 1.00 .46** .29 .38* .40* .63** .21 .50** .13 p (2-tailed) .309 ––– .002 .067 .015 .010 .000 .192 .001 .402 ρ -.38* .46** 1.00 .36* .47** .38* .56** .51** .45** .12 p (2-tailed) .015 .002 ––– .022 .002 .014 .000 .001 .003 .471 ρ .00 .29 .36* 1.00 .42** .24 .36* .38* .05 .08 p (2-tailed) .980 .067 .022 ––– .006 .124 .020 .015 .761 .616 ρ -.21 .38* .47** .42** 1.00 .61** .74** .70** .47** -.01 p (2-tailed) .197 .015 .002 .006 ––– .000 .000 .000 .002 .929 ρ -.05 .40* .38* .24 .61** 1.00 .51** .70** .41** -.04 p (2-tailed) .758 .010 .014 .124 .000 ––– .001 .000 .007 .807 ρ -.23 .63** .56** .36* .74** .51** 1.00 .64** .62** .05 p (2-tailed) .155 .000 .000 .020 .000 .001 ––– .000 .000 .759 ρ -.24 .21 .51** .38* .71** .70** .64** 1.00 .36* .04 p (2-tailed) .129 .192 .001 .015 .000 .000 .000 ––– .021 .806 ρ -.04 .50** .45** .05 .47** .41** .62** .36* 1.00 .19 p (2-tailed) .806 .001 .003 .761 .002 .007 .000 .021 ––– .226 ρ -.12 .13 .12 .08 -.01 -.04 .05 .04 .19 1.00 p (2-tailed) .453 .402 .471 .616 .929 .807 .759 .806 .226 –––
r 1.00 .14 -.47** -.01 -.19 -.04 -.17 -.15 -.06 -.13 p (2-tailed) ––– .392 .002 .944 .223 .819 .276 .345 .731 .420 r .14 1.00 .31* .37* .42** .38* .63** .24 .47** .17 p (2-tailed) .392 ––– .047 .017 .006 .013 .000 .124 .002 .294 r -.47** .31* 1.00 .27 .48** .27 .53** .46** .43** .11 p (2-tailed) .002 .047 ––– .085 .001 .093 .000 .002 .005 .511 r -.01 .37* .27 1.00 .43** .25 .40** .34* .05 -.01 p (2-tailed) .944 .017 .085 ––– .005 .113 .010 .031 .750 .927 r -.19 .42** .48** .43** 1.00 .68** .76** .78** .48** .06 p (2-tailed) .223 .006 .001 .005 ––– .000 .000 .000 .002 .717 r -.04 .38* .27 .25 .68** 1.00 .56** 7.00 .43** -.10 p (2-tailed) .819 .013 .093 .113 .000 ––– .000 .000 .005 .543 r -.17 .63** .53** .40** .76** .56** 1.00 .69** .61** .15 p (2-tailed) .276 .000 .000 .010 .000 .000 ––– .000 .000 .341 r -.15 .24 .46** .34* .78** .77** .69** 1.00 .38* .13 p (2-tailed) .345 .124 .002 .031 .000 .000 .000 ––– .015 .421 r -.06 .47** .43** .05 .48** .43** .61** .38* 1.00 .18 p (2-tailed) .731 .002 .005 .750 .002 .005 .000 .015 ––– .247 r -.13 .17 .11 -.01 .06 -.10 .15 .13 .18 1.00 p (2-tailed) .420 .294 .511 .927 .717 .543 .341 .421 .247 ––– **. Correlation is significant at the 0.01 level (2-tailed).
*. Correlation is significant at the 0.05 level (2-tailed). 7- ITC-SOPI Engagement
8- Ecological Validity/Naturalness
9- Negative Effects
10- Self-Assessment Manikin
2- Passive Interpersonal Social Presence
3- Active Interpersonal Social Presence
4- TPI Engagement
5- Social Richness
6- ITC-SOPI Spatial Presence
Spearman's rank-order correlation
Pearson's product-moment correlation
1- TPI Spatial Presence 1- TPI Spatial Presence
2- Passive Interpersonal Social Presence
3- Active Interpersonal Social Presence
4- TPI Engagement
5- Social Richness
6- ITC-SOPI Spatial Presence
7- ITC-SOPI Engagement
8- Ecological Validity/Naturalness
9- Negative Effects
= .893). Similarly, Levene’s test of equality of error variances revealed no heterogeneity of variance between independent variable groups for any dependent variable (Table 5).
A 1 x 2 (mute vs. sound effects only) MANCOVA with bootstrapping was performed with one independent variable of two levels: treatment vs. comparison group. There were eight covariate predictor variables included in the model: familiarity with controls, previous recent gameplay experience, age, sex, handedness, visuospatial working memory score, computer opponent difficulty, and ITQ score (Table 6). In this way, the effect of the independent variable on the dependent variables may be tested while controlling for the effects of the covariates. As noted above, assumptions of
homogeneity of variance and covariance between groups were not violated. Though some multicollinearity between dependent variables was detected, none of the significant correlations exceeded .80, which is below the cutoff of r ≥ .90 used by Schliermann, Heydenreich, Bungter, and Anneken (2016) for MANCOVA. Since heteroscedasticity was detected by Kolmogorov-Smirnov tests for the SAM and ITC-SOPI engagement (in
Table 5
F(1, 39) p Self-Assessment Manikin 0.01 .906
TPI Spatial Presence 0.11 .744
Passive Interpersonal Social Presence 0.09 .762 Active Interpersonal Social Presence 0.56 .457
TPI Enagement 0.03 .872
Social Richness 0.02 .900
ITC-SOPI Spatial Presence 1.32 .258
ITC-SOPI Engagement 0.20 .660
Ecological Validity/Naturalness 1.17 .286
Negative Effects 0.44 .513
addition to active interpersonal social presence, passive interpersonal social presence, and negative effects, according to the Shapiro-Wilk tests), SPSS’s bootstrapping module with simple sampling (1000 samples) was utilized with the MANCOVA. According to the SPSS user guide for the bootstrapping module, bootstrapping is useful for parametric tests, including the MANCOVA, when assumptions of normality are in doubt (“IBM SPSS Bootstrapping 21,” 2012).
The full MANCOVA yielded a Wilks’ lambda that revealed a significant multivariate effect of the treatment condition while controlling for all covariates (λ = 0.47, F(10.00, 22.00) = 2.48, p = .037, partial η2 = 0.53); all multivariate tests are
recorded in Table 7. Post hoc tests of between-subjects effects for each dependent variable by treatment condition (Table 8) did not reveal any significant effects of treatment condition, likely because of a lack of power due to the inclusion of weak covariates and to correlations between dependent variables.
Table 6
Covariates
Measure Range Type of Measurement Type of Variable
Familiarity with controls [1 - 5] Likert ordinal
Visuospatial working memory task [0 - 20] number correct ratio
Immersive Tendencies Questionnaire score [18 - 126] sum of Likert scores ordinal
Computer player difficulty level [1 - 9] in-game setting ordinal
Age [1 - 4] multiple choice ordinal
Sex [0 - 1] multiple choice/write-in binary
Previous experience [0 - 1] yes/no binary
To explore the main hypothesis further and to gain more degrees of freedom, a reduced MANCOVA model with bootstrapping was constructed using only covariates with a demonstrated relationship with the dependent variables. A nonparametric two-tailed correlation matrix between predictor variables and dependent variables was
Table 7
Multivariate Tests - Full MANCOVA
Effect Wilks' λ F(10.00, 22.00) p Partial η2
Condition 0.47 2.48 .037* 0.53
Handedness 0.66 1.15 .373 0.34
Age 0.70 0.94 .521 0.30
Sex 0.73 0.80 .629 0.27
Prior recent experience 0.54 1.89 .102 0.46
Computer opponent level 0.68 1.05 .436 0.32
Familiarity with controls 0.86 0.36 .953 0.14
Visuospatial working memory score 0.75 0.73 .689 0.25 Immersive Tendencies Questionnaire 0.62 1.35 .266 0.38 *. p-value is significant at the 0.05 level (2-tailed).
Table 8
Tests of Between-Subjects Effects - Post Hoc ANCOVA Dependent Variable F(1, 40) p Partial η2
Self-Assessment Manikin 1.69 .204 0.052 TPI spatial presence 1.37 .251 0.042 Passive interpersonal presence 0.40 .532 0.013 Active interpersonal presence 0.17 .683 0.005
TPI engagement 3.81 .060 0.109
Social richness 0.03 .873 0.001
produced (Table 9). Of the eight covariates, only ITQ scores were significantly correlated with any dependent measures. ITQ scores were significantly correlated with social
richness (ρ(39) = .37, p = .017) and ITC-SOPI engagement (ρ(39) = .54, p < .001).
The reduced MANCOVA therefore included only a single covariate: ITQ scores. Multivariate tests revealed significant influence of treatment condition (λ = 0.55, F(10.00, 29.00) = 2.36, p = .035, partial η2 = 0.45) and non-significant influence of ITQ scores (λ
= 0.69, F(10.00, 29.00) = 1.33, p = .262, partial η2 = 0.31). Post hoc ANCOVA testing
(Table 10) indicated a significant effect of treatment condition on TPI engagement (F(1, 40) = 4.98, p = .032, partial η2 = 0.12). Examination of estimated marginal means
revealed that the muted condition (M = 4.62, SE = 0.24) experienced more engagement as
Table 9
Nonparametric Correlations between Covariates and Dependent Variables
Handedness Age Sex
Prior experience Computer opponent level Familiarity with controls Visuospatial working memory score ITQ
ρ -.06 -.10 .04 -.15 -.17 -.12 .24 .11
p (2-tailed) .725 .539 .795 .340 .302 .449 .138 .481
ρ -.26 -.03 -.12 .02 .03 -.08 .09 .22
p (2-tailed) .099 .856 .459 .917 .848 .598 .593 .172
ρ -.06 -.10 .15 -.09 -.04 -.01 .17 .04
p (2-tailed) .730 .543 .337 .584 .810 .952 .277 .798
ρ .15 -.09 -.03 .11 -.03 .06 .01 .24
p (2-tailed) .365 .583 .851 .506 .845 .698 .934 .129
ρ -.05 -.07 .06 .03 .17 .15 .18 .37*
p (2-tailed) .746 .644 .696 .876 .291 .358 .269 .017
ρ -.08 -.11 -.14 .03 -.11 -.07 .06 .29
p (2-tailed) .631 .505 .368 .866 .496 .683 .729 .071
ρ -.12 -.05 -.12 .13 .11 .10 .10 .54**
p (2-tailed) .468 .760 .459 .411 .507 .514 .514 .000
ρ .01 .07 -.03 -.05 -.06 -.01 .13 .18
p (2-tailed) .958 .676 .873 .744 .733 .957 .423 .272
ρ -.17 .11 -.19 .03 -.25 -.14 -.06 -.11
p (2-tailed) .274 .479 .223 .865 .113 .377 .725 .497
ρ .30 -.10 .13 .08 .05 .19 .22 -.07
p (2-tailed) .056 .528 .430 .607 .734 .230 .168 .683 **. Correlation is significant at the 0.01
level (2-tailed).
*. Correlation is significant at the 0.05 level (2-tailed).
ITC-SOPI Spatial Presence
ITC-SOPI Engagement
Ecological Validity/Naturalness
Negative Effects
Self-Assessment Manikin TPI Spatial Presence
Passive Interpersonal Social Presence
Active Interpersonal Social Presence
TPI Engagement
measured by the TPI than did the treatment group (M = 3.87, SE = 0.23), opposite of what was hypothesized.
To gain a more granular perspective on the effect of condition on engagement, further analyses were conducted on the items composing the TPI engagement subscale. These are the 6 items that make up the engagement module:
#15: To what extent did you feel mentally immersed in the experience? [Not at all – Very much]
#16: How involving was the media experience? [Not at all – Very much]
#17: How completely were your senses engaged? [Not at all – Very much]
#18: To what extent did you experience a sensation of reality? [Not at all – Very much]
#19: How relaxing or exciting was the experience? [Very relaxing – Very exciting]
Table 10
Post Hoc ANCOVA for Reduced Model
Dependent Variable F(1, 40) p partial η2
Self-Assessment Manikin 1.36 .250 0.03
TPI spatial presence 0.39 .535 0.01
Passive interpersonal presence 0.28 .598 0.01 Active interpersonal presence 0.05 .816 0.00
TPI engagement 4.98 .032* 0.12
Social richness 0.14 .710 0.00
ITC-SOPI spatial presence 0.25 .618 0.01
ITC-SOPI engagement 0.06 .812 0.00
Ecological validity/naturalness 0.04 .852 0.00
Negative effects 0.54 .467 0.01
#20: How engaging was the story? [Not at all – Very much]
Both Shapiro-Wilks and Kolmogorov-Smirnov (with Lilliefors significance correction) tests of normality revealed that all 6 item response distributions were heteroscedastic (Table 11).
A 2-way repeated measures MANOVA was conducted with condition as the between-subjects factor and item number as the repeated measure. Box’s test of equality of covariance matrices did not reveal a violation of this assumption (M = 24.87, F(21, 5563.65) = 0.99, p = .477). Multivariate tests revealed a significant main effect of item number (Wilks’ λ = 0.25, F(5.00, 35.00) = 20.99, p < .001, partial η2 = 0.75), but no
significant interaction between item number and condition (Wilks’ λ = 0.95, F(5.00, 35.00) = 0.41, p = .838, partial η2 = 0.06) on average item responses.
Mauchly’s test indicated that the assumption of sphericity was violated (W = 0.43, χ2(14) = 31.04, p = .006). Thus, degrees of freedom were corrected using the
Huynh-Feldt estimate of sphericity (ε = .89). A test of within-subjects effects for item number Table 11
Tests of Normality for TPI Engagement Items
Statistic df p Statistic df p
#15 0.23 41 .000** 0.89 41
.001*
#16 0.18 41 .002* 0.92 41
.009*
#17 0.19 41 .001* 0.93 41
.014*
#18 0.19 41 .001* 0.90 41
.002*
#19 0.19 41 .001* 0.92 41
.006*
#20 0.18 41 .001* 0.86 41
.000** **. p < .001
a. Lilliefors Significance Correction Item
Kolmogorov-Smirnova Shapiro-Wilk
corroborated the multivariate test (F(3.87, 151.07) = 32.31, p < .001), indicating that respondents tended to answer different items in different ways. A test of
between-subjects effect for treatment condition did not suggest a main effect (F(1, 39) = 0.07, p = .794, partial η2 < 0.01), though the assumption of equality of error variances was violated
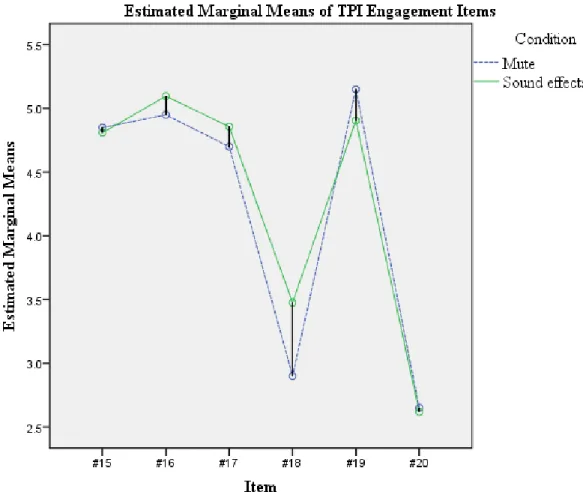
for item number 16, F(1, 39) = 4.28, p = .045 (Table 12). Subsequent examination of pairwise comparisons of estimated marginal means with Bonferroni adjustment for multiple comparisons indicated that items #18 and #20 were answered similarly, but significantly differently than the other items, which were likewise answered similarly (Table 13), as illustrated in Figure 9. Item means are reported in Table 14.
Table 12
Levene's Tests for TPI Engagement Items Item Number F(1, 39) p
#15 3.16 .083
#16 4.28 .045*
#17 0.58 .450
#18 0.76 .387
#19 1.42 .241
#20 0.11 .738
Table 13
(I) item (J) item
Mean
Difference (I-J) SE pa
#16 -0.19 0.18 1.000
#17 0.05 0.22 1.000
#18 1.64* 0.28 .000
#19 -0.20 0.25 1.000
#20 2.20* 0.32 .000
#15 0.19 0.18 1.000
#17 0.24 0.16 1.000
#18 1.84* 0.26 .000
#19 0.00 0.24 1.000
#20 2.39* 0.29 .000
#15 -0.05 0.22 1.000
#16 -0.24 0.16 1.000
#18 1.59* 0.28 .000
#19 -0.25 0.24 1.000
#20 2.14* 0.31 .000
#15 -1.64* 0.28 .000
#16 -1.84* 0.26 .000
#17 -1.59* 0.28 .000
#19 -1.84* 0.29 .000
#20 0.55 0.29 .982
#15 0.20 0.25 1.000
#16 0.00 0.24 1.000
#17 0.25 0.24 1.000
#18 1.84* 0.29 .000
#20 2.39* 0.26 .000
#15 -2.20* 0.32 .000
#16 -2.39* 0.29 .000
#17 -2.14* 0.31 .000
#18 -0.55 0.29 .982
#19 -2.39* 0.26 .000
*. The mean difference is significant at the .001 level. a. Adjustment for multiple comparisons: Bonferroni. #20
Pairwise Comparisons of Estimated Marginal Means for TPI Engagement Items
#15
#16
#17
#18
Comparison of Reliability of Similar Dependent Measures
To compare the spatial presence and engagement dimensions between the TPI and the ITC-SOPI, Cronbach’s alphas (Cronbach, 1951) were obtained for the corresponding subscales by treatment condition. 12 reliability scores were derived in this way: TPI spatial presence, ITC-SOPI spatial presence, TPI engagement, ITC-SOPI engagement, TPI and ITC-SOPI spatial presence combined, and TPI and ITC-SOPI engagement combined. 6 additional reliability scores were derived from all participants. Reliability analyses revealed Cronbach’s alphas that ranged from 0.65 (7 items; TPI spatial presence, comparison group) to 0.94 (19 items; combined engagement, comparison group). Six
Table 14
TPI Engagement Item Means
Item Group M SD N
Mute 4.85 1.981 20
Sound effects 4.81 1.289 21
Total 4.83 1.642 41
Mute 4.95 1.605 20
Sound effects 5.10 1.136 21
Total 5.02 1.369 41
Mute 4.70 1.658 20
Sound effects 4.86 1.493 21
Total 4.78 1.557 41
Mute 2.90 1.683 20
Sound effects 3.48 1.861 21
Total 3.20 1.778 41
Mute 5.15 1.531 20
Sound effects 4.90 1.044 21
Total 5.02 1.294 41
Mute 2.65 1.814 20
Sound effects 2.62 1.564 21
Total 2.63 1.670 41
Feldt tests (Feldt, Woodruff, & Salih, 1987), one for each treatment-specific construct, were performed using the online tool created by Diedenhofen and Musch (2014). A significant difference was found in reliability scores for the three spatial presence scales in the comparison group (χ2(2, n = 20) = 6.65, p = .036). To probe this effect, three additional Feldt tests were conducted pairwise on these three scores. A significant
difference was found between the combined scale and the TPI scale (χ2(1, n = 20) = 4.99, p = .026) and between the ITC-SOPI scale and the TPI scale (χ2(1, n = 20) = 5.85, p =
Table 15
Comparison of Reliability Scores
Construct Scale Cronbach's α Number of items Feldt's χ2 a p
Combined 0.84 19
TPI 0.65 6
ITC-SOPI 0.80 13
Combined 0.90 26
TPI 0.69 7
ITC-SOPI 0.89 19
Combined 0.94 19
TPI 0.89 6
ITC-SOPI 0.91 13
Combined 0.89 26
TPI 0.65 7
ITC-SOPI 0.90 19
Combined 0.91 19
TPI 0.82 6
ITC-SOPI 0.87 13
Combined 0.89 26
TPI 0.66 7
ITC-SOPI 0.89 19
a. All Feldt's tests were conduected with df = 2. *. p < .05
Treatment Group (n = 21)
.293 .058 .421 Engagement 2.45 5.69 1.73 6.65 4.31 Engagement Spatial Presence Engagement
Spatial Presence .036*
.116
.002* All Participants (N = 41)
Comparison Group (n = 20)
The Self-Assessment Manikin was excluded from Table 12 since it is only one item. Mean scores on the SAM were 2.65 (SD = 0.93) for the mute condition, 2.90 (SD = 0.70) for the treatment condition, and 2.78 (SD = 0.82) for both conditions combined. Table 13 summarizes the means of dependent variables.
Table 16
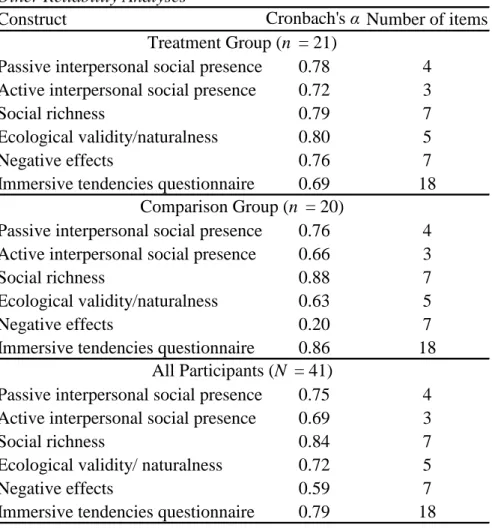
Other Reliability Analyses
Construct Cronbach's α Number of items
Passive interpersonal social presence 0.78 4 Active interpersonal social presence 0.72 3
Social richness 0.79 7
Ecological validity/naturalness 0.80 5
Negative effects 0.76 7
Immersive tendencies questionnaire 0.69 18 Passive interpersonal social presence 0.76 4 Active interpersonal social presence 0.66 3
Social richness 0.88 7
Ecological validity/naturalness 0.63 5
Negative effects 0.20 7
Immersive tendencies questionnaire 0.86 18 Passive interpersonal social presence 0.75 4 Active interpersonal social presence 0.69 3
Social richness 0.84 7
Ecological validity/ naturalness 0.72 5
Negative effects 0.59 7
Immersive tendencies questionnaire 0.79 18 All Participants (N = 41)
Free-Response Comments
In the paper-and-pencil questionnaire, participants were afforded two
opportunities to provide written free-response comments. The first of these was part of the end of the Temple Presence Inventory and was presented before the Immersive Tendencies Questionnaire. The prompt read, “Please use the space below to provide your comments about the media experience:”. The second of these was part of the ITC-Sense of Presence Inventory and was presented at the end of the questionnaire. The prompt read, “If there is anything else you would like to add, please use the space below:”. All but 9 participants provided a response for at least one of the prompts. No analyses were conducted on these comments, but they were transcribed literatim and are included in Appendix E.
Table 17
Means of Dependent Variables
Mute (n = 20) Sound efffects only (n = 21) Total (N = 41)
Self-Assessment Manikin 2.65 (0.93) 2.90 (0.70) 2.78 (0.82)
TPI spatial presence 2.86 (1.16) 2.73 (0.91) 2.79 (1.03)
Passive interpersonal presence 3.35 (1.60) 3.27 (1.35) 3.31 (1.46)
Active interpersonal presence 3.05 (1.51) 3.05 (1.56) 3.05 (1.52)
TPI engagement 4.52 (1.17) 3.97 (1.04) 4.24 (1.13)
Social richness 4.09 (1.32) 4.40 (1.18) 4.25 (1.24)
ITC-SOPI spatial presence 2.55 (0.70) 2.55 (0.73) 2.55 (0.71)
ITC-SOPI engagement 3.37 (0.72) 3.58 (0.73) 3.48 (0.73)
Ecological validity/naturalness 1.92 (0.72) 2.06 (0.74) 2.01 (0.72)
Negative effects 1.78 (0.68) 1.64 (0.52) 1.72 (0.60)
M (SD)
Discussion
Main Hypotheses
As predicted, the treatment had a significant effect. However, contrary to the initial hypothesis, this effect was in the opposite direction anticipated. That is to say, participants who played with no sound at all experienced significantly less engagement (as measured by the Temple Presence Inventory) than did those who played with sound effects only. No other significant effects of condition were detected.
One possible explanation for the reversed effect is that sound effects induced more extrinsic load than germane load, thereby inhibiting participants’ ability to allocate cognitive resources towards experiencing engagement. That is to say, with fewer
distractions, a player may focus better on the task at hand. Another explanation is that the sound effects were such unexpected forms of feedback that participants found this
sensation jarring. However, it is important to note that while the full model indicated only multivariate significance, a reduced model and additional post hoc ANCOVA was
necessary to pinpoint which variable was influenced. Each additional test increases the chance of false positive Type I error.