Formation of
71
Ge via Thermal
Neutron Capture
Author:
Max
Hays
Advisor:
Dr. Reyco Henning
Signature:
April 23, 2014
Abstract
In this work, the formation rate of 71Ge for a pure germanium sample given a typical environmental neutron flux is examined. This was done using two different methods. The first method involved Monte Carlo simulations of a HPGe PPC detector known as MALBEK interacting with background thermal neutrons. The second method involved an analysis of experimen-tal 71Ge activity data obtained using MALBEK with an estimation of the number of thermal neutrons that MALBEK was exposed to over a 68 hour period. The two71Ge formation rate values for the first and second methods
Contents
1 Introduction 2
2 Background and Experimental Setup 2
2.1 Germanium Detectors . . . 2
2.1.1 Detector Physics . . . 2
2.1.2 The MALBEK Detector . . . 3
2.2 Simulations . . . 4
2.2.1 Geant4 . . . 4
2.2.2 The MALBEK Detector Simulation . . . 5
3 Data Analysis 9 3.1 Empirical Data . . . 9
3.1.1 Estimation of Thermal Neutron Flux . . . 9
3.1.2 MALBEK Data . . . 9
3.2 Simulations . . . 14
3.2.1 0.025 eV Neutron Simulations . . . 14
3.3 Comparison of Empirical and Simulated Data . . . 16
1
Introduction
In any rare-event search experiment, the characterization of background sources is of the utmost importance. This work focuses on aspects of the free neutron background interacting with germanium detector-based experiments. In germa-nium detectors, neutrons that are captured in the germagerma-nium crystal can create radioactive isotopes that decay away exponentially. As these isotopes decay, they produce signals that are picked up by the detector as background. One isotope of particular interest is 71Ge. 71Ge is readily created by thermal neutron capture, and has a relatively long half-life of 11.43 days. 71Ge decay manifests through its characteristic 10.4-keV peak in the energy spectrum of an HPGe detector.14
The main goal of this work is to determine the rate of formation of 71Ge from a typical environmental neutron flux. Two different methods were employed. One method used Monte Carlo simulations of a broad energy germanium detector known as MALBEK. By examining the number of 71Ge isotopes created per in-coming neutron, a value for the rate was obtained. The second method involved analysis of data from MALBEK itself. By coupling an estimation of the thermal neutron flux that interacted with the detector during a certain time period with data from the detector itself, an experimental value for the rate of71Ge formation was obtained. A comparison between the simulated and empirical values was then performed to check for consistency.
2
Background and Experimental Setup
2.1
Germanium Detectors
2.1.1 Detector Physics
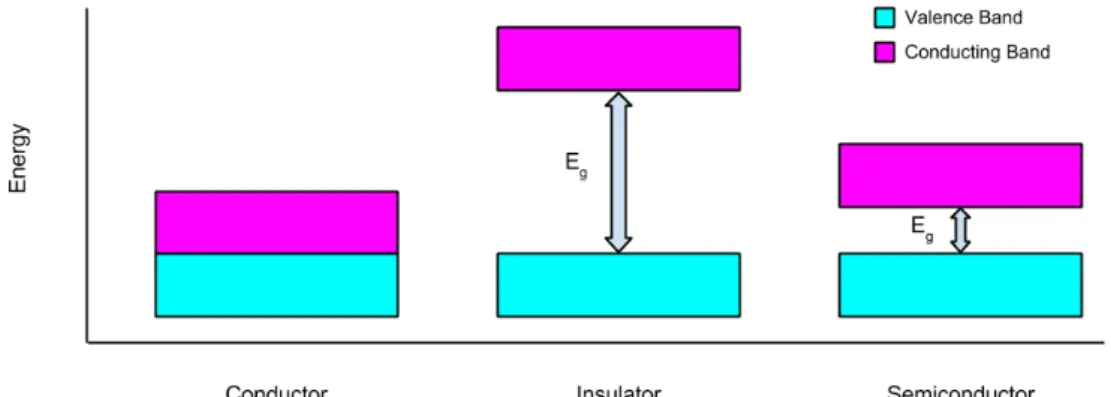
all as illustrated in Fig. 1. Insulators have a large band gap energy (∼ 10 eV), so an electron requires at least this much energy to become delocalized and thus conducting. Semiconductors have a small band gap energy (∼ 1 eV), so it is pos-sible for electrons to undergo thermal excitation into the conducting band. When an electron is excited from the valence band to the conducting band, it creates a positive “hole” in the valence band. These holes can move in the lattice and serve as conducting charge carriers. Semiconductors can be modified by doping with either donor or receptor atoms. Receptor atoms have one less electron and thus create a hole in the lattice structure. Donor atoms have one more electron and create lower energy states in the conduction band.11 Semiconductors doped with receptor atoms are known as p-type and semiconductors doped with donor atoms are known as n-type.
High purity germanium (HPGe) is defined as germanium with impurity con-centrations of 1010 atoms/cm3 or lower.12 HPGe is a semiconductor with a band gap energy of 0.67 eV.10 Various types of germanium detectors exist, but the one used in this work was a HPGe PPC detector, the geometry of which can be seen in Fig. 2. PPC detectors use p-doped germanium as the main body of the detector, with n and p contacts at the locations shown.9 A positive voltage is established at the n contact with respect to the p contact. When a gamma ray strikes an elec-tron, the kinetic energy of the electron is used to create electron-hole pairs. These charges are then swept out of the detector by the applied voltage and collected as signal.12
2.1.2 The MALBEK Detector
The empirical data in this work was collected using a 465-g broad-energy HPGe PPC detector manufactured by Canberra Industries, nicknamed MALBEK.9 The “broad energy” classification indicates that the detector is sensitive in the 3 keV to 3 MeV energy range.2 MALBEK is located at the Kimballton Underground Research Facility near Blacksburg, VA. KURF itself is housed in the active Kim-ballton limestone mine.
Figure 1: Illustration of band gaps for different types of materials. Eg is the band gap energy.
surface, cosmogenic isotopes were created in the detector crystal via thermal neu-tron capture. In this work, analysis was performed on two data sets that were taken using MALBEK after it returned to KURF on 10/28/11. The first data set was taken from 11/02/11 to 11/14/11, and the second data set was taken from 11/15/11 to 8/29/12.9 By extracting the activity curves from these two data sets, an experimental value for the initial number of71Ge isotopes was obtained (section 3.1.2).
2.2
Simulations
2.2.1 Geant4
All simulations were performed with Geant4, a Monte Carlo particle physics frame-work developed at CERN.3 Geant4 allows users to simulate a wide range of phys-ical processes in customizable geometries through the use of conventional C++ code structure. In order to create a Geant4 executable, the user must supply the specifics of the geometry to be simulated, how primary particles should be generated, and the physics models to be used.
Figure 2: Illustration of an HPGe PPC detector. A positive voltage is established between at the n contact with respect to the p contact. The detector used in this work had a diameter of 60.6 mm and a height of 30.0 mm.9
a change in the state of a particular particle. Steps are always associated with a particular physical process, be it a particle transport process or an interaction.
An event is the generation of one primary particle and the subsequent calls to the stepping algorithms, including both the stepping of the primary particle as well as all secondaries generated. Finally, a run is the set of events that occur during one execution of the Geant4 program.
The most conventional way for the user to pull information out of a Geant4 simulation is through the use of user action classes. These action classes tell the application how to behave for each step, event, or run. For instance, in a user stepping action instantiation, the program might be told to histogram the particle energy if the particle being stepped is a neutron inside a sensitive detector volume.
2.2.2 The MALBEK Detector Simulation
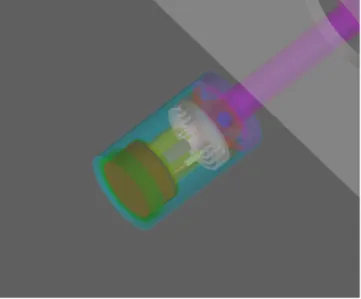
material and shape. As a whole, the MALBEK geometry was centered at the origin of the world volume. An OpenGL representation can be seen in Fig. 3. The germanium crystal is the squat, orange cylinder.
Primary Particle Generation Geant4 requires the user to specify the type, position, direction, and energy for each primary particle. For the simulations in this work, all primary particles generated were neutrons. Each neutron was provided with a random position vector ~x = R ~r1 and a random direction vector
~
p = A(θ, φ)r~2. R is a radius value and A(θ, φ) is a three dimensional rotation matrix. The algorithm for choosing r~1, ~r2, θ, and φ was as follows:
1. Choose a random point (x1, y1, z1)
2. If x21+y12+z12 <1, then r~1 = (x1, y1, z1)/
p
x2
1+y21+z12 and move to step 3. Else, return to step 1.
3. ~x=R ~r1
4. Choose a random point (x2, y2, z2)
5. If x22+y22+z22 <1, thenr~2 = (x2, y2,−|z2|) and move to step 6. Else, return to step 4.
6. θ= cos−1(z1), φ= sin−1( y1
sin(θ))
Figure 3: OpenGL representation of the MALBEK geometry used in the Geant4 simulations. The length of the cyan cylinder (the end cap) is 134 mm.
Physics In a Geant4 program, it is necessary to define the particles to be tracked and the physics to be used by instantiating a physics list. It is possible to create a physics list from scratch, but Geant4 comes with several pre-created physics list. The one used in this work was called QGSP/BERT/HP.1 This physics list uses the quark gluon string model (QGSP) for hadronic processes above 12 GeV, the Low Energy Parametrized model (LEP) between 9.5 and 25 GeV, and the Bertini cascade model (BERT) below 9.9 GeV. HP indicates that neutrons below 20 MeV are treated with high precision using a combination of measured and calculated cross-sections. This is one of the recommended physics lists for detailed neutron transport, which was critical for this work.1
User Stepping Action Most data from the simulations were obtained through the use of the Geant4 user stepping action class and built-in Geant4 histogram cre-ation functions. In user stepping action, the following algorithm was implemented for each step:
1. If the particle being stepped is a neutron and the process associated with the step is a neutron capture, loop over the secondaries generated along the step.
2. If the secondary is a nucleus, increment the histogram bin corresponding to the atomic number.
3. If the secondary is an isotope of germanium, increment the histogram bin corresponding to the atomic mass.
3
Data Analysis
All histogram analysis was performed using the ROOT framework developed at CERN.4
3.1
Empirical Data
3.1.1 Estimation of Thermal Neutron Flux
In order to estimate the number of thermal neutrons that interacted with MAL-BEK during its trip to Canberra, it was necessary to research the average thermal neutron flux at the surface of the Earth. Work done by Dirk et al. in 2003 found this value to be 4 neutrons/cm2.h .7 To be consistent with the simulations, it was necessary to calculate the neutron flux into a sphere of surface area 4π(0.5m)2. Multiplying this value with the total trip time of 68±1 hours,9 the number of neutrons that entered the 0.5 m sphere around MALBEK was estimated to be:
# neutrons = ΦthermalN ×Ssphere×ttrip = 8.5±4.3×10⁶ (1)
Although data acquisition did not begin immediately after MALBEK was brought back underground, it was not necessary to include this time in the above estimation since the thermal neutron flux underground is 3 orders of magnitude smaller than that on the surface.5
3.1.2 MALBEK Data
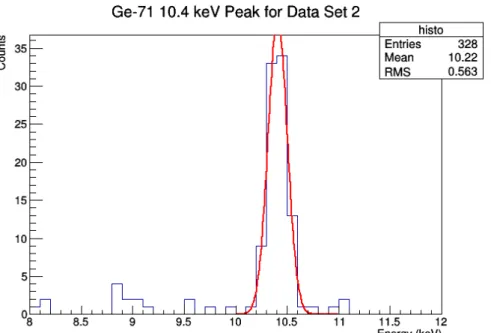
Analysis Procedure The same basic procedure was used in the analysis of both data sets. In order to extract the activity curve, detector event timing data had to be coupled with event energy data. Specifically, the number of events correspond-ing to the 10.4 keV 71Ge peak as a function of time had to be determined. Events were binned into 1-day time periods for data set 1 and 5-day time periods for data set 2. The energy spectrum was then drawn for each time period individually (see figures 5 and 7), and the number of events corresponding to the 71Ge peak were found using two different methods. The first method was to take a gaussian fit of the 10.4 keV peak, integrate over the fit, and divide by the energy bin width. The second method was to take all counts in the 10.0-10.8 keV energy range as part of the 10.4 keV71Ge peak. An example of this fit can be seen in Fig. 5. On average, this range covered 3.25σ of the gaussian fit. The second method was preferred as it provided a simple uncertainty value for each bin through the square root of the number of counts, and was used to calculate all experimental values. The number of counts was then plotted against time and the fit given by equation 4 was applied (see figures 6 and 8). In order to extract the initial amount of71Ge using this fit, it was necessary to examine the equation governing activity:12
A(t) = N0λe−λt (2)
Where N0 is the initial number of isotopes and λ is the decay constant. The fit function applied to the count vs. time data was of the form
f(t) =aebt+cedt+k (3)
The second exponential term was included to take the decay of 68Ge into account. This term was particularly relevant for data set 2, since the half life of 68Ge (271 days)13 is on the same timescale as data set 2’s range and it also produces a peak at 10.4 keV. The k term was included to account for the constant background around the71Ge peak. Experimental values for the initial number of isotopes and the decay constant by exploiting their relation to the fit parameters:
λ=−b N0 =−
a be
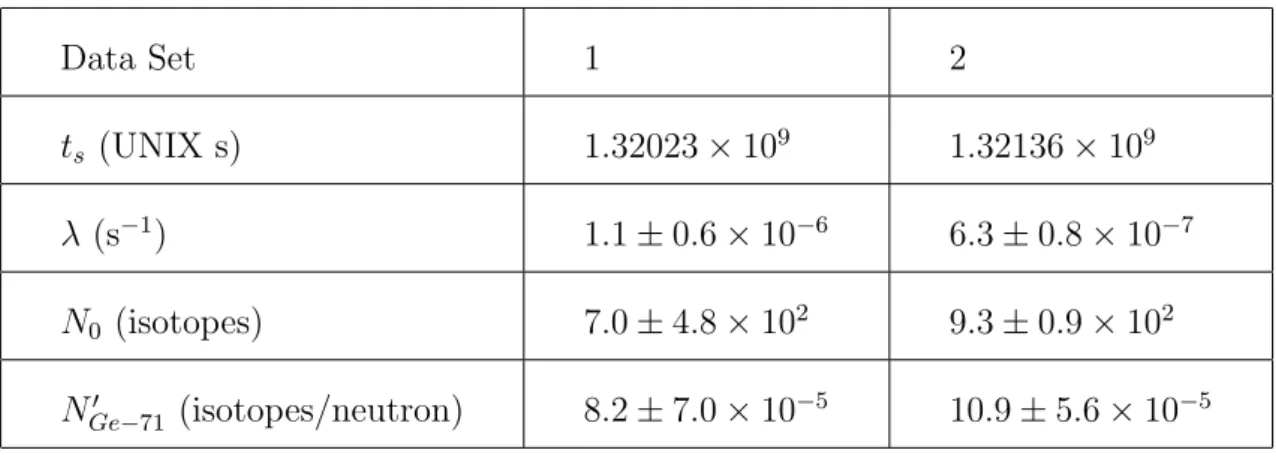
tu is the time at which the detector was brought back underground (10/28/2011 at 12:00 pm).9 The accuracy of the analysis was then assessed by comparing the value of λ with the literature value of 7.018×10⁻⁷ per second.14 Experimental data can be viewed in Table 1.
Analysis of Data Set 1 For the analysis of data set 1, the events were binned according to twelve UNIX time ranges with width 1 day each. Fig. 5 shows the energy spectra with the applied gaussian fit for the first day. The activity data along with the applied exponential fit for the count method is shown in Fig. 6. Calculated values of the initial number of isotopes and the71Ge decay constant for data set 1 can be viewed in Table 1. There is agreement between the experimental and literature values of the decay constant for data set 1, but this is due in part to the large uncertainty associated with the experimental value.
Analysis of Data Set 2 During the periods 3/12/12 - 4/9/12 and 7/4/12 - 7/8/12, MALBEK lost power and no data was taken. As such, fitting had to be done more carefully so as to not give full weight to half-empty bins. For the analysis of data set 2, the time bin width was 5 days. Fig. 7 shows the energy spectra with the applied gaussian fit for the first 5 day period. The activity data along with the applied exponential fit for the count method is shown in Fig. 8. Calculated values of the initial number of isotopes and the71Ge decay constant for data set 2 can be viewed in Table 1. There is agreement between the experimental and literature values of the decay constant for data set 2, indicating the veracity of the analysis.
Calculating the Experimental Rate of 71Ge Formation To get an exper-imental value for the rate of formation of 71Ge, the estimation of the number of neutrons that entered the 0.5 m sphere around MALBEK during its trip (section 3.1.1) and the calculated initial number of71Ge isotopes were combined as follows:
NGe0 −71 = N0
# neutrons (isotopes/neutron) (5)
Figure 5: The 8-12 keV range for events taken during the first day of collection. A gaussian fit has been applied to the 10.4-keV71Ge peak.
Figure 7: The 8-12 keV range for events taken during the first 5 days of collection. A gaussian fit has been applied to the 10.4-keV71Ge peak.
Data Set 1 2
ts (UNIX s) 1.32023×10⁹ 1.32136×10⁹
λ (s−1) 1.1±0.6×10⁻⁶ 6.3±0.8×10⁻⁷
N0 (isotopes) 7.0±4.8×10² 9.3±0.9×10²
NGe0 −71 (isotopes/neutron) 8.2±7.0×10⁻⁵ 10.9±5.6×10⁻⁵ Table 1: Experimental values (λlit= 7.018×10⁻⁷ per second)14
3.2
Simulations
3.2.1 0.025 eV Neutron Simulations
In order to extract the rate of formation of 71Ge given a thermal neutron flux, a one trillion event simulation of MALBEK was run. All of the primary neutrons for this simulation were given an initial energy of 0.025 eV, corresponding to thermal energies. During this simulation, 9.672×10⁷ 71Ge nuclei were created. As such, the rate of 71Ge formation per neutron was found to be
NGe0 −71= 9.672±0.001×10
7 71Ge nuclei
1012neutrons = 9.672±0.001×10
−571Ge nuclei neutron (6)
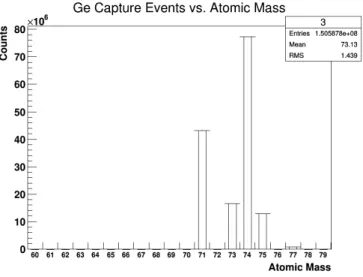
Monte Carlo data was also taken for capture events occurring on all isotopes of germanium. Fig. 10 shows a histogram of count vs. atomic mass. According to this data, the four most frequently created isotopes are74,71,73,75Ge. 74Ge and73Ge are both stable, so they will not cause background signals. 75Ge is unstable with a half-life of 82.78 minutes.13 Because its half-life is so short, background signals due its decay will disappear relatively quickly.
Figure 9: Atoms produced in 0.025 eV neutron capture events.
3.3
Comparison of Empirical and Simulated Data
A summary of the calculated rates of 71Ge formation is displayed in Table ??. 71Ge formation rates in isotopes/s and isotopes/s.kg are also provided for
MAL-BEK in a typical environmental neutron flux environment. In the calculation of these per second values, the geometric factor associated with the 0.5 m sphere has been scaled out using the average thermal neutron flux value 4±2 neutrons/cm2.h (section 3.1.1). The per kilogram values were calculated using the measured MAL-BEK mass of 0.465 kg.9 As can be seen in the table, there is agreement between the empirical and simulated rates. There are several possible sources of error in these values. The most likely source of error is the thermal neutron flux esti-mation (section 3.1.1). The thermal neutron flux varies drastically depending on many factors including the materials in the immediate environment, the location on Earth’s surface, and the altitude. However, it is hard to imagine a more accu-rate estimation of the number of neutrons that interacted with MALBEK without measuring the thermal neutron flux directly.
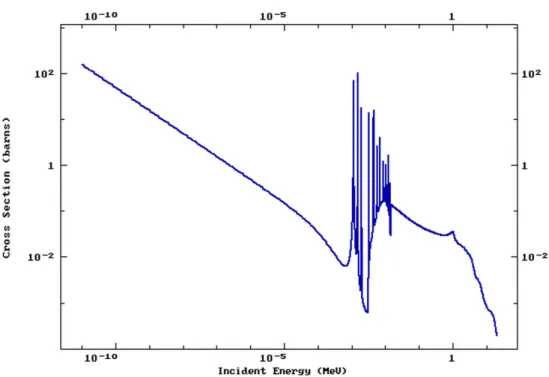
Another source of uncertainty is the exclusion of high energy neutron interac-tions from both the simulation and the neutron flux estimation. While high-energy neutrons will be less common, some high-energy capture events will still occur. Any Geant4 simulation will have errors associated with inaccurate particle interaction cross-sections. Geant4 pulls much of its cross-section data from the Evaluated Nu-clear Data Files as maintained by the Cross Section Evaluation Working Group.3 The ENDF value for 0.025 eV neutron capture on 70Ge is ∼ 3.5 b.6
Finally, there is error in the extraction of the activity curve from the MALBEK data. While there was agreement in the experimental and literature value of the decay constant for both data sets, there were large statistical uncertainties asso-ciated with the fits. The especially large uncertainty in the calculated formation rate for data set 1 is due primarily to the small amount of data that available for this time period.
Data Set 1 Data Set 2 Simulation
Rate in71Ge/n 8.2±7.0×10⁻⁵ 10.9±5.6×10⁻⁵ 9.672±0.001×10⁻⁵ Rate in71Ge/s 2.8± ×2.010−3 3.8±0.4×10⁻³ 3.4±1.7×10⁻³ Rate in71Ge/s.kg 6.1±4.3×10⁻³ 8.2±0.8×10⁻³ 7.3±3.6×10⁻³ Table 2: Calculated rates of71Ge formation for MALBEK in a typical environmen-tal neutron flux in units of isotopes/n, isotopes/s, and isotopes/s.kg. “n” indicates neutrons entering the 0.5 m sphere around the detector.
4
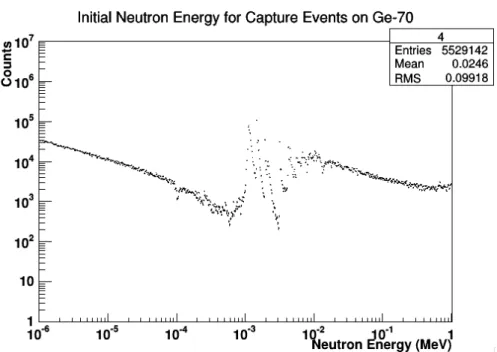
Appendix: Variable Energy Simulations
Figure 11: Initial energy of neutrons undergo capture processes for variable energy simulations.
Figure 13: The neutron capture cross section for 70Ge as a function of energy.6
References
[1] Status of Geant4 Hadronic Physics for the Simulation of LHC Experiments at the Start of the LHC Physics Program, July 2010.
[2] Canberra: Broad Energy Germanium Detectors @ONLINE, 2013.
[3] Geant4 @ONLINE, March 2014.
[4] Root: A Data Analysis Framework @ONLINE, March 2014.
[5] P. Belli, R. Bernabei, S. d’Angelo, M.P. Pascale, L. Paoluzi, R. Santonico, N. Taborgna, N. Iucci, and G. Villoresi. Deep underground neutron flux measurement with large BF3 counters. Il Nuovo Cimento A, 101(6):959–966, 1989.
Hale, S. Hoblit, S. Holloway, T.D. Johnson, T. Kawano, B.C. Kiedrowski, H. Kim, S. Kunieda, N.M. Larson, L. Leal, J.P. Lestone, R.C. Little, E.A. McCutchan, R.E. MacFarlane, M. MacInnes, C.M. Mattoon, R.D. McKnight, S.F. Mughabghab, G.P.A. Nobre, G. Palmiotti, A. Palumbo, M.T. Pigni, V.G. Pronyaev, R.O. Sayer, A.A. Sonzogni, N.C. Summers, P. Talou, I.J. Thomp-son, A. Trkov, R.L. Vogt, S.C. van der Marck, A. Wallner, M.C. White, D. Wiarda, and P.G. Young. ENDF/B-VII.1 nuclear data for science and technology: Cross sections, covariances, fission product yields and decay data.
Nuclear Data Sheets, 112(12):2887 – 2996, 2011. Special Issue on
ENDF/B-VII.1 Library.
[7] J.D. Dirk, M.E. Nelson, J.F. Ziegler, A. Thompson, and T.H. Zabel. Terres-trial thermal neutrons. Nuclear Science, IEEE Transactions on, 50(6):2060– 2064, Dec 2003.
[8] M Bauer et al. Mage: a Monte Carlo framework for the Gerda and Majo-rana double beta decay experiments. Journal of Physics: Conference Series, 39(1):362, 2006.
[9] Padraic Finnerty. A Direct Dark Matter Search with the MAJORANA
Low-Background Broad Energy Germanium Detector. PhD thesis, University of
North Carolina, Chapel Hill, NC, 2013.
[10] G. Gilmore and J. Hemingway. Practical Gamma Ray Spectroscopy. Wiley & Sons, 1996.
[11] Charles Kittel. Introduction to Solid State Physics. Wiley & Sons, 2005.
[12] Glenn F. Knoll. Radiation Detection and Measurement, 3rd Edition. Wiley & Sons, 2000.
[13] R. Sagane. Radioactive isotopes of Cu, Zn, Ga and Ge. Phys. Rev., 55:31–38, Jan 1939.