IN VITRO SUSTAINED DELIVERY OF ATENOLOL, AN
ANTIHYPERTENSIVE DRUG USING NATURALLY
OCCURRING CLAY MINERAL MONTMORILLONITE AS A
CARRIER
Seema
[a]and Monika Datta
[a]*Keywords: Atenolol, Montmorillonite, Adsorption isotherm, Sustained delivery
In the present study, a naturally occurring clay mineral, Montmorillonite, (Mt) has been explored as a carrier for an antihypertensive drug, atenolol. The effect of pH, time and initial drug concentration on drug loading capacity of Mt has been evaluated. The adsorption isotherm was fitted by the Langmuir model and follows the pseudo-second-order kinetics. The synthesized Mt-atenolol complexes were characterized by XRD, FTIR, TGA, DSC etc. XRD data indicates the intercalation of atenolol within the Mt layers. The release profile of the atenolol from Mt-atenolol complexes is compared with the pure atenolol, in simulated gastric and intestinal fluids. The release behaviour of atenolol from Mt-atenolol complexes appears to be in sustained manner over a period of 24 hours and reaches upto 40% and 27% in simulated gastric and intestinal fluids respectively. As compared to pure atenolol, extended gastric retention time was observed for Mt-atenolol complexes indicative of the increasedextent of absorption and bioavailability of the drug. Various kinetic models were used to elucidate the drug release mechanism, the best fitting was found for Higuchi and Korsmeyer-Peppas model. The synthesized Mt-atenolol complexes have the potential for developing in to a sustained release formulation for oral drug delivery. Thus, proposing a promising formulation for oral sustained drug delivery of atenolol.
*Corresponding Author Fax: +91-01127666605
E-Mail: [email protected]
[a] Analytical Research Laboratory, Department of Chemistry, University of Delhi, Delhi-110 007, India
INTRODUCTION
Hypertension is one of the major causes of disability and death in the world. Today, approximately 1 billion people worldwide suffer from high blood pressure, and the number is expected to reach to 1.56 billion by the year 2025.1 It is a chronic disease which requires treatment around the clock.
Atenolol, β-1 cardio selective adrenergic receptor blocker, is widely used in the treatment of hypertension.2 The drug is orally administered as 25 mg tablets once or twice daily with total daily doses ranging from 25 to 100 mg.2 Atenolol is soluble in water (26.5 mg ml-1) with poor membrane permeability and reported half-life of 6-7 hours.
Administration of conventional tablets of atenolol has been reported to exhibit fluctuations in the blood plasma drug concentration, resulting either in manifestation of side effects or reduction in drug concentration at the receptor site.3-4 It is considered a drug with low jejunal permeability and a low extent of absorption; therefore it has an oral bioavailability of about 50%. Thus, it seems that an increase in gastric residence time may increase the extent of absorption and bioavailability of the drug.5-7 In view of these facts, this drug can be considered as a suitable candidate for preparation of controlled and sustained release dosage formulation with enhanced gastric retention time. Studies have been reported on regulation of atenolol drug release by
formulations such as mucoadhesive, extended release and floating tablets, 5-9 nanoparticles10 hydrophilic matrices,11-13 and transdermal drug delivery systems.14
Recently, natural clay mineral, especially Montmorrilonite (Mt) has attracted considerable attention as a carrier for sustained drug delivery.15-17 Mt is a 2:1 layered smectite clay mineral composed of two SiO4 tetrahedral layers sandwiching a central Al octahedral layer as shown in Figure 1.
Figure 1. Structure of montmorillonite (Mt) (reproduced from the work of Jacob G., Reynolds et al.Clays and Clay Minerals, 2012, 60(6), 599–609.)
capacity, and drug-carrying capabilityalong the (001) axis. Mt can intercalate various protonated and hydrophilic organic molecules, which can be released in a controlled manner by replacement with other kind of cations in the release media.18-20 Drug intercalated Mt formulations offer a novel route to prepare organic and inorganic complexes that contain advantageous properties of both the inorganic host and organic guest in a single material.21-23 Mt also known as medical clay as it is a potent detoxifier can adsorb dietary and bacterial toxins.24-26
There is no report, to the best of our knowledge on the preparation of atenolol intercalated Mt complexes for the sustained delivery. Therefore, the aim of our work was to undertake a systematic and detailed investigation on adsorption and optimization of conditions for preparing Mt-atenolol complexes for sustained release formulations. The effect of pH, time and initial drug concentration on drug intercalation capacity of Mt has been evaluated. The adsorption isotherm was better fitted by the Langmuir model and followed the pseudo-second-order kinetic model. The complexes were characterized by XRD, FTIR, TGA and DSC techniques. Atenolol was intercalated into Mt via ion exchange process increasing the basal spacing to 15.4 Å. Release of the intercalated atenolol was studied in simulated gastric and intestinal fluids at 37°C for a period of 24 hours and sustained release of atenolol from Mt-atenolol complex was observed. Drug release mechanism was found to follow the Higuchi and Korsmeyer-peppas model in simulated gastric and intestinal fluids respectively.
Thus the developed Mt-atenolol complexes have the potential to be used as an oral and sustained delivery of atenolol for the hypertension patients requiring medicinal treatment around the clock.
EXPERIMENTAL
Materials
Montmorillonite (KSF) and atenolol (purity >98%) was procured from Sigma Aldrich (USA). Analytical grade sodium hydroxide, potassium dihydrogen phosphate and potassium chloride for the preparation of drug release media were obtained from Merck Chemicals Ltd (Germany). All other reagents whether specified or not were also of analytical grade. Double distilled water filtered with 0.45 μ membrane (milipore) was used throughout the experimental work.
Study of atenolol-montmorillonite (Mt) interaction
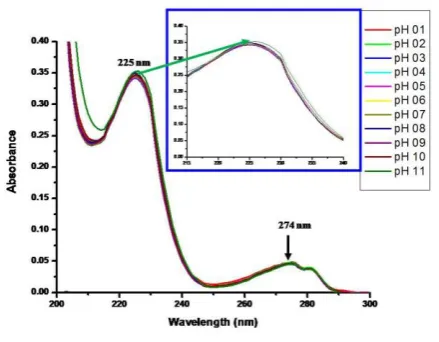
In order to study the interaction of atenolol with Mt a batch process was selected. Initially, stabilitity of atenolol molecule as afunction of pH was evaluated in the pH range of 1-11. The obtained results indicate the stability of atenolol in the investigated pH range (Fig. 2).
In a further step, interaction of atenolol with Mt was investigated. Mt dispersion (1wt.%) was prepared by dispersing 1 g clay in 150 ml deionized water under vigorously stirring for 24 hours. 100 mg atenolol solution
(0.1% w/v) with its natural pH value of 9.6 was added drop wise into the Mt dispersion within 1 h at 25°C. The resultant Mt-atenolol dispersion shows decrease in the pH value from 9.6 to 2.3 because of the acidic nature of Mt. Therfore, the pH of the Mt-atenolol dispersion was maintained at 9.6 the actual pH of atenolol solution, with 0.1 M NaoH. The mixed reaction media was further stirred for 2 h, centrifuged, washed several times with double distilled water to remove the excess of atenolol on the surface, dried in the air and ground with mortar and pestle to obtain fine powder. The sample was designated as Mt-atenolol complex.
The encapsulation efficiency (EE) and drug loading (DL) capacity of atenolol in the Mt- atenolol complex was calculated by Eqn. 1 and 2, respectively in the supernatant recovered after centrifugation at 225 nm.
where
m1 -atenolol amount added initially
m2- atenolol in the supernatant
where
m3 - atenolol amount within the Mt-atenolol complex
m4 - total weight of Mt-atenolol complex obtained
The obtained UV results suggest that 73.8 mg of atenolol was intercalated within the Mt layers with drug content of 7.5% (w/w).
To investigate the interaction of atenolol with Mt XRD studies were performed on a powder X-ray diffractometer (XPERT PRO Pananlytical, model PW3040160, Netherland) the measurement conditions are mentioned under characterization section.
The obtained XRD results suggest the intercalation of atenolol within the interlayer region of Mt by ion exchange process, details are provided under the appropriate section.
Batch studies for intercalation of atenolol within Mt layers
In order to achieve maximum intercalation of atenolol within the interlayer region of Mt, effect of various parameters such as, contact time, pH and initial concentration of atenolol were investigated.27 Aqueous atenolol solutions (25 ml) were treated with 100 mg of Mt at different reaction conditions with continuous mechanical shaking (Khera instruments). After desired reaction time, Mt-atenolol dispersion was centrifuged with 10,000 rpm for 20 minutes at room temperature (Remi centrifuge).
1 2
(%) 100 (1)
1 m m EE m 3
(%) 100 (2)
4 m DL
The free atenolol concentration in the supernatant were determined using UV–visible spectrophotometer (Analytic Jena) at 225 nm from the Lambert-Beer’s plot and the percentage of the drug adsorbed (), being calculated from Eq. (3).
where Ci is the initial drug concentration (mg L-1) and Ce is the concentration of the drug (mg L-1) in the supernatant at the equilibrium stage. The amount of drug adsorbed qe (mg g-1); was calculated via the mass-balance relationship as per the Eq. (4)
where V is the volume of the reaction media (L) and m is the mass of Mt used for the studies (g). Influence of pH from 2-11 on the intercalation of atenolol within Mt layers were studied at 25°C for 2 hours at atenolol concentration of 200 mg L-1. For adsorption kinetics in the time period of 0.25 to 18 h, all the other parameters were kept constant (pH 8, atenolol concentration of 200 mg L-1 at 25°C). Adsorption equilibrium studies of atenolol in the concentration range of 40 to 720 mg L-1 were carried out using 100 mg of Mt at 25°C for a period of 2 hours at pH 8.
Characterizations
Powder X-ray diffraction (PXRD) measurements of Mt-atenolol complex was performed on a powder X-ray diffractometer (XPERT PRO Pananlytical, model PW3040160, Netherland) the measurement conditions were Cu K α radiation generated at 40 kV and 30 mA as X-ray source 2-40° (2θ) and step angle 0.01°/second. FTIR spectra of the Mt-atenolol complex recorded with an FTIR spectrophotometer (Perkin Elmer, Spectrum BXFTIR Spectrometer) using the KBr (Merck, Germany) disc method. Thermogravimetric analysis was carried out within 30 - 800°C at 10°C min-1 in nitrogen flow (TGA 2050 Thermal gravimetric Analyzer). UV–Visible absorbance of atenolol solutions was measured at λmax= 225 nm (UV–
Visible spectrophotometer Analytic Jena) equipped with a quartz cell having a path length of 1 cm. Differential scanning calorimetric studies were conducted on DSC instrument (DSC Q200 V23.10 Build 79). The samples were purged with dry nitrogen at a flow rate of 10 ml min-1 and the temperature was raised at 5°C min-1.
In vitro drug release profile and release kinetics
In vitro drug release studies of Mt-atenolol complex was conducted in a constant temperature bath with the dialysis bag technique.19 Buffer solution of pH 1.2 (simulated gastric fluid) was prepared by mixing 250 ml of 0.2 M HCl and 147 ml of 0.2 M KCL. Buffer solution of pH 7.4 (simulated intestinal fluid) was prepared by mixing 250 ml of 0.1 M KH2PO4 and 195.5 ml of 0.1 M NaOH. Dialysis sacs were
equilibrated overnight with the dissolution medium prior to experiments. Mt-atenolol complex equivalent to 25 mg of atenolol was taken in 5ml of buffer solution in the dialysis bag. Dialysis bag was dipped into the receptor compartment containing 100 ml dissolution medium, which was stirring at 37±0.5°C. The receptor compartment was closed to prevent the evaporation losses from the dissolution medium. The stirring speed was kept at 100 rpm. 5 ml of aliquots was withdrawn at regular time intervals and the same volume was replaced with a fresh dissolution medium. Samples were analyzed for released atenolol content by UV spectrophotometer at λmax = 225nm by using calibration plot of standard atenolol solutions in the same releasing media.
To analyze the in vitro release data, various kinetic models including Zero order, First-order, Higuchi and Korsmeyer – Peppas model has been used to describe the release kinetics.28-30
RESULTS AND DISCUSSION
Intercalation of atenolol at different pH values
To start with the experiment, stability of the atenolol molecule was investigated in the pH range of 1-11. It has been found that drug maintains its stability (Fig. 2) within the experimental pH range as there is no change in the absorption spectra of atenolol molecule was observed.
Figure 2. UV-Visible spectrum of aqueous atenolol solution (10 ppm) showing stability at various pH
The UV absorption spectra of atenolol show two absorption peaks at 225 nm and 274 nm corresponding to different electronic transitions of the molecule. In subsequent studies, wavelength of 225 nm has been selected for quantitative estimation of atenolol. The pH of the drug solution has always played a crucial role in intercalation process.20-22 The intercalation of atenolol in Mt was found to increase from 77 % to 94% (of 200 ppm drug solution) in the pH range of 2 to 8 and remains almost constant in the pH range of 8-10 (98% of 200 ppm) (Fig. 3).
e
i (3)
i
C C
C
e ( i e) (4)
V
q C C
m
Figure 3. Atenolol intercalation within Mt layers as a function of pH
This could be explained on the basis the pKa value of atenolol (pH 9.6) where atenolol exsist as 50:50:: protonated : neutral form (Fig. 4).31 At lower pH, decrease in intercalation of atenolol in the Mt lattice is attributed to the competition between the cationic drug and H+ ions present as exchangeable ion in Mt.19 However, with increase in pH, atenolol still exist in the protonated form and positive charge on the surface of the Mt decreases resulting in high adsorption of atenolol with Mt layers.
Figure 4. Protonated (a) and neutral (b) forms of atenolol
Effect of time on intercalation
Intercalation of atenolol in Mt is very rapid process, due to occurrence of ion-exchange reaction between the interlayer Na+ ions and cationic atenolol molecules at pH 8 (Fig. 5).
Figure 5. Effect of contact time on adsorption of atenolol on Mt, Mt = 0.1g; concentration of atenolol = 200 ppm; pH = 8; temperature= 25° C
Then, 96% of 200 ppm of atenolol was intercalated within 45 minutes of interaction time, which remained almost constant (95.6%) up to 6 hours and tends to decrease up to 92% in further 18 hours. In our studies, reaction time was set to 2 hours in order to avoid the partial intercalation in the succeeding experiments.
Kinetics of atenolol Adsorption
In order to optimize the design of an adsorption system of atenolol on Mt, it is important to establish the most appropriate correlations for the equilibrium data for the system. In this respect two kinetic models including pseudo-first order and pseudo-second order models have been applied to determine the adsorption mechanism. 32.33
Pseudo-first-order model
Pseudo-first-order equation can be expressed as below Eq. (5):
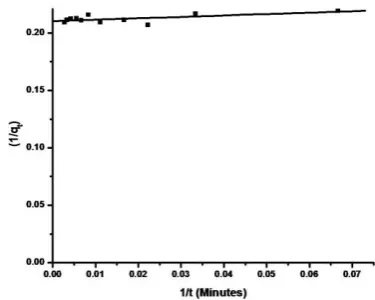
where k1 is the pseudo-first-order rate constant (min−1), qtis the amount of drug adsorbed (mg g−1) at different times t, q1 is the maximum adsorption capacity (mg g−1) for pseudo-first-order adsorption.33 Plots of 1/q
t versus 1/t for the adsorption of atenolol on Mt surface were employed to generate the intercept values of 1/q1 and the slope of k1/q1 (Fig. 6). The values of k1, q1 and the correlation coefficients are given in Table 1.
Figure 6. Pseudo first order kinetic model for atenolol adsorption on Mt surface (200 ppm, pH 8 and 25 °C)
Pseudo second order model
The pseudo-second-order kinetic equation can be represented as Eq. (6):
1
t 1 1
1 1 1
(5) k
q q t q
2
t 2 2 2
1
(6)
t t
q k q q
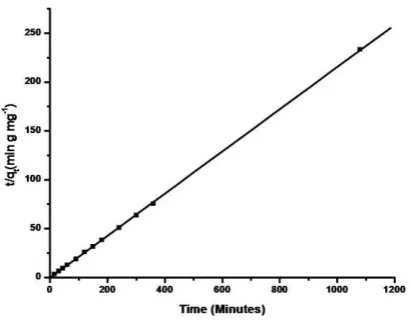
where k2 is the pseudo-second order rate constant; q2 is the maximum adsorption capacity (mg g−1) for the second order adsorption process.33 The plots of t/q
tversus t for atenolol adsorption onto Mt are given in Fig. 7. From the slope and intercept values, q2 and k2 values were calculated and the results are given in Table 1.
Figure 7. Pseudo second order kinetic model for atenolol adsorption on Mt (200 ppm, pH 8 and 25°C)
Table 1. Kinetic parameters for the adsorption of Atenolol on Mt surface
Effect of initial atenolol concentration on intercalation
At pH 8, the intercalation of atenolol within Mt layers is affected by its initial amount present in the solution. As the atenolol amount in the solution increases from 1 to 18 mg (40 - 720 mg L-1), the amount of atenolol intercalated within Mt layeres was increases from 0.96 mg to 8.5 mg with decrease in intercalation (%) from 96.6% to 47.3% (Fig. 8).
Figure 8. Effect of initial atenolol concentration on intercalation
Adsorption Isotherm for atenolol on Mt surface
The adsorption isotherm of atenolol on Mt surface obtained by plotting the atenolol amount adsorbed by Mt (qe mg g-1) vs equilibrium concentration of atenolol (C
e, mg/L) is shown in Fig. 9.
Figure 9. Adsorption isotherm of atenolol on Mt surface
The Langmuir (Eq. 7) and Freundlich (Eq. 8) adsorption isotherms were applied to evaluate the adsorption data which correspond to homogenous and heterogeneous adsorbent surfaces respectively.19,22,32 The equations can be expressed as follows:
where qe is the equilibrium atenolol concentration on the Mt surface (mg g−1), Ce is the equilibrium atenolol concentration in solution (mg L−1), qm the monolayer adsorption capacity (mg g−1), and KL is the Langmuir adsorption constant (L mg−1). In case of Freundlich adsorption isotherm, Kf (mgg−1) and nf are considered as relative adsorption capacity and adsorption intensity respectively. The values of qmand KLwere computed from the slope and intercept of the linear plot of Ce/qe versus Ce (Fig. 10)and are presented in Table 2. As can be seen linear form of Langmuir isotherms seems to produce a better fit in comparison with linear form of Freundlich isotherm (Fig. 11).
The essential characteristics of the Langmuir equation can be expressed in terms of a dimensionless separation factor RL as Eq. 9:
The value of RL indicates the shape of the isotherm to be either unfavourable (RL>1), linear (RL=1), favourable (0<RL<1) or irreversible (RL=0). The value of the factor of separation RL indicates the nature of the favourability adsorption process and its feasibility.
According to Freundlich equation, Kf values are 16.479 mg /g at 25˚C. It can be said that the values of nf equal to
Pseudo first order Pseudo second order
k1
min -1 q1
mg g-1
R12 k2
g mg min -1 q2
mg g-1 R22
0.5809 4.752 0.63835 0.082 4.634 0.99993
1
e e (7)
e m L m
ln e ln f ln e (8)
C C
q q K q
q K nf C
L
L i
1
(9) 1
R
K C
0.2809 is smaller than 1, reflecting the favourable adsorption.
Figure 10. Linear form of Langmuir adsorption isotherm for atenolol on Mt
Figure 11. Linear form of Freundlich adsorption isotherm for Atenolol on Mt
XRD Studies
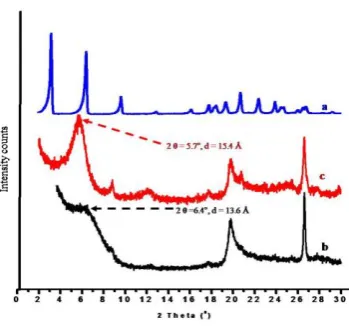
The XRD patterns of pristine Mt, pure atenolol and Mt-atenolol complex are shown in Fig.12. The XRD pattern of pure atenolol revealed several diffraction peaks which indicate its crystalline character.35 Mt showed a distinct diffraction pattern (001 plane) at 2θ = 6.4º representing a 13.6 Å thickness of the Mt layer.16
Table 2. Isotherm constant for Atenolol adsorption on Mt surface
Linear form of Langmuir
qm, mg g-1 86.355
KL 0.0448
RL 0.358
R 0.994
Linear form of Freundlich
Kf (mg/g) 16.479
nf 0.28094
R 0.0879
In case of Mt-atenolol complexes a shifting in 2θ value from A previous study,36 suggest stronger intensity of the basal spacing peak occurs when the drug molecule was intercalated within the Mt layers. 6.4° to 5.7° and a stonger intensity was observed. According to Bragg’s law, shifting in 2 value from higher diffraction angle to lower diffraction angle is because of the increase in d spacing. This indicates increase in the interlayer spacing upon intercalation of atenolol in the Mt layers from 13.6Å to 15.4 Å with the replacement of interlayer cation by atenolol. Subtracting the Mt layer thickness (9.6 Å) from the d spacing (15.4 Å) of the Mt-atenolol complex, the Mt layer thickness was estimated to be 5.8 Å. Diameter of Atenolol is 6.5Å and longest crossection diamension is 13.6 Å.37,38
Figure 12. XRD patterns of pure atenolol (a), Pristine Mt (b)and Mt-Atenolol complex (c)
This data suggest the replacement of interlayer hydrated cations with monolayer tilted vertical orientation of the atenolol molecules parallal to the Mt layers. 19, 21, 22
FTIR Studies
In order to confirm the presence of atenolol within the interlayer region of the Mt, FTIR spectra were recorded in the region 500-4000 cm-1.
The FTIR spectrum of Pristine Mt, Pure atenolol and Mt-atenolol complex prepared by ion exchange mechanism is shown in Fig. 13. In the FTIR spectrum of Mt, the band at 3428 cm-1 and 3629 cm-1 has been assigned to H-O-H stretching vibrations from interlayer water and Si-O-H stretching vibrations of the structural OH group. The absorption band at 1639 cm-1 corresponds to H-O-H bending water of crystallization. The characteristic band at 1049 cm-1 has been assigned to Si-O stretching vibration. The absorption bands at 527 cm-1 are strong bending vibrations corresponding to Al-O-Si.20,21,23
The IR spectrum of the pure atenolol displayed characteristic peaks at 3362 cm-1 , 3172 cm-1 and 1636 cm-1 due to O-H, N-H and C=O groups, respectively.39, 40 The peaks of 1240 cm-1 and 2972 cm-1 are due to alkyl aryl ether linkage and C-H stretching. The presence of functional groups of atenolol on the surface of Mt is verified by peaks at about 2957 cm-1 and 2883 cm-1, characteristic of the aliphatic C–H antisymmetric and symmetric vibrations respectively from the methylene group of atenolol. The presence of these bands in Mt-atenolol complex indicates the presence of atenolol in the Mt matrix. In case of Mt-Atenolol complex the vibrational bands at 3493 cm-1 have been assigned to the H-O-H stretching vibrations of the interlayer water but the intensity of this peak is almost vanish compared to Mt as the intercalation of the atenolol (as confirmed by XRD) into the interlayer region displaces the water molecules. A small band at 3350 cm-1 and1506 cm-1 corresponding to NH bandingvibration and benzene ring skeletal vibration respectively from Atenolol molecule was also appeared in Mt-atenolol complex. The presence of all these bands suggests the presence of organic cations atenolol in the interlayer region of the Mt layers. Besides these, a broad hump in the region of 3400 cm-1 to 3100 cm-1 probably due to hydrogen bonding between silanol group of Mt with OH and amine functional groups of Atenolol was observed. This also indicated that Atenolol interacts with the Mt layers.
TGA Studies
The TGA thermogram of pristine Mt (Fig14 a) shows high thermal stability in the temperature region of 30-700 °C with weight loss of 10% from 30-150 °C corresponds to the evaporation of free water and water bound to the cations present within the interlayer. Weight loss in the temperature range from 600-750°C is due to the loss of hydroxyl groups in the aluminosilicate structure and at this point the structure of the Mt layers collapses,18 resulted in a strong endothermic peak in DTA curve of Mt at 80 ºC and broad endothermic peak at 600 ºC.22
The thermogravimetric profile of pristine drug atenolol (Fig. 14b) represents two thermal decomposition stages. In the DTA curve for pure atenolol, a sharp endothermic peak at 182 ºC was observed without any weight loss in TGA which corresponded to the melting point of atenolol.41 The drug show a sharp weight loss (~ 80%) at around 230-400 °C resulting in a strong endothermic peak in DTA curve at 297 °C followed by an small exotherm at 336 °C corresponding to decomposition of the ATN molecule.42 The TGA curves of Mt-atenolol complex (Fig 14c) shows the
20% weight loss with two consecutive stages due to the dehydration and decomposition in the temperature range of 20-200°C and 205-700°C, respectively.
Figure 14a. TGA-DTA curves of pristine Mt
Figure 14b. TGA-DTA curves of pure atenolol
The first weight loss (~3%) in the temperature region of 80-200°C corresponding to loss of surface adsorbed water was observed resulting in a small endotherm at 43 °C in DTA curve. The weight loss observed was smaller than the pristine Mt (~10%) because of the replacement of interlayer water with intercalated atenolol which supposed to be stable and does not show any weight loss upto 200°C.41 The second weight loss of 15% was associated in the range from 205°C to 697°C attributed to the decomposition of intercalated ATN resulting in the presence of exotherm at 346.5°C in DTA curve of Mt-atenolol complex, corresponding to the thermal degradation of atenolol.
DSC Studies
The DSC curves of pristine Mt (Fig.15a) presented a broad endothermic peak at 110°C, which was attributed to the dehydration of adsorbed water. The DSC thermograms of atenolol (Fig.15b) showed a sharp endothermic peak at 154°C indicating the melting point of atenolol.41 A broad endothermic peak at 295°C followed by an exothermic peak at 308°C represents the decomposition of atenolol.42
Figure 15a. DSC curves of pristine Mt
In case of Mt-atenolol complex (Fig.15c) a broad endotherm was appeared in the region of 60 °C to 140 °C which might be corresponds to the combined event for the melting of intercalated atenolol with dehydration of surface water. In the temperature region of 250 °C to 400 °C a broad endotherm might be related to the decomposition of atenolol within Mt layers was observed.
Drug Release Profile
The cumulative release profiles of pure atenolol and Mt-atenolol complex in simulated gastric fluid (HCl pH 1.2) and in simulated intestinal fluid (PBS, pH=7.4 ) at 37 °C for different durations are shown in Fig.16. Pure atenolol shows upto 73% and 64% release in HCl (pH 1.2 ) and PBS (pH 7.4) over a period of 2 hours which approaches to almost 90% over a period of 6 hours respectively.
However in case of Mt-atenolol complex a very sustained release of atenolol in HCl pH 1.2 (SGF) and PBS, pH=7.4 (SIF) was observed. Within initial 2 hours, only 18.2% and 7.3% of atenolol was released which approaches to 33.2% and 18.52% in 8 hours followed by an increase upto 47.5%
and 30.6% releas over a period of 24 hours in SGF and SIF, respectively (Fig.16). Atenolol release was greatly influenced by the pH of the releasing media.
Figure 15b. DSC curves of pure atenolol
Figure 15c. DSC curves of and Mt-atenolol complex
In vitro drug release data suggest that the synthesized Mt-atenolol complex are able to retain the high amount of atenolol in gastric media (pH 1.2) (the desired site of absorption) as compared to pure drug with the advantage of gradual drug release over a longer period of time. Being a weakly basic drug with a pKa value of 9.6 atenolol is expected to possess higher solubility and therefore a faster drug release rates at acidic pH than at basic pH media7.
Table 3. Release kinetics of Mt-Atenolol complex in simulated gastric fluid (HCl, pH 1.2) and intestinal fluid (PBS pH 7.4)
Figure 16. Release profile of pure atenolol and Mt-atenolol complex in simulated gastric fluid (HCl pH 1.2) and simulated intestinal fluid (PBS, pH 7.4)
Figure 17a. Zero order kinetic model of Mt-Atenolol complex in simulated gastrointestinal fluid
Figure 17b. First order kinetic model of Mt-Atenolol complex in simulated gastrointestinal fluid
Figure 17c. Higuchi kinetic model of Mt-Atenolol complex in simulated gastrointestinal fluid
Figure 17d. Korsmeyer - Peppas kinetic model of Mt-Atenolol complex in simulated gastrointestinal fluid
CONCLUSION
Atenolol sustained release formulation was prepared successfully using natural clay mineral Mt as a host to retard the drug release. Intercalation of atenolol within Mt layers confirmed by XRD, FTIR and TGA analysis.The adsorption isotherms of atenolol on Mt were fitted by the Langmuir model, and the adsorption kinetics followed the pseudo-second-order kinetic model. Drug release kinetics of this formulation correspond best to Higuchi’s model and korsmeyer-pappas model under simulated gastric and intestinal conditions respectively. In vitro drug release data suggest that the synthesized Mt-atenolol complex are able to retain the high amount of atenolol in gastric media (pH 1.2) (the desired site of absorption) as compared to pure drug with the advantage of gradual drug release over a longer
Release Media
Zero order
C=K0t
First order
logC=logC0-k1t/2.303
Higuchi
Q=KHt1/2
Korsmeyer-Peppas
Mt/M∞ = ktn
R2 K
0, h-1 R2 K1, h-1 R2 KH(1/2) R2 n Kkp, h-n
HCl pH 1.2 0.8928 1.1200 0.9299 1.9369 0.9736 7.5617 0.9717 0.4985 0.9911
period of time, thus reducing the multiple dosing and associated drug plasma fluctuation level. Thus the obtained results are proposing a new promising formulation potentially suitable as sustained delivery carrier of atenolol.
ACKNOWLEDGEMENT
We sincerely express our thanks to the Head, Department of Chemistry, Director, USIC, University of Delhi for providing instrumentation facilities, and UGC (major research project and RGNF) for providing financial assistance.
REFERENCES
1Hypertension etiology. Hypertension statistics [Online]. 2010
[Cited 2012 May 5]; available from:
http://www.healthstats.com/en/hypertension-statistics.
2Wander G.S., Chhabra S.T. , Kaur K., Suppl. JAPI, 2009, 57,
13-16.
3Vaithiyalingam, S. R., Sastry, S. V., Dehon, R. H., Reddy, I. K.,
Khan, M. A., Pharmazie, 2001; 56, 66-69.
4Sastry, S. V., Reddy, I. K., Khan, M. A.. J. Control. Release.
1997; 45, 121-130.
5Barhate S. D. , Patel K. M., Lokhande G. S. Der Pharmacia Lettre,
2011, 3(2), 34-38.
6Kulkarni, A., Bhatia, M., Iranian J. Pharm. Res., 2009, 8(1),
15-25.
7Thomas, L. M., Khalil, Y. I., Iraqi J. Pharm. Sci. 2011, 20(1),
70-79.
8Singh, B., Chakkal ,S. K.; Ahuja, N., AAPS Pharm, Sci. Tech.
2006, 7(1), E1-E10.
9Manivannan R., Chakole V., Int. J. Recent Adv. Pharm. Res., 2011,
3, 25-30.
10Singh, A., Deep, A., Int. J. Pharm. Res., 2011, 3(4), 59-62. 11Perez-Marcos, B., Iglesias, R., Gomez-Amoza, J. L., J. Control.
Release, 1991, 17, 267-276.
12Rouge, N., Allemann, E., Gex-Fabry, M., Pharm. Acta. Helv.,
1998, 73, 81-87.
13Vázques, M. J., Casalderrey, M., Duro, R., Eur. J. Pharm. Sci.,
1996, 4,39-48.
14Kim, J., Shin, S. C., Int. J. Pharm., 2004, 273, 23-27.
15Rodrigues L. A. S., Figueiras, A. C., Veiga, F., Freitas, R. M.,
Nunes, L. C. C., Filho, E. C. S., Leite, C. M. S., Colloids
Surfaces B: Biointerfaces, 2013, 103, 642–651.
16Iliescu, R. I., Andronescu, E., Voicu, G., Ficai, F., Covaliu, C. I.
R. I., Appl. Clay Sci., 2011, 52, 62–68.
17Madurai, S. L., Joseph, S. W., Mandal, A. B., Tsibouklis, J.,
Reddy, B. S. R., Nanoscale Res. Lett., 2011, 6(15), 1-8.
18Chen, Y. M., Zhou, A. N., Liu, B., Liang, J., Appl. Clay Sci.,
2010, 49(3),108–112.
19Joshi, G. V.; Kevadiya, B.D., Patel, H. A., Bajaj, H. C., Jasra
R.V., Int. J. Pharm., 2009, 374, 53–57.
20Meng, N., Zhou, N. L., Zhang, S. Q., Shen, J., Int. .J. Pharm.,
2009, 382, 45–49.
21Joshi, G. V., Patel, H. A., Bajaj, H. C., Jasra, R. V., Colloid.
Polym. Sci., 2009, 287, 1071–1076.
22Joshi, G. V., Kevadiya, B. D., Bajaj, H. C., Microporous
Mesoporous Mater., 2010, 132, 526–530.
23Chen B.Y.; Lee Y.H.; Lin W.C.;Lin F.H., Lin K.F., Biomed. Eng.
Appl., Basis Commun., 2006, 18(1), 30-36.
24Lee, Y. H., Kuo, T. F., Chen, B. Y., Feng, Y. K., Wen, Y. R:,
Lin, W. C., and Lin F. H., Biomed. Eng. Appl., Basis
Commun., 2005; 17, 72-78.
25Feng, S. S., Mei, L., Anitha, P., Gan, C. W. and Zhou, W.
Biomater., 2009; 30, 3297-3306.
26Dong, Y. and Feng, S. S., Biomater., 2005; 26, 6068-6076. 27Joshi, G. V.; Kevadiya, B. D., Bajaj, H. C., Microporous
Mesoporous Mater., 2010, 132, 526–530.
28Suvakanta Dash, S., Murthy, P. N., Nath, L. K., Chowdhury, P.,
Acta Poloniae Pharm. Drug Res., 2010, 67 (3) 217-223.
29Shoaib, M. H., Tazeen, J., Merchant, H. A., Rabia Ismail Yousuf
R. I., Pak. J. Pharm. Sci., 2006,19(2), 119-124.
30Paulo Costa, P., Lobo, J. M. S., Eur. J. Pharm. Sci., 2001,13,
123–133
31Vogelpoel, H., Welink J., Amidon, G. L., Junginger, H. E.,
Midha, K. K., Shah, V. P., Barends, D. M., J. Pharm. Sci.,
2004, 93( 8) 1945-1956.
32Yoldas Seki, Y., Yurdakoc, K., Colloids Surfaces A:
Physicochem. Eng. Aspects, 2009, 340, 143–148
33Ozcan, A. S., Ozcan, A., J. Colloid Interface Sci., 2004, 276, 39–
46.
34Lata, H., Gupta, R. K., Garg, V. K., Chem. Eng. Commun., 2008,
195, 1185–1199.
35Shahi S. R. , Shekhar D. Tribhuwan S. D., Tadwee I. K. , Gupta
S. K. , Zadbuke N. S. And Shivanikar S.S., Der Pharmacia
Sinica, 2011, 2 (5), 54-63.
36Rojtanatanya, S., Thaned Pongjanyakul T., Int. J. Pharm., 2010,
383,106–115.
37Rakic, V., Rajic, N., Dakovic, A., Aline, A., V., Microporous
Mesoporous Mater., 2013, 166, 185–194.
38Andrade, G. F., Soares, D. C. F., Raquel Gouvea, R., Sousa E. M.
B., Microporous Mesoporous Mater., 2013, 168, 102–110
39Nikolic, C. V., Nikolic, L. J., Stankovic, M., Kapor, A, Popsavin,
M., Cvetkovic, D., J. Serb. Chem. Soc., 2007, 72, 737-746.
40Novickis, R.W., Martins, M. V. S., Miranda, L. F., Ribeiro, R.
R., Silva, L., Munhoz, A. H., Adv. Sci. Technol., 2013, 86, 102-107.
41Pereira R. N., Valente B. R., Cruz, A. P., Foppa T., Murkami F.S.
Silva M. A. S., Latin Am. J. Pharm., 2007, 26 (3), 382- 386.
42Wesolowski, M., Barbara, R., J. Therm. Anal. Calorim., DOI
10.1007/s10973-013-3070-y