Chapter 5
Financial institutions and infrastructure
Banking sector
The banking sector holds capital above regulatory
requirements…
Locally incorporated banks operating in New Zealand, on average, hold levels of common equity Tier 1 (CET1) capital above regulatory minima (figure 5.1). CET1 is the highest quality of loss-absorbing capital, and the system-wide ratio as at December 2014 was 10.7 percent of risk-weighted assets (RWA). This level of high-quality capital also meets the 2.5 percent capital conversation buffer introduced at the start of 2014, which provides further loss-absorbing capacity in times of stress. Banks are allowed to operate inside the buffer but, if they do so, they will be subject to restrictions on distributions to shareholders. The Reserve Bank is conducting a review of its capital settings to ensure they appropriately reflect current and expected financial conditions (see chapter 6).
The banking system holds levels of capital, stable funding and liquid assets above regulatory requirements. It is important that these buffers are maintained in view of the significant financial system risks described in chapter 2. Banking system profitability has increased, supported by improving asset quality, cost containment, and asset growth.
Non-bank lending has grown modestly over the past year. Lending to households is a small share of the sector’s overall lending, and there are no signs of a material increase due to the loan-to-value ratio (LVR) speed limit imposed on the banking system.
The insurance sector is benefiting from falling reinsurance costs, but lower global interest rates are reducing investment income. The sector is making progress on processing claims related to the Canterbury earthquakes, but the estimated final cost continues to rise.
…but the structure of capital is changing.
At the individual bank level, the five largest banks all comfortably meet regulatory capital requirements (figure 5.2). In addition to the highest quality CET1 capital, most of these banks also hold legacy capital instruments that will no longer qualify as regulatory capital from 2016. To replace these instruments, banks have started issuing new non-common equity Basel III-compliant instruments that include suitable conversion and write-off provisions. It will be important that banks do not materially reduce their loss-absorbing capacity, in particular their CET1 capital ratios, as part of a broader capital rebalancing strategy. In addition, investors will need to understand fully the risks associated with these potentially more complex capital instruments as they are issued to the market.
Banks meet the regulatory requirements for stable
funding…
All locally incorporated banks are subject to a minimum core funding requirement of 75 percent of total loans and advances. A high level of core or stable funding reduces the amount of short-term wholesale funding that needs to be rolled over, insulating banks in the event of a disruption to funding markets. As at March 2015, the aggregate core funding ratio (CFR) stood at 86 percent (figure 5.3). The CFR can be met through bank capital, deposit funding (mainly retail deposits) and long-term wholesale market funding. Deposit, or non-market, funding currently accounts for approximately two-thirds of total core funding.
0 2 4 6 8 10 12 14 0 2 4 6 8 10 12 14 2000 2002 2004 2006 2008 2010 2012 2014 %
% Capital conservation buffer
Minimum Tier 1
Tier 1 capital ratio CET1 ratio Figure 5.1 Regulatory capital ratios – all locally incorporated banks (% of RWA)
Source: Registered banks’ Disclosure Statements.
0 2 4 6 8 10 12 14 0 2 4 6 8 10 12 14 Jun-13 Dec-13 Jun-14 Dec-14 Jun-13 Dec-13 Jun-14 Dec-14 Jun-13 Dec-13 Jun-14 Dec-14 Jun-13 Dec-13 Jun-14 Dec-14 Jun-13 Dec-13 Jun-14 Dec-14
ANZ ASB BNZ Westpac Kiwibank
% %
Tier 2 AT1
CET1 CET1 min+buffer
Total capital min+buffer Tier 1 min+buffer
Figure 5.2 Regulatory capital ratios – large banks
(% of RWA)
Source: Registered banks’ Disclosure Statements.
Deposit funding has grown at elevated rates for a number of years, and maintained relatively strong growth rates since the November Report
(see figure 2.1). As a result, banks have been able to accommodate domestic credit demand without a substantial increase in market funding. By sector, households are making by far the largest contribution to growth in NZD funding (figure 5.4). While household funding growth has remained strong, the rate of growth in business deposits has slowed since early 2014. Agricultural funding growth is likely to decline as cash flow pressures in the dairy sector intensify in the coming year.
…and exceed minimum liquid asset requirements.
Banks must also hold a sufficient amount of liquid assets to be able to address the projected ‘mismatch’ between cash inflows and outflows in the event of a period of financial stress, over one week and one month respectively. In aggregate, banks’ mismatch ratios are well above the ‘zero’ regulatory requirement (figure 5.5). The calibration of the Reserve Bank’s liquidity policy, including both mismatch ratio and core funding ratio requirements, will be reviewed in coming years given that the Basel Committee has recently finalised international standards for liquidity regulation. 50 60 70 80 90 100 50 60 70 80 90 100 2003 2005 2007 2009 2011 2013 2015 % %
Minimum CFR Core funding ratio (CFR)
Figure 5.3 Banking system core funding (% of loans and advances)
Source: RBNZ Liquidity Survey, RBNZ Standard Statistical Return (SSR). Note: The dotted line for the CFR is an approximation based on SSR data.
-2 0 2 4 6 8 -2 0 2 4 6 8 2006 2008 2010 2012 2014 % % Agriculture Households Business Figure 5.4 Annual growth in NZD funding by sector (% of GDP) Source: RBNZ SSR.
Profitability has increased…
In the year to December 2014, the level of after-tax profits for New Zealand banks increased 15 percent. The banking system’s return on assets increased 9 percent over the year, and now sits at about the average 2000-07 level (figure 5.6). Return on equity – a key profitability measure for locally incorporated banks – increased from 13.9 to 14.1 percent. The rise in profitability over the past year has been driven by a combination of factors, including increased net interest and non-interest income, falling operating expenses as a share of income, and further declines in the impaired asset expense.
Net interest income is an important component of profits, and rose 7 percent over the year. The new registered bank Income Statement Survey, first published last October, allows a breakdown of the component parts of both interest income and expense (figure 5.7).1
Interest income makes up the majority of bank income (close to 90 percent). Interest earned on housing lending makes up half of interest income, with interest on other loans another 43 percent. Interest
expenses account for just over 70 percent of bank costs, with operating costs making up the remainder. Interest paid on deposits accounts for most of the interest-related expenses.
0 2 4 6 8 10 0 2 4 6 8 10
Apr-10 Oct-11 Apr-13 Oct-14
% % 1-week 1-month Figure 5.5 Mismatch ratios
Source: RBNZ Liquidity Survey.
2000 2002 2004 2006 2008 2010 2012 2014 -3 -2 -1 0 1 2 3 4 5 -3 -2 -1 0 1 2 3 4
5 % Impaired asset expense Tax %
Operating expense Other income
Net interest income Return on assets
Figure 5.6 New Zealand bank profitability (% of total assets, December years)
Source: Registered banks’ Disclosure Statements, RBNZ Income Statement Survey.
…alongside falling non-performing loans.
Non-performing loans (NPLs) have continued to decline across most sectors over the past year (figure 5.8), helping to support bank profitability. Total NPLs as a percentage of lending fell to 0.8 percent in March 2015, from 1.4 percent a year earlier. The exception to this trend has been corporate lending, where a few large specific exposures (such as Solid Energy) have resulted in NPLs remaining broadly stable. Watchlist loans, a leading indicator of future problem loans, have continued to track down over the past six months. However, the rural watchlist loan balance has stabilised, possibly reflecting the difficult 2014-15 season for dairy farmers.
The ongoing decline in NPLs has translated into a reduction in the annual amount of impaired asset charges (which directly affect measured
profitability), from $390 million in 2013 to $337 million in 2014. On a quarterly basis, the impaired asset expense increased over 2014 (figure 5.9). This increase was driven by provisions for individual loan exposures and other impairment expenses, and primarily reflects the deterioration in loan performance for a few large specific exposures in the corporate sector.2 By contrast, the banking sector has been able to write back
collective provisions over the past two years. Dec-09 Dec-10 Dec-11 Dec-12 Dec-13 Dec-14 1.6
1.8 2.0 2.2 2.4 2.6 2.8 -4 -2 0 2 4 6
8$bn Housing loan interest incomeOther loan interest income Interest paid on depositsOther interest expense $bn
Other interest income Interest expense
Interest income Net interest income (RHS)
Figure 5.7 Interest income and expense
(quarterly)
Source: Registered banks’ Disclosure Statements, RBNZ Income Statement Survey.
Note: Data prior to September 2013 are from Disclosure Statements. ‘Other interest income’ includes interest income from cash and deposits, debt securities, derivatives and other interest income. ‘Other interest expense’ includes interest expense from derivatives, debt securities, other borrowings and other expenses.
0 1 2 3 4 5 0 1 2 3 4 5
Housing Rural Commercial
property SME Corporate
% % 2009 2010 2011 2012 2013 2014 2015 Figure 5.8 Sectoral non-performing loans (% of sectoral lending, March years)
Source: Based on private reporting data from 21 registered banks.
Note: Includes impaired and 90 days past due assets. Data are not standardised and definitions may vary across banks.
2 Individual provisions are for losses that have already been incurred on loans that are known to be impaired and are individually significant. The profile of individual provisions can be quite ‘lumpy’, reflecting the annual year-end balance dates of individual banks. Collective provisions are for loans assessed in pools of similar assets with similar risk characteristics.
Banks are containing operating costs.
Non-interest, or operating, costs increased a modest 3.5 percent over the year, helping to support the increase in profitability. The cost-to-income ratio – a key measure of bank efficiency – tracked down over 2014 and currently stands at 39 percent (figure 5.10). The New Zealand banking system compares favourably on this measure in a cross-country context. This partly reflects the less complex business model of New Zealand banks, together with ongoing efforts to manage non-interest costs.
Asset growth is contributing to a rise in interest income.
Interest income increased 9 percent over 2014, tied to the growth in the stock of outstanding credit and higher interest rates. Household lending growth declined in annual terms over most of 2014, but has started to pick up in recent months in line with the rebound in the housing market (figure 5.11). The speed limit on high-LVR lending has lowered the average LVR of house buyers, so that this pick-up in mortgage lending has been more modest than it might have otherwise been. Consumer lending, a small part of overall bank lending to households, has remained robust, reflecting broader strength in the New Zealand economy.
At 5 percent, the annual growth in household lending is only slightly higher than household income growth. To some extent, this presents a misleading picture of underlying bank credit growth. As highlighted in box D, the high level of voluntary principal repayments, tied to the currently
Dec-09 Jun-11 Dec-12 Jun-14 -200
-100 0 100 200 300 400 500 -200 -100 0 100 200 300 400
500$mn Other impairment expenseRecoveries $mn Debt write-offs
Collective provisions
Individual provisions Impaired asset expense Figure 5.9
Impaired asset expense
(quarterly)
Source: Registered banks’ Disclosure Statements, RBNZ Income Statement Survey.
Note: ‘Other impairment expense’ for the December 2014 quarter relates to a charge against a debt security issued by Solid Energy and held by one bank.
1991 1994 1997 2000 2003 2006 2009 2012 20 40 60 80 100 120 -3 -2 -1 0 1 2 3 4$bn Operating expenses % Operating income Cost-to-income ratio (RHS) Figure 5.10 New Zealand bank operating income and costs
Source: Registered banks’ Disclosure Statements, RBNZ Income Statement Survey.
Note: ‘Operating income’ is net interest income plus other income. The sharp increase in operating expenses in 2009 is due to additional payments to the IRD made by some banks related to structured financial transactions undertaken several years earlier.
low level of interest rates, has contributed to the modest level of net housing credit growth. Gross housing lending is estimated to have been significantly higher, and closer to the experience of the mid-2000s.
Borrowing by the business sector has also increased, with annual growth over the year to March increasing to 7.3 percent from 3.6 percent a year earlier. Banks report that the demand for property-related lending has increased, related to low interest rates, an appetite for higher-yielding assets, and strong development activity in both Auckland and Christchurch. Earthquake-strengthening work continues to support credit demand within the commercial property sector, while banks report strong offshore buyer interest in New Zealand commercial property (see chapter 4). Banks also report an increase in credit demand for investment and growth-related asset purchases from corporates. For small-to-medium sized enterprises (SMEs), the demand for working capital has increased. Some banks expect a softening in overall SME credit demand related to lower rural spending.
-10 -5 0 5 10 15 20 25 30 -10 -5 0 5 10 15 20 25 30 2000 2002 2004 2006 2008 2010 2012 2014 % %
Business Household Agriculture
Figure 5.11 Bank lending by sector (annual % change) Source: RBNZ SSR.
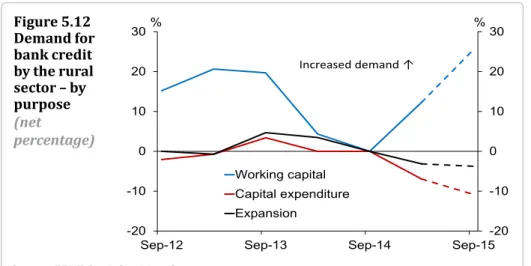
Bank lending to the agricultural sector increased 6 percent in the year to March 2015. This increase largely reflects borrowing for working capital purposes, as opposed to on-farm capital investment or farm purchases, and is likely related to the sharp fall in the dairy payout for the current season (figure 5.12). Banks expect a further increase in the demand for working capital over the next six months as financial pressure mounts across the dairy sector.
Sep-12 Sep-13 Sep-14 Sep-15-20
-10 0 10 20 30 -20 -10 0 10 20 30% % Working capital Capital expenditure Expansion Increased demand ↑ Figure 5.12 Demand for bank credit by the rural sector – by purpose (net percentage)
Source: RBNZ CreditConditions Survey.
Note: Net percentage is the percentage of respondents reporting an increase in demand minus the
percentage reporting a decline. Individual bank responses are weighted by market share. The dotted line is expected change six months ahead.
Net interest margins are broadly stable…
The aggregate net interest margin (NIM) of the banking system has remained fairly stable over the past year, ticking up modestly from 2.30 to 2.34 percent (figure 5.13). With the official cash rate (OCR) increasing 100 basis points over the early part of 2014, banks largely passed on this increased cost of funds, as seen in an increase in floating mortgage rates. By contrast, the effective rate paid by fixed-rate mortgage
borrowers has remained broadly stable (figure 5.14). Deposit rates have only increased modestly over the past 12 months, and have declined in recent months, due to strong inflows of deposit funding. Overall, the modest rise in interest expense has been more than offset by the higher interest income generated by mortgage and other lending.
…despite competition between banks.
The up-tick in NIM comes despite competition between banks for residential mortgage lending, particularly for low-LVR loans. Efforts by banks to attract customers have seen prevalent use of cash incentives for new borrowers since the last Report. Falls in global interest rates have also prompted a substantial re-pricing of long-term mortgage rates (see figure 2.2). Some banks are offering five-year fixed rates at historic lows, and a 10-year fixed rate has been offered for the first time. Current fixed mortgage rates are well below the effective mortgage rate at all terms, and the proportion of borrowers on floating mortgage rates has declined from 41 to 28 percent over the past year. These factors suggest that mortgage yields received by banks could decline in coming months, potentially generating downward pressure on net interest margins.
0 1 2 3 4 5 0 2 4 6 8 10 2000 2002 2004 2006 2008 2010 2012 2014 % % Yield Cost of funds
Net interest margin (RHS)
Figure 5.13 New Zealand retail banks’ net interest margin
Source: Registered banks’ Disclosure Statements, RBNZ Income Statement Survey.
Note: Yield is interest income relative to interest-earning assets. Cost of funds is interest expense relative to interest-earning liabilities. 0 2 4 6 8 10 12 0 2 4 6 8 10 12 2005 2007 2009 2011 2013 2015 % % Floating Fixed
6-month term deposit rate OCR
Figure 5.14 Effective mortgage rates, deposit rates and OCR
Source: RBNZ.
Note: ‘Effective mortgage rates’ are actual interest rates paid by borrowers for outstanding mortgages, and
Banks report that lending standards for the household sector have been stable over the past six months (figure 5.15). Lending standards for rural borrowers have also remained unchanged, although some banks have noted they have begun easing conditions attached to borrowing for working capital. This will provide some relief for customers seeking to increase working capital borrowing in response to the challenging financial conditions facing the dairy sector. By contrast, lending conditions across the business sector have continued to ease. This loosening has mainly been driven by banks reducing margins above their cost of funds, although some loosening in non-price terms has been reported for the SME sector.
Non-bank lending institutions (NBLIs)
The NBLI sector is a small share of intermediated credit.
The non-bank sector comprises entities that are regulated by the Reserve Bank (deposit-taking finance companies, building societies and credit unions) and unregulated entities (such as non-deposit-taking finance companies). The NBLI sector now accounts for a small fraction of credit provided by domestic financial institutions, following a wave of finance company failures, mergers and consolidation of the sector since 2006. A number of larger institutions have left the sector in recent years and now operate as registered banks.
Over the past year, total non-bank lending has expanded by 5.1 percent, driven mainly by an increase in non-property business lending (figure 5.16). The non-bank sector was a significant source of ‘mezzanine’ (or second tier) funding for commercial property prior to 2006, and property development accounted for a large share of NBLIs total lending. However, property-related lending now accounts for only around 6 percent of the sector’s overall lending.
NBLIs are not subject to the speed limit on high-LVR residential mortgage lending. While NBLI housing lending has grown 13.4 percent in the 12 months to March, housing lending only accounts for 8 percent of the sector’s total lending. The Reserve Bank monitors the sector for any evidence of material ‘regulatory leakage’ from the LVR policy imposed on the banking system, with no evidence of material leakage to date.
Sep-12 Sep-13 Sep-14 Sep-15-20
-15 -10 -5 0 5 10 -20 -15 -10 -5 0 5
10% Household Business Agriculture %
Easing standards ↓ Figure 5.15 Change in banks’ lending standards (net percentage)
Source: RBNZ Credit Conditions Survey.
Note: Net percentage is the percentage of respondents reporting a tightening of lending standards minus
the percentage reporting an easing. Individual bank responses are weighted by market share. Dotted line is expected change six months ahead.
Insurance
Low global interest rates are having a major impact on the insurance industry in two opposing ways. Low long-term interest rates present a significant challenge to generating adequate returns on reserves. This is of particular significance to the life insurance sector which may have commitments to clients many years into the future. In contrast, the search for yield stimulated by low interest rates is benefiting the general insurance sector, which reinsures a portion of liabilities with global insurers. Global insurers are finding it relatively easy to raise capital and this is pushing down the cost of reinsurance, although rates for the Asia-Pacific region remain higher than in other major world regions.
The New Zealand general insurance sector is benefiting from these global trends. The falling cost of reinsurance is putting downward
pressure on domestic insurance premiums, particularly in the commercial property sector. Strong competition for personal insurance is also
evident, including the influence of new entrants. However, lower reinsurance rates are not necessarily fully reflected in retail pricing, as some insurers have been exposed to losses from regional weather events in recent months. In this competitive market, it is important that insurers maintain sound underwriting standards so that premiums remain appropriately priced in relation to the risks.
Earthquake claims costs have been revised upwards.
As at 31 March 2015, insurers have paid $24 billion in Canterbury earthquake claims (figure 5.17). Several insurers have significantly increased their estimates for their ultimate costs, which the Reserve Bank now estimates will total $33-38 billion. Insurers have been funding increased costs through a combination of reinsurance, reductions in existing capital, and injections of new capital.
In aggregate, estimated outstanding Canterbury earthquake claims have not reduced by much in recent months, with payments roughly matching increases in estimated ultimate costs. The substantial claim amounts still outstanding suggest it will be challenging for insurers to meet their announced target for completing the settlement of all Canterbury earthquake claims within the next year or so.
0 5 10 15 20 0 5 10 15 20 2010 2011 2012 2013 2014 2015 $bn $bn Housing Consumer Agriculture Property Other business Figure 5.16 NBLI lending by sector (March years) Source: RBNZ NBDT reporting, RBNZ SSR.
Insurers have programmes underway to improve risk
governance.
The Reserve Bank reviewed the quality of the risk governance of insurers during the second half of 2014. An overview of the findings from the survey of 17 insurers was published on the Reserve Bank website in March 2015.3 The purpose of the review was to assess the quality of
leadership of risk governance by each insurer’s board and whether the actions of the board and senior management promote a prudent approach to risk management. The existence of strong risk governance is important because self-discipline is one of the three pillars of the Reserve Bank’s regulatory framework (the other two being regulatory discipline and market discipline). The review considered the extent to which the Reserve Bank should rely on self-discipline in relation to
risk governance and identified areas for improvement if aspects of risk governance were lacking.
The findings of the review were that the quality of risk governance varied, but that insurers recognise its importance. Most insurers had programmes underway to improve risk governance. The Reserve Bank provided feedback to each insurer covering the strengths and weaknesses of their risk governance and this feedback was summarised in the public report under headings covering both functional and
behavioural aspects. Insurers not covered by the review are encouraged to consider their own risk governance in relation to the findings.
Collection of insurance data is under way.
The development of a process to collect information on the insurance sector from licensed insurers was outlined in the November 2014
Report. The Reserve Bank is currently considering consultation
feedback in relation to trial returns for insurance data, in preparation for implementation of regular data collection later in 2015.
Financial market infrastructure
Payment and settlement systems have functioned
satisfactorily.
The New Zealand financial market infrastructure (FMI) has continued to function satisfactorily. Over the past six months there have been a small number of incidents affecting the normal operation of the various systems, which have been effectively managed. The impact of the
3 See http://www.rbnz.govt.nz/regulation_and_supervision/insurers/regulation/Review-findings-on-the-quality-of-the-risk-governance-of-insurers.pdf 0 10 20 30 40 50 0 10 20 30 40 50
Apr-11 Mar-12 Mar-13 Mar-14 Mar-15 $bn $bn RBNZ estimated range of ultimate costs
EQC
Paid claims excluding EQC Figure 5.17
Canterbury earthquake paid claims
various disruptions has been short-lived and generally limited to only some participants or transaction types.
The Exchange Settlement Account System (ESAS) and the NZClear system operated by the Reserve Bank are at the heart of New Zealand’s financial infrastructure. In the first four months of 2015, on average around $30 billion of inter-bank transactions were settled each day in ESAS and around $7.5 billion of securities trades were settled in NZClear. The operational reliability of these systems is illustrated in figure 5.18. The most significant disruption to the operation of the ESAS/ NZClear system in recent months occurred on 22 December when, for approximately four hours, NZClear was unable to process some transactions. The problem did not prevent daily trades being completed and steps to prevent a reoccurrence of the problem have been
implemented.
Industry continues to address concerns about risks in the
retail payment system.
As discussed in the previous Report, the Reserve Bank expects banks to be able to exchange retail payment files at least hourly by the end of 2016. The more frequent exchange of payment files will address the Reserve Bank’s long-standing concerns about the time taken to settle transactions after a payment instruction is issued by a customer, the value of unsettled transactions at any point in time, and the majority of retail payments being settled late in the banking day. The Reserve Bank continues to engage with banks to encourage ongoing improvement. As shown in figure 5.19, there has been some improvement with the timing of the settlement of transactions shifting earlier in the day.
99.6 99.7 99.8 99.9 100.0 0 100 200 300 400
Sep-13 Mar-14 Sep-14 Mar-15
%
Minutes Connectivity and communications related outages System performance related outages
Availability (RHS) Figure 5.18 ESAS/NZClear availability and outages Source: RBNZ.
Note: Availability is for the 12 months to the current period. ESAS and NZClear are reported together because of the close links between the two systems.
0 10 20 30 40 50 60 0 10 20 30 40 50 60
Mar-14 Jun-14 Sep-14 Dec-14
% % 3:00pm - 8:59pm 9:00pm - 11:59pm 12:00am - 2:59pm Figure 5.19 Settlement of retail payments Source: RBNZ.
Wider direct participation in the payment system is in
prospect…
One of the aims of the Reserve Bank’s oversight of FMIs is that the payment system has objective, risk-based and publicly disclosed criteria for participation that promote fair and open access. The Reserve Bank is aware that a number of financial institutions are interested in becoming direct participants in the New Zealand payment system and it will be monitoring the progress of those potential new participants towards achieving that goal. The November Report discussed the Reserve Bank’s concern that financial institutions that currently access the retail payment system through an agency arrangement with a major bank need to modify customer account numbers if those institutions wish to become direct participants. It is pleasing that the industry appears to be making some progress on addressing this issue.
...and stakeholder representation has increased.
A number of entities with an interest in payments have taken the opportunity to become members of Payments NZ following the
introduction of the new membership framework described in the previous
Report. The new members represent a range of different interests, including companies that process transactions, and major retailers. This is a welcome development. The payment system should effectively meet the needs of all its users and the involvement of a diverse range of stakeholders will provide an opportunity for broader input into important discussions about the future development of payments in New Zealand.