The changing social patterning of
obesity: an analysis to inform practice
and policy development
Final report to the Policy Research Programme, Department of Health
Version 2, 5th November 2007
Martin White, A
shley Adamson
1, Tom Chadwick
1, Carol Dezateux
2, Lucy Griffiths
2,
Denise Howel
1, Sarah Kelly
1, Catherine Law
2, Leah Li
2, Rossella Lo Conte
2,
Christine Power
2, Elaine Stamp
11 Institute of Health & Society, Newcastle University, Newcastle upon Tyne
2 Centre for Paediatric Epidemiology and Biostatistics, Institute of Child Health, University College London
Correspondence to:
Prof Martin White
Public Health Research Programme Institute of Health & Society William Leech Building Newcastle University NE2 4HH
Tel: 0191 222 6275
Acknowledgements
This project was undertaken by members of the Public Health Research Consortium. The Public Health Research Consortium is funded by the Department of Health Policy Research Programme. The views expressed in this report are those of the authors and not necessarily those of the Department of Health. Information about the wider programme of the PHRC is available from www.york.ac.uk/phrc.
The project was conceived by CL, CP and MW and developed with input from other members of the Public Health Research Consortium and collaborators at Newcastle University and University College London. The three sets of analyses in the report were conducted by three teams, one at the Institute of Health & Society, Newcastle University and two at the Institute of Child Health, University College London. The three sets of analyses were conducted and reported as outlined below. SK undertook the searches and drafted the literature review section. The report was edited by MW, who also drafted the executive summary,
introduction, discussion and conclusions. All authors commented on and approved the final draft. MW, CL and CP are guarantors for the work. Stephen Platt gave helpful advice on the project throughout.
The analyses of the 1958 British Birth Cohort were undertaken by RLC and LL; CP and LL developed the analytic strategy for the life-course and inter-generational research questions relating to the 1958 cohort.
The analyses of the Millennium Birth Cohort were carried out by LG, CD and CL, who also drafted this section of the report. They acknowledge the assistance of Tim Cole and Summer Hawkins.
The analyses of the Health Survey for England and Scottish Health Survey were proposed by MW, DH and AA and developed and executed by ES, TC and DH. ES and DH drafted the methods and results and MW edited the report. All authors contributed to interpretation of findings and commented on drafts. The National Centre for Social Research (NatCen) provided the data and detailed information on weighting strategies. Beth Edgar and Laura Stokoe provided secretarial support throughout.
Contents
Acknowledgements ... i
Contents...ii
List of tables ... vi
List of figures ... ix
List of abbreviations used in the text ...xii
Preface: what this study adds to knowledge... ....1
Trends in overweight and obesity by age, sex and socio-economic position ... 1
Weight gain among parents and its influence on weight gain in children ... 1
Indicators of the changing epidemiology of diet and physical activity... 1
Methodological considerations ... 1
Executive summary ... ….. 2
Background ... 2
Aims ... 2
Methods... 2
Key findings ... 3
Age, sex and socioeconomic trends in overweight and obesity... 3
Weight gain among parents and its influence on weight gain in children ... 4
The changing epidemiology of diet and physical activity... 4
Conclusions ... 5
Age, sex and socioeconomic trends in overweight and obesity... 5
Weight gain among parents and its influence on weight gain in children ... 5
The changing epidemiology of diet and physical activity... 6
Implications for research... 6
Contribution to the Public Health Research Consortium’s main research themes ... 7
Background ... 8
Introduction ... 8
Review of literature on trends in obesity and socio-economic position ... 8
Socioeconomic position in childhood and obesity in adulthood... 8
Childhood socio-economic position and childhood obesity ... 9
Socio-economic position in adulthood and obesity in adulthood ... 11
Social mobility ... 12
Parental BMI status ... 12
Relationships between diet and physical activity and socio-economic position... 13
Geographical variations... 13
Ethnicity ... 14
Summary ... 14
Policy context... 15
Overall aims ... 16
The changing social patterning of obesity in the 1958 British Birth Cohort Study ... 18
Introduction and aims... 18
Two generations of the 1958 British Birth Cohort Study ... 18
Data sources ... 18
Anthropometric measurements ... 18
Physical activity and diet measures... 19
Measures of socio-economic position ... 19
Aim 1: age trends in BMI, prevalence of overweight and obesity, and putative
influences ... 23
Aim 2: to establish whether trends in BMI, diet and physical activity differ between social classes and whether socio-economic inequalities develop with increasing age 25 Inter-generational relationships: offspring BMI and weight change across the parent’s life-course ... 36
Data sources ... 36
Anthropometric measurements ... 37
Methods of analysis... 37
Results ... 38
BMI of the offspring ... 38
Cohort members with offspring in the study sample and the full 1958 cohort sample 39 Childhood BMI of parents and offspring ... 40
BMI and BMI gain at different life stages of cohort members and offspring BMI ... 43
Social class differences in BMI in two generations ... 46
Summary of main findings... 49
Longitudinal study of cohort members ... 49
Inter-generational relationships: offspring BMI and weight change across the parent’s life-course... 50
Methodological considerations ... 50
Longitudinal study of cohort members ... 50
Inter-generational relationships: offspring BMI and weight change across the parent’s life-course... 50
The changing social patterning of obesity in the Millennium Cohort Study ... 51
Introduction ... 51
Methods... 51
Study population ... 51
Outcome measure... 52
Explanatory measures ... 52
Socioeconomic classification (9 months)... 52
Statistical analysis ... 52
Results ... 53
Descriptive analyses... 53
Strategy One... 58
Strategy Two ... 59
Summary of main findings... 60
Methodological considerations ... 60
The changing social patterning of obesity in the Health Survey for England and Scottish Health Survey ... 62
Introduction ... 62
Methods... 62
Study design ... 62
Data sources ... 62
Data availability ... 63
Variables selected for analysis ... 64
Data weighting ... 68
Methods of analysis... 68
Results ... 69
Trends in measures of socio-economic position ... 73
Associations between obesity, overweight and high waist-hip ratio and socio-economic position ... 73
Trends in dietary measures... 81
Associations between obesity, overweight and high waist-hip ratio and dietary measures ... 84
Trends in physical activity ... 91
Associations between obesity, overweight and high waist-hip ratio, and physical activity... 93
Health Survey for England: children... 97
Trends in obesity and overweight over time and by age group ... 97
Associations between overweight and obesity, and socio-economic position... 101
Associations between obesity and overweight, and dietary intake ... 104
Trends in physical activity ... 106
Associations between obesity and overweight, and physical activity... 106
Scottish Health Survey and regional comparisons... 109
Summary of main findings... 109
Health Survey for England... 109
Trends in overweight, obesity and waist hip ratio among adults ... 109
Role of diet and physical activity in adults ... 109
Trends in obesity and overweight in children ... 109
Role of diet and physical activity in children... 109
Scottish Health Survey and regional comparisons... 110
Methodological considerations ... 110
Discussion of combined findings of the three studies... 111
Main findings ... 111
Age, sex and socioeconomic trends in overweight and obesity... 111
Weight gain among parents and its influence on weight gain in children ... 111
The changing epidemiology of diet and physical activity... 111
Strengths and weaknesses of the studies ... 112
Overall conclusions and implications ... 114
Age, sex and socioeconomic trends in overweight and obesity... 114
Weight gain among parents and its influence on weight gain in children ... 114
The changing epidemiology of diet and physical activity... 115
Implications for research... 115
Dissemination of findings ... 116
Appendix 1: Details of data weighting... 117
Appendix 2: Results of the Scottish Health Survey and regional comparisons ... 119
Scottish Health Survey: adults ... 119
Trends in obesity, overweight and high waist-hip ratio over time and by age group 119 Associations between obesity, overweight and high waist-hip ratio and socioeconomic position... 122
Trends in dietary intake... 126
Trends in physical activity ... 129
Scottish Health Survey: children... 132
Trends in overweight and obesity ... 132
Associations between overweight and obesity, and socioeconomic position ... 133
Associations between overweight and obesity, and socioeconomic position ... 138
Trends in dietary intake... 141
Trends in physical activity ... 145
England and Scotland Comparisons: Children... 149
Trends in obesity and overweight over time and by age group ... 149
Associations between overweight and obesity, and socioeconomic position ... 152
Regional comparisons, including Scotland: adults ... 154
Regional comparisons, including Scotland: children... 162
List of tables
Table 1: Social class distribution at all ages (study years) – 1958 cohort ... 20 Table 2: Mean BMI at ages 7, 16 and 33 years in the samples with data at these ages and in the sample with data at age 45 years. ... 21 Table 3: Social class difference in mean BMI at ages 7, 16 and 33 years in the samples with data at these ages and in the sample with data at age 45 years ... 22 Table 4: Mean BMI and % of overweight and obesity at all ages ... 24 Table 5: Distribution (%) of physical activity and dietary measures at 33 years and 42 years 24 Table 6: Odds Ratios (95% CI) for overweight and obesity* for manual vs. non-manual class at all ages... 26 Table 7: Odds Ratios (95% CI)* for overweight and obesity by social class†... 27 Table 8: Mean (SD) physical activity (PA)* scores by social class and OR (95% CI) for the top and bottom physical activity scores for manual vs. non-manual class at 33 years and 42 years ... 30 Table 9: Mean (SD) specific diet scores by social class and OR (95% CI) for the top and bottom diet scores for manual vs. non-manual class at 33 years and 42 years ... 33 Table 10: Mean (SD) PA&diet combined score* by social class and OR (95% CI) for the top and bottom PA&diet combined scores for manual vs. non-manual class at 33 years and 42 years ... 35 Table 11: Observed mean BMI (n) and % of overweight and obesity in the offspring ... 39 Table 12: Characteristics for all cohort members and those with an offspring aged 4 years or over... 40 Table 13: Observed mean (SD) for external BMI SDS* and prevalence of overweight for cohort members and the offspring... 41 Table 14: Transformation between a change in BMI SDS to an equivalent change in BMI (kg/m2) from median by age and gender* ... 42 Table 15: Mean BMI (n) and % of overweight and obesity in the two generations ... 43 Table 16: Change (SE) in offspring BMI SDS* for a SD increase of parental BMI† at
different life stages ... 44 Table 17: OR (95% CI) for overweight of offspring for a SD increase of BMI of cohort
members* ... 45 Table 18: Mean external BMI SDS* (SE) and % of overweight for offspring by cohort
members social class at 33 years... 49 Table 19: Sample characteristics... 54 Table 20: Summary statistics for height at 3 years, weight at 9 months and 3 years, weight z-scores and weight gain z-score according to birth weight ... 55 Table 21: Summary statistics for height at 3 years, weight at 9 months and 3 years, weight z-scores and weight gain z-z-scores according to weeks of gestation (2 week intervals)... 55 Table 22: Summary statistics for height at 3 years, weight at 9 months and 3 years, weight z-scores and weight gain z-z-scores according to household socioeconomic classification... 56 Table 23: Percentage (n) infants aged 9 months who had weight z-scores greater than 1 and less than 2, and greater than 2, according to household socioeconomic classification... 56 Table 24: Percentage (n) children aged 3 years who were normal weight, overweight or
obese* according to household socioeconomic classification ... 57 Table 25: Parental summary statistics for weight and weight change (MCS1 to 2), according to household socioeconomic classification ... 57 Table 26: Parental summary statistics for weight and weight change (MCS1 to 2), according to age ... 58
Table 28: Linear regression analyses* for the association between partner weight change and conditional weight gain (9 months to 3 years) ... 59 Table 29: Linear regression analyses for the association between household socioeconomic classification and conditional weight gain (9 months to 3 years) ... 59 Table 30: Percentage of available observations in the HSE and SHS by year... 64 Table 31: Percentage (unweighted sample size) of men obese, overweight and with high waist-hip ratio by age group and year (HSE)... 69 Table 32: Percentage (unweighted sample size) of women obese, overweight and with high waist-hip ratio by age group and year (HSE)... 70 Table 33: Adjusted odds ratios (95% confidence intervals) for obesity, overweight and high waist-hip ratio among adult men and women for by age group and survey year (HSE) ... 71 Table 34: Percentage (unweighted sample size) of adults with obesity, overweight and high waist-hip ratio by social class group and survey year (HSE)... 74 Table 35: Percentage (unweighted sample size) of adults with obesity, overweight and high waist-hip ratio by educational attainment and survey year (HSE)... 76 Table 36: Adjusted odds ratios for obesity, overweight and high waist-hip ratio, by social class and educational attainment (HSE)... 78 Table 37: Adjusted odds ratios for consumption of whole milk by survey year, age group and social class group (HSE) ... 82 Table 38: Adjusted odds ratios for consumption of ≥ 4 portions of fruit and vegetables by survey year, age group and social class group (HSE) ... 84 Table 39: Percentage (unweighted sample size) of adult men and women obese, overweight and with high waist-hip ratio by survey year and by type of milk regularly consumed (HSE)85 Table 40: Adjusted odds ratios for obesity, overweight and high waist-hip ratio among adult men and women by type of milk and fruit and vegetable consumption (HSE) ... 89 Table 41: Percentage (unweighted sample size) of adult men and women with obesity,
overweight and high waist-hip ratio by fruit and vegetable consumption and survey year (HSE)... 89 Table 42: Adjusted odds ratios for physical activity level by survey year, age group and social class group (HSE)... 93 Table 43: Percentage (unweighted sample size) of obese, overweight and with a high waist-hip ratio in adult men and women by survey year, and by level of physical activity (HSE)... 94 Table 44: Adjusted odds ratios for obesity, overweight and high waist-hip ratio among adult men and women by physical activity level (HSE) ... 95 Table 45: Percentage (unweighted sample size) of obese and overweight boys and girls by survey year and age group (HSE) ... 98 Table 46: Adjusted odds ratios for obese and overweight among boys and girls by survey year and age group (HSE) ... 100 Table 47: Percentage (unweighted sample size) of obese and overweight boys and girls by social class group of head of household and survey year (HSE) ... 102 Table 48: Adjusted odds ratios for obesity and overweight among boys and girls by social class group (HSE)... 103 Table 49: Percentage (unweighted sample size) of obese and overweight among boys and girls by fruit and vegetable consumption and by survey year (HSE)... 104 Table 50: Adjusted odds ratios for obesity and overweight among boys and girls by fruit and vegetable consumption (HSE)... 106 Table 51: Percentage (unweighted sample size) of obese and overweight boys and girls by activity level and survey year (HSE)... 107 Table 52: Adjusted odds ratios for obesity and overweight among boys and girls by activity
Table 53: Percentage (unweighted sample size) of men and women with obesity, overweight and high WHR by survey year and age-group – (SHS) ... 120 Table 54: Adjusted odds ratios for obesity, overweight and high WHR among men and
women by survey year and age group (SHS)... 122 Table 55: Percentage (unweighted sample size) obese, overweight and with high waist-hip ratio by gender, survey year and socioeconomic position (SHS) ... 124 Table 56: Adjusted odds ratios for obesity, overweight and high waist-hip ratio with
indicators of socioeconomic position (SHS)... 126 Table 57: Percentage (unweighted sample size) of obesity, overweight and high WHR by gender, survey year and milk consumption (SHS)... 127 Table 58: Adjusted odds ratios for obesity, overweight and high waist-hip ratio and indicator of diet (SHS)... 129 Table 59: Percentage (unweighted sample size) of obesity, overweight and high waist-hip ratio by gender, survey year and activity variable (SHS) ... 130 Table 60: Adjusted odds ratios for obesity, overweight and high waist-hip ratio and activity level (SHS) ... 132 Table 61: Percentage (unweighted sample size) of obesity, overweight and high waist-hip ratio by gender, survey year, age group and socioeconomic position (SHS)... 133 Table 62: Adjusted odds ratios for obesity and overweight with gender, survey year, age and father’s social class (SHS)... 134 Table 63: Percentage (unweighted sample size) of obesity, overweight and high waist-hip ratio by gender, survey year and age group for England and Scotland (HSE & SHS) ... 135 Table 64: Adjusted odds ratios for obesity, overweight and high waist-hip ratio with country (HSE & SHS) ... 137 Table 65: Adjusted odds ratios for manual social class with country (HSE & SHS) ... 138 Table 66: Percentage (unweighted sample size) of obesity, overweight and high waist-hip ratio by country, gender, survey year and socioeconomic position (HSE & SHS)... 139 Table 67: Adjusted odds ratios for consumption of whole milk with country (HSE & SHS)142 Table 68: Percentage (unweighted sample size) of obesity, overweight and high waist-hip ratio by country, gender, survey year and dietary variables (HSE & SHS)... 143 Table 69: Adjusted odds ratios for high activity levels by country (HSE & SHS adults) ... 145 Table 70: Percentage (unweighted sample size) of obesity, overweight and high waist-hip ratio by country, gender, survey year and activity variable (HSE & SHS)... 147 Table 71: Percentage (unweighted sample size) of obesity and overweight by country, gender, survey year and age group (HSE & SHS) ... 150 Table 72: Adjusted odds ratios for obesity and overweight by country (HSE & SHS)... 152 Table 73: Percentage (unweighted sample size) of for obesity and overweight by country, gender, survey year and age group (HSE & SHS) ... 153 Table 74: Adjusted odds ratios for obesity, overweight and high waist-hip ratio among men and women by region (HSE & SHS) ... 161 Table 75: Adjusted odds ratios for obesity and overweight among children by region (HSE & SHS) ... 166
List of figures
Figure 1: Age-trends in mean BMI, prevalence of overweight* (OV) and obesity (OB)... 23
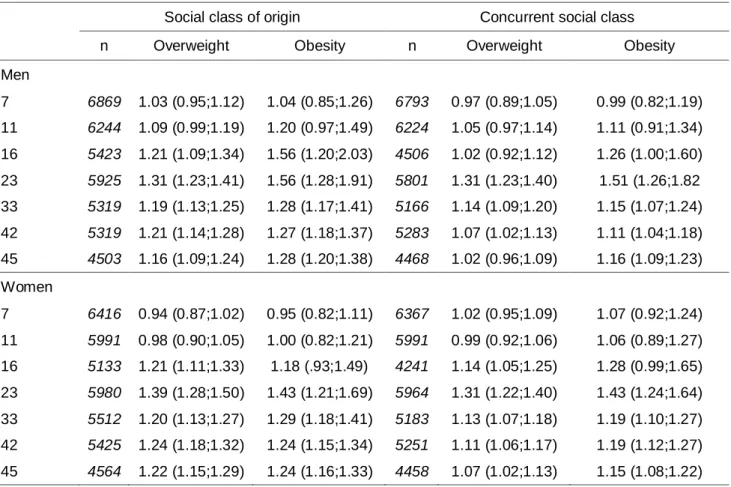
Figure 2: Age-trends in mean BMI, overweight and obesity by class of origin ... 28
Figure 3: Age-trends in mean BMI, overweight and obesity by concurrent class ... 29
Figure 4: Differences in mean PA scores between manual and non-manual class of origin at 33 years and 42 years ... 31
Figure 5: Difference in mean PA scores between manual and non-manual concurrent class at 33 years and 42 years ... 31
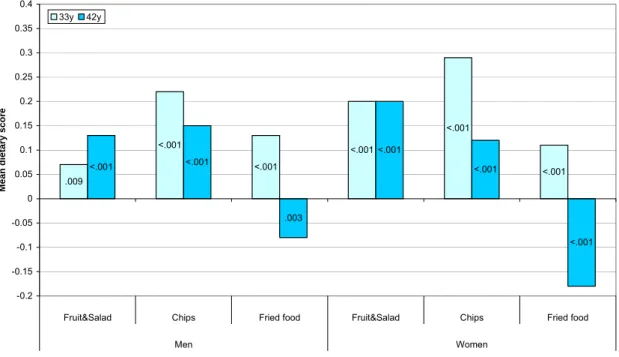
Figure 6: Differences in mean specific diet scores between manual and non-manual class of origin at 33 years and 42 years... 34
Figure 7: Differences in mean specific diet scores between manual and non-manual concurrent class at 33 years and 42 years ... 34
Figure 8: Differences in mean PA&diet combined scores between manual and non-manual class of origin at 33 years and 42 years... 36
Figure 9: Difference in mean PA&diet combined scores between manual and non-manual concurrent class at 33 years and 42 years ... 36
Figure 10: Trajectories for BMI of all cohort members by social class*... 47
Figure 11: Trajectories for internal BMI SDS of all cohort members by social class* ... 48
Figure 12: Percentage of adults in non-manual social class group (HSE) ... 65
Figure 13: Percentage of adults who stayed in full time education after age 16 years and those qualified to ‘A-level’ and above, by survey year (HSE)... 66
Figure 14 : Percentage of adults consuming whole, semi-skimmed and skimmed milk, by survey year (HSE) ... 67
Figure 15: Prevalence of obesity, overweight and high waist-hip ratio among adults by age group and survey year (HSE) ... 72
Figure 16: Interaction between age group and year of survey for high waist-hip ratio in women (HSE)... 73
Figure 17: Percentage of adults in manual social class group by age group and survey year (HSE)... 73
Figure 18: Prevalence of obesity, overweight and high waist-hip ratio among adults by social class group and survey year (HSE) ... 75
Figure 19: Interaction between age group and social class for being overweight in women (HSE)... 77
Figure 20: Interaction between age and social class group for having high waist-hip ratio in women (HSE)... 77
Figure 21: Prevalence of obesity, overweight and high waist-hip ratio among adults by educational attainment and survey year (HSE) ... 79
Figure 22: Interaction between educational attainment and survey years for obesity in women (HSE)... 80
Figure 23: Interaction between age group and educational attainment for being overweight in men (HSE)... 80
Figure 24: Interaction between age group and educational attainment for being overweight in women (HSE)... 81
Figure 25: Whole milk consumption among adults by age group and survey year (HSE)... 81
Figure 26: Whole milk consumption among adults by social class group and survey year (HSE)... 82
Figure 27: Consumption of ≥ 4 portions of fruit and vegetables among adults by age group and survey year (HSE) ... 83
Figure 28: Consumption of ≥ 4 portions of fruit and vegetables among adults by social class group and survey year (HSE) ... 83 Figure 29: Prevalence of obesity, overweight and high waist-hip ratio among adults by type of milk consumed and survey year (HSE)... 86 Figure 30: Interactions between age group and type of milk consumed for obesity in men (HSE)... 87 Figure 31: Interaction between age group and type of milk consumed type for obesity in women (HSE)... 87 Figure 32: Interaction between age group and type of milk consumed for being overweight in women (HSE)... 88 Figure 33: Prevalence of obesity, overweight and high waist-hip ratio among adults by
portions of fruit and vegetables consumed and survey year (HSE) ... 91 Figure 34: Prevalence of high activity level among adults by age group and survey year (HSE)
... 92 Figure 35: Prevalence of high activity by social class group among adults and survey year (HSE)... 92 Figure 36: Prevalence of obesity, overweight and high waist-hip ratio by activity level and survey year (HSE) ... 96 Figure 37: Interaction between age and activity level for being overweight in women (HSE)97 Figure 38: Prevalence of obesity and overweight among boys and girls by age group and survey year (HSE) ... 99 Figure 39: Interaction between survey year and age group for being overweight in children (HSE)... 101 Figure 40: Prevalence of obesity and overweight among boys and girls by social class group and survey year (HSE) ... 103 Figure 41: Prevalence of obesity and overweight among boys and girls by portions of fruit and vegetables per day and survey year (HSE)... 105 Figure 42: Levels of physical activity among children by survey year (HSE) ... 107 Figure 43: Prevalence of obesity and overweight among boys and girls by activity level and survey year (HSE) ... 108 Figure 44: Prevalence of obesity, overweight and high waist-hip ratio by year and by age groups (SHS) ... 121 Figure 45: Prevalence of obesity, overweight and high waist-hip ratio by year and SEP (SHS)
... 125 Figure 46: Prevalence of obesity, overweight and high waist-hip ratio by year and type of milk consumed (SHS) ... 128 Figure 47: Prevalence of obesity, overweight and high waist-hip ratio by year and activity level (SHS) ... 131 Figure 48: Prevalence of obesity, overweight and high waist-hip ratio by survey year and age groups for England and Scotland (HSE & SHS)... 136 Figure 49: Percentage of population in manual social class (HSE & SHS)... 138 Figure 50: Prevalence of obesity, overweight and high waist-hip ratio by year and social class (HSE & SHS) ... 140 Figure 51: Prevalence of obesity, overweight and high waist-hip ratio by year and educational attainment (HSE & SHS) ... 141 Figure 52: Percentage of population drinking whole milk (HSE & SHS) ... 142 Figure 53: Prevalence of obesity, overweight and high waist-hip ratio by year and type of milk consumed (HSE & SHS)... 144 Figure 54: Percentage of population with high activity level (HSE & SHS)... 145
Figure 55: Interaction between country and survey year for high activity level (HSE & SHS)
... 146
Figure 56: Prevalence of obesity, overweight and high waist-hip ratio by year and activity levels(HSE& SHS)... 148
Figure 57: Interactions between country and physical activity levels for having high waist hip ratio (HSE & SHS)... 149
Figure 58: Prevalence of obesity and overweight by year and age group (HSE & SHS)... 151
Figure 59: Interaction between country and age for being obese in girls (HSE & SHS)... 152
Figure 60: Prevalence of for obesity and overweight by year and social class of head of household (HSE & SHS)... 154
Figure 61: Prevalence of obese men by region (HSE & SHS)... 155
Figure 62: Prevalence of obese women by region (HSE & SHS)... 156
Figure 63: Prevalence of overweight men by region (HSE & SHS)... 157
Figure 64: Prevalence of overweight women by region (HSE & SHS)... 158
Figure 65: Prevalence of high waist-hip ratio men by region (HSE & SHS) ... 159
Figure 66: Prevalence of high waist-hip ratio women by region (HSE & SHS) ... 160
Figure 67: Prevalence of obese boys by region (HSE & SHS)... 162
Figure 68: Prevalence of obese girls by region (HSE & SHS) ... 163
Figure 69: Prevalence of overweight boys by region (HSE & SHS) ... 164
List of abbreviations used in the text
BMI Body mass index (weight(m)/height (cm)2) BMI-SDS Body mass index standard deviation score
CI Confidence interval
HSE Health Survey for England IOTF International Obesity Task Force kg Kilogram
m Metre Man Manual social class group NMan Non manual social class group MCS Millennium Cohort Study n Number
NatCen National Centre for Social Research
NICE National Institute for Health and Clinical Excellence NSF National Service Framework
NS-SEC National Statistics Socio-economic classification OB Obese (in adults, BMI ≥ 30 kg/m2)
OV Overweight (in adults, BMI ≥ 25 kg/m2)
OR Odds ratio
PA Physical activity
PSA Public Service Agreement
SD Standard deviation
SDS Standard deviation score
SE Standard Error
SEP Socio-economic position
SHS Scottish Health Survey
TDS Townsend Deprivation Score
Preface: what this study adds to knowledge
Trends in overweight and obesity by age, sex and socio-economic position
The analyses confirm reported trends in obesity in the British population, including its strong social gradient. Previous studies have not documented trends over such an extended period. The prevalence of obesity and overweight continue to rise in adults and children. In the Health Survey for England, women have higher levels of obesity overall, but men are more likely to be overweight at all ages. Among children, girls were more likely to be overweight and obese at most ages. However, the increases in obesity and overweight have been proportionately greater since the early 1990s in men than women, indicating a convergence of these trends. Cross-sectionally, prevalence of obesity, overweight and high waist-hip ratio increases up to age 75 years, but thereafter declines somewhat. There is evidence a strong social gradient from an early age, which is wider in females than males, but we found little evidence that this is either
widening or narrowing over time in recent years, except in children. Levels of obesity are worse in some regions of the UK than others, after controlling for social and demographic factors, including Scotland, the North East, Yorkshire and Humber, and the East and West Midlands.
Weight gain among parents and its influence on weight gain in children
The presence of intergenerational effects was striking in our cohort analyses, confirming the results of previous studies and indicating the importance of early interventions for obesity. We found that obesity was associated with social class in both early life and adulthood, although there was a tendency for social differences in obesity to be greater for class of origin than concurrent social class in the 1958 Birth Cohort. We found socioeconomic gradients in weight gain in the Millennium Cohort Study of young children and their parents, contributing to the social patterning of obesity in children and adults. Although parental weight gain was not found overall to be strongly associated with faster weight gain in children from 9 months to 3 years, it was found to have a greater influence on children within „never worked or long-term
unemployed‟ households, suggesting an „at risk‟ group.
Indicators of the changing epidemiology of diet and physical activity
There were some inconsistencies in our findings relating to behavioural risk factors for obesity and overweight. Nevertheless, there were indications that diet and, to a lesser extent, physical activity is socio-economically patterned. In the 1958 Birth Cohort, social differences in dietary factors, and for men physical activity, tended to be greater for concurrent social class in
adulthood than social class of parents. This suggests that the origins of social inequalities may be different for BMI, activity and dietary habits and that interventions aimed at modifying behaviour in mid-life may be only partly successful in reducing inequalities in obesity. However, efforts to change diet and physical activity behaviour will need to continue among adults, as well as focus on the very young.
Methodological considerations
Overall, inconsistencies in the data collected and available for analysis from the national health surveys hinder their usefulness as a tool for research and policy analysis at national levels. Better data are needed on energy intake from the whole diet and energy expenditure from all types of physical activity across age and social groupings to inform future policy and practice. Further research is needed to understand better the relationship between diet and physical activity, and socio-economic position.
Executive summary
Background
The prevalence of overweight and obesity continues to increase globally and in the UK. Long-term consequences include raised risk of developing hypertension and stroke, coronary heart disease, diabetes, osteoarthritis and certain cancers. Recently, a socioeconomic gradient in the prevalence of excess body weight has emerged in the UK, such that it has increasingly become a condition associated with lower socioeconomic position. Recent cross-sectional studies suggest that socioeconomic gradients have become established in childhood.
The emerging socioeconomic gradient of obesity in children is of particular concern both because overweight and obese children have increased risk of obesity in adult life and weight management interventions among children and young adults are of limited effectiveness. Evidence from a longstanding national dietary survey indicates that in the post-war years absolute energy intakes gradually decreased. This suggests that declining levels of energy expenditure from habitual physical activity (PA) may have played an important role in the emerging obesity epidemic. However, less is known about the social patterning of diet and PA, and their relative importance as antecedents of overweight and obesity among different
population groups.
The UK has a range of datasets which permit cross-sectional, longitudinal and inter-generational analyses of socioeconomic trends in obesity, and in its suspected influences (diet, PA and
parental body mass).
Aims
In this project, we set out to use a range of existing datasets to explore the emerging socio-economic patterning of obesity and its main risk factors in the UK. We aimed to investigate age, sex and socioeconomic trends in:
overweight and obesity, using national cross-sectional and longitudinal data
weight gain among parents and its influence on weight gain in children, using national cohort studies
indicators of the changing epidemiology of diet and PA, using national cross-sectional and longitudinal data
Methods
Analyses were conducted using data from three separate studies drawing on data from two British cohort studies (one historical birth cohort, started in 1958, and one contemporary cohort, started in 2000) and from the annual cross-sectional national health surveys (Health Survey for England (HSE) and Scottish Health Survey (SHS)). Whilst we were able to use common definitions for measures of obesity and overweight and social class, there were limitations that prevented us from combining datasets. The analyses are thus presented separately.
Analyses of the 1958 Birth Cohort used data on approximately 17,000 males and females followed up prospectively (at ages 7, 11, 16, 23, 33, 42, 45 years). We examined
socio-economic differences in overweight and obesity, using international cut-offs for body mass index (BMI), comparing manual and non-manual social groups, as defined by adult occupation and by social origins (occupation of father). Socio-economic differences in BMI were assessed at different ages from childhood to adulthood; differences in PA and diet were assessed using
about 3000 4-18 year-old offspring was examined in relation to BMI gain over different periods of the cohort members lives, comparing the association in social class groups. Multilevel models and logistic models were used to test the inter-generational associations. BMI was standardised in several analyses to allow comparison between ages and generations.
The Millennium Cohort Study (MCS) is a longitudinal study, which was set up to exa mine the social, economic and health-related circumstances of the new century‟s babies and their families. It includes a relatively high number of families from ethnic minority and disadvantaged areas. So far data have been collected when the cohort child was 9 months and 3 years old. Interviews were conducted with the main carer (usually the mother) and their partners at both contacts and information obtained on a large number of factors, including self-reported parental weights and heights, the child‟s last weight (~ 9 months), socioeconomic position, ethnicity and a range of other covariates. At 3 years the child‟s weight and height were measured. For 8561 children with complete measurements, we used regression analysis to assess social patterning in weight gain to 3 years and BMI at 3 years, in relation to maternal and partner weight gain.
Analyses of the HSE and SHS were undertaken using the statistical software STATA v9 and incorporated appropriate data weights to allow comparisons between years. Logistic regression was used to model the relationship between the three main binary outcomes (obesity, overweight and high waist-hip ratio (WHR)) and a number of explanatory variables (e.g. age, year, gender and the lifestyle factors). Given the difference in availability of data and the patterns seen in adults and children, separate models were fitted and reported for adults and children. For both adults and children, the results have been reported from separate models for males and females. Results are presented for the HSE in the main body of the report. Results for the SHS and regional comparisons are derived from a limited common dataset and are presented in Appendix 2.
Key findings
Age, sex and socioeconomic trends in overweight and obesity
Our findings support and extend those of the published research literature, which suggests that the obesity epidemic continues to grow unabated. Offspring in the 1958 birth cohort have on average greater BMIs than their parents at similar ages in childhood, and year on year increases in age-group specific prevalence of overweight obesity and high WHR were observed in the national health surveys. In the HSE, Woman have higher levels of obesity overall, but men are more likely to be overweight at all ages. Among children, girls were more likely to be
overweight and obese at most ages. However, the increases in obesity and overweight have been proportionately greater since the early 1990s in men than women, indicating a convergence of these trends. Cross-sectionally, prevalence of obesity, overweight and high WHR increases up to age 75 years, but thereafter declines somewhat.
Although socio-economic differentials in body mass were not present in children in the 1958 Birth Cohort, there is evidence that they are emerging at age 3 years in the MCS, with marked differences between the „never worked and long term unemployed‟ group and higher social groups. The socio-economic gap seems to be wider for females than males at all ages and across time in the national health surveys. However, although we have demonstrated marked socio-economic patterning of obesity and markers of behavioural risk in adults and children, males and females, our analyses have not shown that the gap between rich and poor has widened, or
Weight gain among parents and its influence on weight gain in children
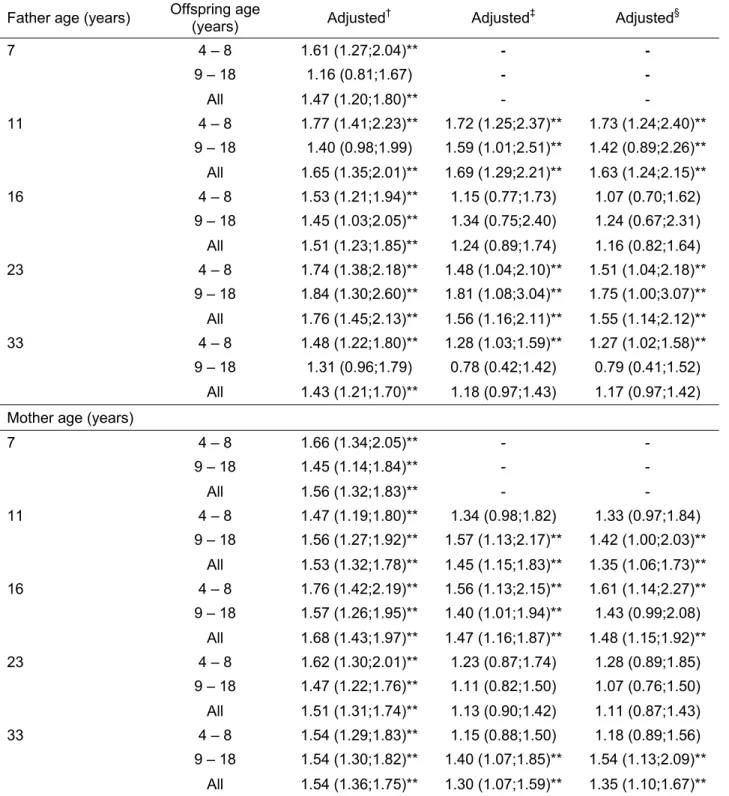
We found considerable evidence for longitudinal and intergenerational influences on obesity. In the MCS, greater gestational age at birth and higher birth weight were associated with greater weight gain up to 3 years of age. In the 1958 Birth Cohort, adiposity tracked from childhood into adulthood. Moreover, we found that parental BMI independently predicted offspring BMI and, if both parents were overweight or obese, then the chances of offspring being overweight or obese were even greater than if one parent had excess body weight. In the MCS, there was evidence that socioeconomic patterning of weight gain to 3 years was linked to parental weight gain. In families where the household socio-economic classification was „never worked or long term unemployed‟, weight gain from 9 months to 3 years was predicted by maternal weight gain over the same period. Socioeconomic patterning of weight gain between 9 months and 3 years for the whole cohort was abolished once parental weight gain was taken into account. In the 1958 Birth Cohort, BMI in adulthood was better predicted by social class of origin than concurrent social class, although both had an independent effect.
The changing epidemiology of diet and physical activity
Markers of behavioural risk in the three studies were limited in their range and quality, providing only crude indicators of risk. We found some inconsistency in results of analyses of behaviours within the three analyses. Overall, whole milk consumption has decreased over time in the national health surveys. Over the same period consumption of lower fat (semi-skimmed and skimmed) milks increased. Milk consumption was patterned socio-economically, with the manual social class group more likely to drink whole milk. However, paradoxically, obesity and overweight were greater among those drinking lower fat milks than whole milk, which may be a consequence of people switching to lower fats milks in order to control weight or may be a result of response bias. Our inability to determine the direction of causality is an obvious limitation of cross-sectional analyses using the national health surveys.
Although fruit and vegetable consumption did not change over the short time frame for which data were available (2001 and 2004) in the national health surveys, it was consistently higher among older adult age groups and the higher social class group in adults. Greater fruit and vegetable consumption was associated with greater prevalence of overweight and lower prevalence of a high WHR in men, but a lower prevalence of obesity and lower prevalence of high WHR in women. Among boys, as in men, those eating more fruit and vegetables were more likely to be overweight, but there were no similar associations in girls.
Data on diet was similarly limited in the 1958 Birth Cohort. However, social class differences in diet tended to be greater for concurrent social class than social class of origin, suggesting a more important effect of present environment on behaviour.
Physical activity declined with age in all years of the national health surveys and was lower among women than men. However, trends over time were less clear and a social patterning was only observed in men, with manual social class men being more active. Nevertheless, lower levels of activity were associated with greater prevalence of obesity, overweight and high WHR, and this relationship was consistent over time. Among children there was some indication that levels of activity have declined over time, but activity was not associated with levels of
overweight or obesity.
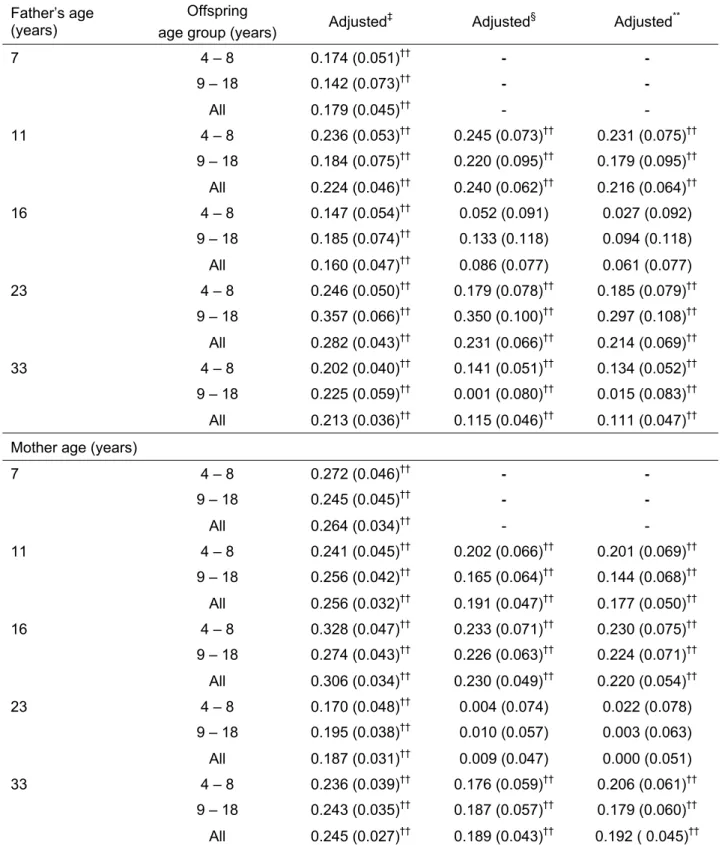
In contrast, data from the 1958 Birth Cohort showed an association between manual social class and lower levels of PA and, over time, social differentials in PA were better predicted by
concurrent socio-economic position (SEP) than social class of origin, again suggesting a more important role for environmental factors in adulthood. The conflicting findings on PA and body
mass in the cross-sectional and cohort studies may be due to the different methods used to assess PA, both of which were based on self-report.
Conclusions
Analyses of these three datasets have largely confirmed reported trends in obesity in the British population, including its strong social gradient. However, within this broad conclusion, there are a number of more detailed findings which have implications for future policy, practice and research.
Age, sex and socioeconomic trends in overweight and obesity
Obesity and overweight have increased over time since 1993 in the national health surveys. Levels of excess body weight are greater among women than among men, although there is some evidence that men are catching up. Levels of overweight and obesity increase with age from childhood up to age 75 years. This finding supports the conclusion that efforts to prevent or reduce obesity and overweight need to start early in life and continue at least until retirement age.
Socioeconomic inequalities in body mass are marked but data from the HSE suggests these do not appear to have widened over the last 15 years. There is a clear need to focus on this
inequality and reduce the gap between rich and poor. Implementation of the recently published guidance from the National Institute for Health and Clinical Excellence (NICE ) on prevention and management of obesity will need to take account of this social patterning and ensure that the interventions proposed do not inadvertently further widen inequalities in obesity and overweight. Levels of obesity are worse in some regions of the UK than others, after controlling for social and demographic factors. These regions, which include Scotland, the North East, Yorkshire and Humber, and the East and West Midlands, will need to make greater efforts to reduce levels of obesity than those regions with relatively lower levels of obesity.
Weight gain among parents and its influence on weight gain in children
The presence of intergenerational effects in both cohort studies was striking and suggests an important priority for public health interventions. Intergenerational effects may presently be amplifying the growth of the obesity epidemic through the generation of a repeating cycle, with obese parents having obese children, who become obese parents, and so on. Breaking this cycle will require a range of interventions including attention to preventing excessive weight gain in early childhood, among young parents and during pregnancy.
BMI was associated with social class in both early life and adulthood in the 1958 Birth Cohort, although there was a tendency for social differences to be greater for class of origin than
concurrent social class. In contrast social differences in dietary factors, and for men PA, tended to be greater for concurrent social class. This suggests that the origins of social inequalities may be different for BMI, activity and dietary habits and that interventions aimed at modifying behaviour in mid-life may be only partly successful in reducing inequalities in obesity. Given this, we would not necessarily expect social inequalities in activity and diet to mirror those for BMI over time. This may also provide another argument for initiating efforts to prevent obesity early, preferably in childhood. However, efforts to change diet and PA behaviour will need to continue among adults. Recent BMI gain in parents was associated with offspring BMI in childhood, which may be due to environmental or genetic influences. Therefore, it would be beneficial to help parents to adopt lifestyle changes that can provide role models for their children and shape the environment for their children.
The MCS found socioeconomic gradients in weight gain in a contemporary cohort of young children and their parents, contributing to the social patterning of obesity in children and adults. Although parental weight gain was not found to be strongly associated with faster weight gain in children from 9 months to 3 years, it was found to have a greater influence on children within „never worked or long-term unemployed‟ households, suggesting an „at risk‟ group. These households may benefit from targeted help with an emphasis on a family-based approach to weight management.
The changing epidemiology of diet and physical activity
Physical activity and diet are known to be important determinants of energy balance and thus body mass. Despite some inconsistent findings from these analyses, efforts to reduce energy intake and increase energy expenditure should continue to play an important role in reducing obesity and overweight and, for diet in particular, focus on lower social groups.
Implications for research
Overall, inconsistencies in the data collected and available for analysis from the national health surveys hinder their usefulness as a tool for research and policy analysis at national levels. An assessment of the data consistently needed to monitor trends relevant to Choosing Health, National Service Frameworks (NSFs), NICE Guidance and strategies to reduce health
inequalities would be of value. Better data are needed on energy intake from the whole diet and energy expenditure from all types of PA across age and social groupings. Further research is needed to understand better the relation ship between diet and PA, and SEP.
Contribution to the Public Health Research Consortium‟s main
research themes
This project focuses on the Consortium‟s main themes of health inequalities, and risk and health, as well the cross-cutting theme of obesity and its risk factors.
Background
Introduction
The prevalence of overweight and obesity* continues to increase globally and in the UK.2 Long-term consequences include raised risk of developing hypertension and stroke, coronary heart disease, diabetes, osteoarthritis and certain cancers.3 Recently, a socioeconomic gradient in the prevalence of excess body weight has emerged in the UK, such that it has increasingly become a condition associated with lower socioeconomic position.4 For example, in the 1958 birth cohort no socioeconomic gradient in overweight or obesity was observed in childhood or young
adulthood, but a gradient has emerged in mid-life.5 Recent cross-sectional studies6-8 suggest that socioeconomic gradients have become established in childhood. The emergence of these
gradients may be linked, since parental fatness predicts childhood fatness.9
The emerging socioeconomic gradient of obesity in children is of particular concern both because overweight and obese children have increased risk of obesity in adult life9 and weight management interventions among children and young adults are of limited effectiveness.10 11 Evidence from a longstanding national dietary survey indicates that in the post-war years absolute energy intakes gradually decreased, although some of this may be attributable to
measurement error.12 This suggests that declining levels of energy expenditure from habitual PA may have played an important role in the emerging obesity epidemic.13 14 However, less is known about the social patterning of diet and PA, and their relative importance as antecedents of overweight and obesity among different population groups.
In this project, we set out to use a range of existing datasets to explore the emerging socio-economic patterning of obesity and its main risk factors in the UK. Below, we briefly review the literature on obesity and SEP. We then briefly describe the present policy context in the UK. After a statement of the objectives of this research, we then present the findings of three sets of analyses using two longitudinal studies (the 1958 British Birth Cohort and the UK Millennium Cohort Study) and the largest annual cross-sectional study series available: the HSE and SHS.
Review of literature on trends in obesity and socio-economic position
A comprehensive literature search was conducted in October 2007 on the following databases: MEDLINE (1980-1995, 1996 to Sept 2006 week 4, Ovid), EMBASE (1980-2006, Ovid), Scopus (1980-Oct 2006) and Social Sciences Citation Index (1980-Oct 2006). Search words used in MEDLINE and EMBASE were: socioeconomic, economic, demographic or socio-demographic, social, education$ adj3 level, income, occupation, deprivation, inequality$ combined with obesity, overweight, bmi, body mass index, body weight, body fat, fatness, adiposity. The searches were adapted as required for Scopus and Social Sciences Citation Index. Government web sites were also searched for relevant information.
Socioeconomic position in childhood and obesity in adulthood
A systematic review of childhood predictors of adult obesity, conducted in 1999, reported a consistent inverse relationship (lower risk of fatness associated with higher social group)
between socioeconomic position (SEP) in childhood and adult obesity in both men and women.8 This conclusion was based on evidence from cohort studies. Of 12 studies included, none
*
We have used international cut off points for Body Mass Index (BMI) for overweight and obesity as described by Cole et al.. (1. Cole TJ, Bellizzi MC, Flegal KM, Dietz WH. Establishing a standard definition for child overweight and obesity worldwide: international survey. British
reported a positive relationship between childhood SEP and adult obesity, only 1 study reported no relationship and the remainder reported a negative association.
This inverse relationship between childhood SEP and adult obesity is strongly supported by findings from more recently published cohort studies in the UK. In longitudinal analyses from the 1958 British birth cohort, social class in children (based on father‟s occupation) at 7 years of age significantly predicted adult obesity in women at age 33 years.5 For men, social class at birth significantly predicted adult obesity. This result was not explained by parental BMI, the individual‟s current social position or educational level in adult life. In a 1946 UK birth cohort followed up to age 53 years, father‟s social class based on occupation when participants were aged 4 years was inversely associated with both central and total obesity in men and women aged 53 years.15 Data from the same cohort with follow-up of participants at 43 years of age found that childhood manual social class (defined by father‟s occupation at age 4 years)
compared to non-manual social class was associated with higher mean BMI across adult life and that the effect increased with age.16 17 The effect was independent of educational attainment and adult social class. In a cohort of Scottish children born between 1950 and 1956, low SEP at birth (based on father‟s occupation) was associated with adult overweight.18
The association was attenuated by adjustment for educational attainment but some association remained.
Studies on European populations have found similar conclusions to those conducted in the UK. Childhood SEP has been shown to have an inverse relationship with obesity in adulthood. In a 1966 birth cohort in Finland, SEP at 1 year of age (based on father‟s occupation) was inversely related to BMI in adulthood at age 31 years in both men and women. The relationship remained after adjustment for maternal BMI.19 Another cohort in Finland of people born between 1934 and 1944 found an inverse association between social class in childhood (defined by father‟s occupation in childhood) and the incidence of obesity in adult life in both men and women.20 European population surveys have shown similar conclusions.21
Possible mechanisms for the relationships between childhood factors and adult obesity have been described.22 These are nutrition in infancy or childhood, psychological factors, cultural or social attitudes to dietary restraint and fatness.
Childhood socio-economic position and childhood obesity
Evidence from cohort studies for a relationship between SEP in childhood and obesity at a later stage in childhood is more equivocal. In a study of the development of obesity in adolescents resident in London in relation to SEP, those in the lower quintile of SEP had higher rates of overweight and obesity at baseline in 1999, and this pattern was maintained over the five years of follow-up.23 Residential area was used as a measure of SEP. Over five years of follow-up from age 11 to 16, no further divergence of overweight and obesity was seen, suggesting that differences in overweight and obesity by SEP are established by the age of 11. However, differences were not graded across levels of SEP. In contrast, in a comparison of two birth cohorts conducted in Newcastle forty years apart, BMI was similar in both cohorts at 9 years of age and showed no gradient by deprivation in childhood for Body mass index standard deviation score (BMI-SDS) in either study, although a gradient was seen in adulthood.24 Studies included in the 1999 systematic review of the relationship between childhood SEP and childhood obesity also had mixed conclusions.8
Again, evidence from cross-sectional studies of an inverse relationship between SEP and obesity in children is mixed. In the 1999 systematic review by Parsons, in which 7 cross-sectional studies were included, some studies found an inverse association between SEP and obesity in children and some found no association.8
Power,5 in a cross-sectional analysis of the 1958 British birth cohort, found no social class trend in childhood obesity. Using data from the 1999 HSE, no differences in obesity and overweight in children and young adults were seen by social class.25
However, in an analysis of data from the 1997 national Diet and Nutrition Survey (NDNS) in young people aged 4 to 18, in which social class was determined by the occupation of the head of the household, there was an inverse relationship between obesity and social class. Prevalence of obesity was significantly higher in those in social classes IV and V than in classes I-III.6 Boys and girls aged 4 to 10 from schools with a high proportion of low income families were 65% more likely to be overweight.26 In pre-school children, obesity was highest in most deprived groups and lowest in least deprived groups.27 There is some evidence that obesity is increasing more rapidly in children of lower SEP. Data from the National Study of Health and Growth in 1974, 1984 and 1994 and from the HSE, yearly from 1996 to 2003, suggests that obesity seems to be increasing more rapidly among children from manual classes and lower income
households, with differences becoming increasingly marked since 2000.28
Results of national surveys do support a link between childhood SEP and obesity. A recent review of obesity in children under 11, collated from information collected by the HSE between 1995 and 2003 reported that the prevalence of overweight and obesity has increased in this population of children since 1995. The prevalence of overweight rose from 22.7 % in 1995 to 27.7 % in 2003 and the prevalence of obesity rose from 9.9% in 1995 to 13.7% in 2003.29 In an analysis that compared children from households based on manual or non-manual occupations, significantly more children from manual households were obese than non-manual households in 1998, 2002 and 2003. There were also significant differences, with levels of obesity higher in those living in the most deprived areas (16.4%) compared to the least deprived areas (11.2%).29 Childhood obesity was also higher in the two highest income quintiles compared to the two lowest income quintiles. In children classified by the National Statistics Socio-Economic Classification (NS-SEC), prevalence of childhood obesity was lowest (12.4%) among
managerial or professional households and highest among those with routine or semi-routine occupations (17.1%).29
Evidence for an inverse relationship between childhood SEP and obesity in childhood from European studies seems to be clearer than in UK studies. In a cohort of Danish school children who were 8-10 years old at baseline and 14-16 years old at follow up 6 years later, there were no significant differences in tracking of BMI between those in white-collar or blue collar
occupations.30 A significant inverse social gradient was seen in the prevalence of overweight in the 14 to 16 year old adolescents but not in those aged 8-10 years. A retrospective cohort study of Belgian adolescents followed between the ages of 12 and 15 years also concluded that social inequalities in obesity develop during adolescence.31 In boys at age 12 years the greatest prevalence was found in the middle social group and at age 15 the prevalence of obesity was progressively greater lower down the social scale, although differences between groups were not significant. In girls, a significant social inverse gradient was already present at age 12 and was accentuated by age 15.
Widening of inequalities in obesity have been reported in French children between 1989 and 1999.32 The mean BMI in 1999 was higher for children with fathers who were in lower
occupational grades or unemployed relative to 1989. For children in the highest social classes, there was no change in BMI.
Data from cross-sectional and population surveys also supports an inverse relationship between childhood SEP and obesity in children. In Germany, an inverse social gradient was found in a survey of 5-7 years old children.33 A nationally representative sample of Spanish adolescents34
males but not in females. In males, the prevalence of overweight increased as socioeconomic position decreased from the high to medium-low socioeconomic groups.
Socio-economic position in adulthood and obesity in adulthood
An inverse relationship between current SEP in adulthood and obesity has been noted in many UK cohort studies. In a cohort of London-based civil servants (Whitehall II), civil service employment grade in both men and women was strongly related to BMI gain from age 25 to follow up 25 years later.35 Those in lower grades had larger gains in BMI over 25 years than those in higher grades. Higher father‟s social class by occupation in a 1970 British birth cohort predicted loss of BMI between the ages of 16 and 30 years.36
However, different cohort studies have reported contrasting effects for men and women and by the age at which obesity was measured. The 1946 UK birth cohort found that in women, but not in men, there were independent, inverse associations between adult social class at ages 26 years and 43 years with all obesity measures at age 53 years.15 The results were adjusted for childhood circumstances. Social class was based on occupation according to the registrar general‟s
classification. However, the 1958 British birth cohort,5 which also used occupation as a marker for SEP, found no relationship between obesity and SEP in adult or adolescent women. In men social class at age 23 was a predictor of adult obesity.
There is some evidence that a gradient of higher rates of obesity in those of lower SEP may emerge in early adulthood. In cross-sectional analyses of the 1958 British birth cohort, by early adulthood a social gradient had emerged for both sexes, with increasing prevalence of fatness from classes I and II to classes IV and V.5 The social gradient emerged earlier for women, by age 16 years, but after that a social gradient was seen for both sexes. In a Newcastle birth cohort, a deprivation gradient measured by father‟s occupation, also became apparent in adulthood but was not found in childhood.24 A cohort study of men and women in Stockport concluded that socioeconomic differences in obesity are mainly attained prior to 35 years of age. BMI of non-obese participants increased over time independently of deprivation status (assessed by Townsend Deprivation Score (TDS) of area of residence), whereas in obese participants, a positive association with higher deprivation was found.
An inverse relationship has also been found in some UK cross-sectional studies. Surveys in Britain and from other industrialised countries have found an inverse social gradient in the prevalence of abdominal obesity among both men and women.37 A recent survey which used council tax valuation bands, NS-SEC and the Townsend Deprivation index as markers of SEP found a clear association by all 3 methods of an inverse gradient between current SEP and obesity.38 However, in an earlier study in Scottish men, aged 35 to 64, current social class measured by occupation was not significantly related to BMI.39
In an analysis of obesity among people aged 16 and over using data from the HSE by social class of the head of the household and gender,40 the prevalence of obesity (BMI >30kg/m2) in women and men was markedly lower among those in professional (women 15.1%; men 12.0%) and managerial occupations (women 19.9%; men 12.0 %) than those in unskilled manual
occupations (women 31.4%; men 19.3%). Prevalence of obesity was higher for women than men in all occupational groups. In a more recent analysis in the same population, results were reported by sex and by NS-SEC. This classification is based on occupation but included some different categories from the 1998 analysis. Women in higher managerial and professional occupations had a much lower percentage of obesity (16%) than women in any other classification and there was a consistent gradient between social classification and obesity prevalence. In men, while those in higher managerial and professional occupations had lower
prevalence of obesity than most other groups (16%), the gradient was not as marked as for women.
An earlier review conducted in 1987 examined the relationship of SEP to weight change over time using studies from developed countries.41 Using the methodologically strongest studies, there were relatively consistent inverse associations between occupation and weight gain for men and women.
A relationship between SEP in adulthood and obesity in adulthood is as clearly defined in European studies as it is in UK studies. In Finnish men and women who were born in Helsinki between 1934 and 1944 and were still resident in Finland in the year 2000, there was an inverse relationship between educational attainment and the incidence of obesity in adult life.20 Low educational level, but not occupational class in both men and women was associated with overweight at age 30 in a cohort followed up for 14 years from age 16 to 30.42 BMI at age 31 years was inversely related to social class at 31 years (based on father‟s occupation) in adults from a 1966 Finland birth cohort in both men and women.19 Data from population surveys and cross-sectional analyses also supports an inverse link between SEP in adulthood and obesity.21 43 However, it has been reported that in younger Swedish adults, the socioeconomic gap narrowed, not widened, between 1980 and 1997.44
Social mobility
The 1999 systematic review8 also noted that social mobility appeared to have an effect on obesity only in women, with the prevalence of overweight less in those moving upwards in the social scale. Three studies were included that looked at social mobility and adult obesity in men, and all found no relationship. From 2 studies in women, those moving up the social scale had a lower prevalence of obesity than those who were downwardly mobile. Additionally, in an analysis of data from a 1946 cohort study, in which SEP was classified by occupation, both men and women who were upwardly or downwardly mobile tended to have characteristics between the class they left and the class they joined.15 However, obesity itself may reinforce social inequalities.45
Parental BMI status
There is some consistent evidence that indicates a positive relationship between parental
overweight and overweight in children. In the UK, in reports from the Avon Longitudinal Study of Parents and Children (ALSPAC), parental obesity was a strong predictor of obesity in 7 year old children.46 When only one parent was obese, the risk of obesity at age 7 was increased. When both parents were obese, the risk was even higher (adjusted odds ratio 10.44, 95% CI 5.11 to 21.32). Parental obesity has also been associated with early adiposity rebound in ALSPAC.47 Early adiposity rebound has been associated with higher BMI in adolescence and young
adulthood.
In Australian studies, BMI in 18 year olds was significantly predicted by their mother‟s and father‟s BMI, independent of other lifestyle variables.48
Also in Australia, maternal obesity but not paternal obesity were significantly associated with BMI and waist circumference in young people aged 12 to 13 years.49
In a survey of obesity in children under 11 from the HSE,29 there was a clear relationship between parental BMI and rates of childhood obesity. In households where both parents were classified as obese or overweight, 19.8% of children were obese, compared to 6.7% of children in households where neither parent was obese or overweight.
Relationships between diet and physical activity and socio-economic position
A report on the health of children and young people,50 which was based on data from the NDNS surveys, found that a higher proportion of children and adolescents from lower SEP households than those from higher SEP households consumed burgers, kebabs, chips and sugar or sugar confectionery. Comparisons were made between the bottom and top quintiles of weekly
household income. In contrast, children and adolescents from higher SEP households were more likely to have consumed raw and salad vegetables, apples and pears, citrus fruits, bananas and fruit juice.
Energy intake of girls aged 4 to 18 was similar between girls from wealthier households compared to girls from poorer households. However, boys living in households receiving benefits had significantly lower energy intakes (80% of estimated energy requirement) than did boys in households not receiving benefits (91% of estimated energy requirement).
The development of obesity in those of lower SEP may be may be related to social class differences in the estimation of energy contents of foods. High fat foods may be perceived to have lower energy contents by those in lower social classes than in higher social classes.51 There are mixed messages from research about relationships between PA and SEP in children. In a 5 year longitudinal study of children aged 11-12 years at baseline, there was no association between SEP and PA in boys. In girls, those from lower SEP were less active and the effect of SEP did not change throughout the 5 years.52 In the same study, levels of sedentary behaviour were greater in students from lower SEP backgrounds and again this difference was maintained throughout the study. Measures of SEP, including high family income at birth, high maternal education at birth and female gender have been linked to a sedentary lifestyle at ages 10 to 12 years.53
In secondary school children, it has been reported that SEP does not influence the time spent in PA54 and there were no significant differences in fat intake between the sexes or across SEP. Physical activity was assessed by questionnaire. In a study in which PA was assessed by accelerometry, generally considered to be an accurate measure of PA, there were also no
significant differences in time spent in PA or sedentary behaviour between affluent and deprived groups.55 However, measures of SEP, including high family income at birth, high maternal education at birth and female gender have been linked to a sedentary lifestyle at ages 10 to 12 years.53
In adults, few cohort studies demonstrating the relationships between diet, PA and SEP were found. In a 14 year longitudinal study of Swedish men and women followed between the ages of 16 and 30 years, lack of PA was one factor that contributed to an association between
educational level and overweight at age 30 years. A significantly higher percentage of those with less than 11 years of education never participated in PA compared to those with more than 12 years of education.42
Geographical variations
In a comprehensive review of obesity in children and young people it has been reported that in industrialised countries obesity is more prevalent in children aged 6 to 18 years in lower income groups than in developing countries with the comparisons used being the USA and Brazil .56 57 In adults, in the developed world, obesity is inversely related to SEP but in developing countries the opposite relationship applies, with those with higher socioeconomic position having higher rates of obesity.58 In Europe, the highest prevalence levels for childhood obesity are observed in southern European countries and northern European countries tend to have lower prevalence.56