Sharif University of Technology
Scientia IranicaTransactions A: Civil Engineering www.scientiairanica.com
Reliable seismic collapse assessment of short-period
structures using new proxies for ground motion record
selection
M. Yakhchalian
a;, G. Ghodrati Amiri
band M. Eghbali
ca. Department of Civil Engineering, Qazvin Branch, Islamic Azad University, Qazvin, P.O. Box 34185-1416, Iran.
b. Center of Excellence for Fundamental Studies in Structural Engineering, School of Civil Engineering, Iran University of Science & Technology, Tehran, P.O. Box 16765-163, Iran.
c. School of Civil Engineering, Iran University of Science & Technology, P.O. Box 16765-163, Tehran, Iran. Received 19 November 2015; received in revised form 27 May 2016; accepted 9 July 2016
KEYWORDS Ground motion record selection;
Short-period structures; Reliable seismic collapse assessment; Epsilon;
Gamma; Fragility curve.
Abstract. One of the important steps in seismic collapse assessment of structures, using nonlinear dynamic analyses, is the appropriate selection of ground motion records. Epsilon ("Sa), eta (), and gamma () for long-period structures are proxies recently proposed
for Ground Motion Record Selection (GMRS). In this study, two parameters, named s,
are proposed, which have considerable correlation with the collapse capacity of short-period structures having fundamental short-period less than 1 sec. One of these parameters is a linear combination of "Sa, epsilon of Pseudo Spectral Acceleration (PSA) at 1.5 times
of the fundamental period of the structure ("Sa(1:5T1)), and "PGV. The other one is a
linear combination of "Sa, "Sa(1:5T1) and epsilon of spectrum intensity, "SI. To obtain
and optimize s, the Particle Swarm Optimization (PSO) algorithm is applied. Since
the parameters proposed as s have signicant correlation with the collapse capacity of
short-period structures, they can be used as ecient proxies for GMRS in seismic collapse assessment of short-period structures. The results show that GMRS using s leads to a
reduction in the dispersion of structural collapse capacity in comparison with GMRS based on "Sa or .
© 2017 Sharif University of Technology. All rights reserved.
1. Introduction
Assessing the probability of collapse is an important part of Performance-Based Earthquake Engineering (PBEE). Selection of appropriate ground motion records is a key issue in reliable collapse simulation of structures by using nonlinear dynamic analyses. In fact, the structural collapse under high-amplitude
*. Corresponding author. Tel.: +98 28 33231706
E-mail addresses: m [email protected] (M. Yakhchalian); [email protected] (G. Ghodrati Amiri); m [email protected] (M. Eghbali).
doi: 10.24200/sci.2017.4162
ground motions is signicantly aected by ground motion spectral characteristics. According to Baker and Cornell [1] and Haselton et al. [2], for a given ground motion hazard level, the shape of Uniform Hazard Spectrum (UHS) can considerably dier from the spectral shape of a real ground motion record, which has an equally high spectral amplitude at a single period. In other words, in UHS, the spectral accelerations in all periods have the same exceedance probability, and because the joint occurrence of these spectral accelerations, with the same exceedance probability, is very unlikely, the spectral shape of UHS and that of a real ground motion are considerably dierent. Therefore, it is important to account for the spectral shape of rare ground motions in the Ground
Motion Record Selection (GMRS) for reliable seismic collapse assessment of structures.
Baker [3] showed that structural response and collapse capacity are dependent on epsilon ("Sa) values
of ground motion records, which are used for seismic response analyses. Parameter "Sa represents the
number of standard deviations that the logarithmic spectral acceleration at the fundamental period of the structure, ln Sa(T1), for a certain ground motion
record is away from the average value estimated for the records of the same general characteristics by a Ground Motion Prediction Equation (GMPE) [3,4]; it can be obtained as follows:
"Sa=ln Sa(T1) ln Sa
ln Sa ; (1)
where ln Sa(T1) is the natural logarithm of observed
Sa(T1) in a particular ground motion record; ln Saand
ln Saare the predicted mean and standard deviation of
ln Sa(T1), respectively. In fact, "Sa is a spectral shape
indicator at the fundamental period of the structure, T1. Based on the studies by Baker and Cornell [1,3,5],
the eect of "Sa on structural response is more
dis-tinctive than those of magnitude and distance. They found that the mean collapse capacity of a structure increases with increasing "Sa of ground motions used
for collapse simulations, and this increase may be signicant. Other researchers also pointed out the key eect of spectral shape in seismic collapse assessment (e.g., [6-9]). Therefore, "Sa can be used as a proxy for
GMRS to account for the eect of spectral shape, corre-sponding to a target seismic event, in seismic collapse assessment of structures. To use "Sa as a proxy for
GMRS, a set of ground motion records having a mean "Sa value equal to target "Sa, obtained from seismic
hazard disaggregation [10,11], should be selected. After selection of ground motion records with regard to "Sa,
Sa(T1) can be used as a scalar Intensity Measure (IM).
This GMRS procedure leads to reliable seismic collapse assessment of structures by reduction in the bias and dispersion of structural collapse capacity.
Increasing the reliability of seismic collapse assessments by using an ecient GMRS procedure motivates researchers to propose more ecient proxies for GMRS. To propose an ecient proxy for GMRS, Mousavi et al. [12] investigated the linear combinations of "Sa with epsilons of dierent peak ground IMs (i.e.,
PGA, PGV, and PGD) to be used instead of "Sa.
They proposed a new proxy termed \eta" (), which is a linear combination of "Sa and the peak ground
velocity epsilon, "PGV(see Eq. (2)). They showed that
has higher correlation with the collapse capacity of structures, compared with "Sa, and its use in GMRS
instead of "Sa leads to a considerable reduction in the
dispersion of structural collapse capacity prediction. It should be noted that the amount of this reduction is
related to the size of the correlation between the proxy parameter (i.e., ) and the structural collapse capacity: = "Sa 0:823"PGV: (2)
Yakhchalian et al. [13] also used the idea of combin-ing epsilons of dierent IMs to propose an ecient proxy for GMRS in seismic collapse assessment of tall buildings. In addition to "Sa and epsilons of
peak ground IMs, they used Displacement Spectrum Intensity (DSI) [14] epsilon, "DSI. They investigated
dierent linear combinations of epsilons to nd a com-bination having higher correlation with the collapse ca-pacity of long-period structures, when compared with "Saand , and proposed a new proxy termed \gamma"
() which is a linear combination of "Sa and "DSI for
GMRS in seismic collapse assessment of long-period structures (see Eq. (3)). When a structure subjected to a ground motion is close to collapse, its period increases considerably and its collapse capacity is dependent on the spectral characteristics of the ground motion record in the period range of its near-collapse period. Due to the fact that DSI represents the severity of long-period ground motion amplitudes, parameter has high correlation with the structural collapse capacity:
= "Sa 0:861"DSI: (3)
Typically, there are two general methods for reliable seismic collapse assessment of structures by using nonlinear dynamic analyses. The rst method, as described above, is accounting for the spectral shape in GMRS procedure and using a common Intensity Measure (IM) for the seismic analyses. The second one is using advanced IMs (e.g., [9,15-18]), which are able to account for the eect of spectral shape in seismic analyses. The present study focuses on the rst method to obtain ecient proxies for GMRS in seismic collapse assessment of short-period structures by combining epsilons of dierent IMs. After investigating dierent combinations of epsilons, two new parameters, named s, were proposed for
structures having fundamental period less than 1 sec. These parameters have better correlation with the collapse capacity of short-period structures when compared with "Sa and . The purpose of this study
is to complete the previous research publication by Yakhchalian et al. [13] on the subject of GMRS for reliable seismic collapse assessment of structures. 2. Calculating epsilons of IMs
To obtain the optimal combinations of epsilons that have considerable correlation with the collapse capacity of short-period structures, epsilons of IMs should be calculated. The considered IMs are pseudo spectral
accelerations at the fundamental period of the struc-ture and two larger periods (i.e., Sa(T1), Sa(1:5T1),
and Sa(2T1)), peak ground IMs (i.e., PGA, PGV, and
PGD), and integral-based IMs such as Acceleration Spectrum Intensity (ASI), Spectrum Intensity (SI), and Displacement Spectrum Intensity (DSI). The integral-based IMs are dened as [14,19,20]:
ASI = Z 0:5
0:1 Sa(T )dT; (4)
SI = Z 2:5
0:1 Sv(T )dT; (5)
DSI = Z 5
2 Sd(T )dT; (6)
where Sa(T ), Sv(T ), and Sd(T ) are the 5% damped pseudo-acceleration, pseudo-velocity, and displacement response spectra, respectively. ASI, SI, and DSI are indicators of the severity of short-, moderate-, and long-period content of ground motions, respectively.
Calculation of epsilon is common for spectral acceleration ("Sa), but epsilons of dierent IMs, which
have GMPEs, can also be calculated. In fact, the epsilon of an IM ("IM) is the normalized residual for
the IM and can be calculated as: "IM=ln IM ln IM
ln IM ; (7)
where ln IM is the natural logarithm of the IM observed in a particular ground motion; ln IM and
ln IM are the predicted mean and standard deviation
of ln IM, which are functions of the earthquake rupture and site of interest. In this study, the Campbell and Bozorgnia GMPE [21] that has been developed as part of the Next Generation Attenuation of Ground Motions (NGA) project for the prediction of Sa(T ), PGA, PGV, and PGD was used for the calculation of "Sa, "Sa(1:5T1), "Sa(2T1), "PGA, "PGV, and "PGDvalues.
To calculate "IM values for the integral-based IMs
(i.e., "ASI, "SI, and "DSI), their GMPEs are required.
Therefore, the method proposed by Bradley [14,19] and Bradley et al. [20] for the prediction of ASI, SI, and DSI using the GMPE for Sa(T ) was used. 3. Collapse capacity of SDOF systems
To investigate the eciency of dierent combinations of "IMparameters as a proxy for GMRS, a set containing
54 nonlinear Single-Degree-Of-Freedom (SDOF) sys-tems created in OpenSees [22] was used. Nine period values of T = 0.2, 0.3, 0.4, 0.5, 0.6, 0.7, 0.8, 0.9 and 1.0 sec were considered for the SDOF systems, and six ductility values of = 2; 4; 6; 8; 10, and 12 were
as-sumed for each period. The Bilinear model [23] was ap-plied to model the SDOF systems, and cyclic deteriora-tion was neglected. The post-yield hardening stiness ratio was considered equal to 0.02, and the ductility to the onset of negative stiness was assumed to be 0.9 of the total ductility of the SDOF system (c= 0:9).
Moreover, a mass proportional damping ratio of 0.05 was considered for all of the SDOF systems.
Nowadays, Incremental Dynamic Analysis (IDA) [24] is a favorable method for seismic performance assessment of structures, used by many researchers. To obtain collapse capacities of the SDOF systems, IDAs were performed by using a set containing 67 ground motion records, applied by Yakhchalian et al. [13]. The selected records were taken from the PEER NGA database [25]. In this study, a procedure was used to overcome the convergence problems that occur in the nonlinear dynamic analyses. This procedure gradually decreases the time step size for analysis, dt, until the solution converges. If decreasing dt does not lead to convergence, then the procedure uses other solution algorithms in the OpenSees. If changing the solution algorithm and also decreasing dt for each solution algorithm still does not lead to convergence, then the procedure increases the test tolerance to converge the solution. To perform IDA, the amplitude of each record, Sa(T1), was scaled to an increasing intensity
until it causes collapse. The collapse occurs when an SDOF system reaches its zero strength and nal duc-tility [26]. Consequently, the collapse capacity, Sacol,
was obtained for each ground motion record. The Hunt and Fill algorithm [24] was used to obtain the collapse capacity values corresponding to each of the SDOF systems. This algorithm is a tracing algorithm that increases Sa(T1) by a constant step until the collapse
is reached, and then uses smaller steps to increase the accuracy of the IDA curve. Having the collapse capacity values for the SDOF systems, the correlation between dierent combinations of "IMparameters and
the collapse capacity can be investigated. 4. Obtaining ecient proxies for GMRS
In this study, knowing that each "IMcan represent part
of information hidden in a given ground motion record, dierent combinations of "IM parameters were
inves-tigated to propose an ecient predictor of structural collapse capacity. In fact, to have an ecient proxy for GMRS in seismic collapse assessment of short-period structures, the proposed proxy parameter should be an ecient predictor of structural collapse capacity (Sacol), i.e. appropriately correlated with ln Sacol. The
size of correlation between a proxy parameter and ln Sacol shows the ability of the proxy parameter to
reduce the dispersion of collapse capacity prediction (record-to-record variability) when used for GMRS.
Yakhchalian et al. [13] showed that "Sa is more
ecient than other "IM parameters, considered alone,
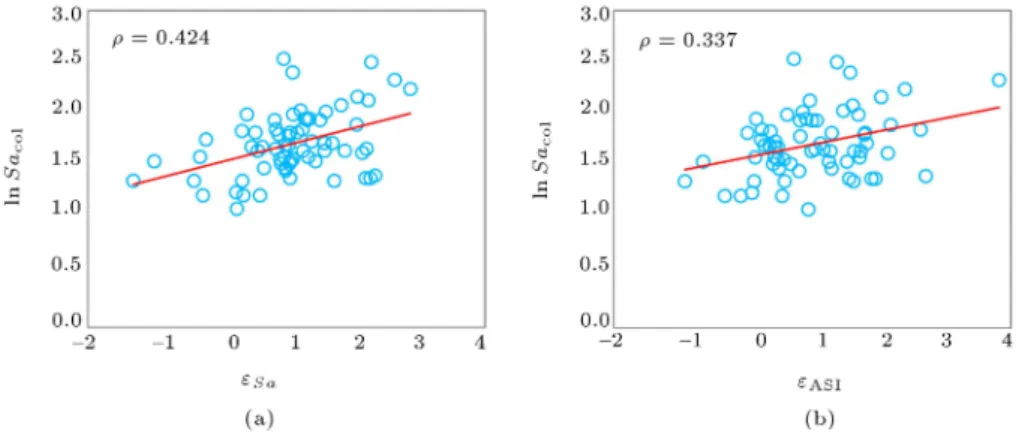
to predict the collapse capacity of SDOF systems having period greater than 1 sec. Similarly, this issue can be examined in the case of short-period SDOF systems. Figure 1 shows the correlation between the collapse capacity of an SDOF system and parameters "Sa and "ASI. It can be seen that ln Sacol is more
correlated with "Sa than "ASI. Such a result was
also observed for "IM parameters other than "ASI.
To propose ecient proxies being highly correlated with the structural collapse capacity, dierent linear combinations of "IM parameters were investigated as
s. Eq. (8) indicates the general form considered for s:
s="Sa+ k1"Sa(1:5T1)+ k2"Sa(2T1)+ k3"PGA
+k4"PGV+k5"PGD+k6"ASI+k7"SI+k8"DSI: (8)
It should be mentioned that all of "IM parameters,
shown in Eq. (8), are not necessary to exist in a combination. For each of the assumed combinations, values of coecients ki were optimized by Particle
Swarm Optimization (PSO) algorithm [27] to make the combination appropriately correlated with the collapse capacity of the considered SDOF system. In a com-bination of "IM parameters, the optimum coecients
determined for each SDOF system are dependent on the structural characteristics such as period and duc-tility. For each SDOF system, assuming a lognormal distribution for the collapse capacity values obtained from IDAs, the values of ln Sacol were normalized to
the standard form with a zero mean and unit variance. Then, to eliminate the dependency of the optimized s
on the structural characteristics, similar to the method used by Yakhchalian et al. [13], the optimization process was performed on the whole values of normalized ln Sacolfor all of the SDOF systems.
The Kolmogorov-Smirnov (KS) test [28] was ap-plied to check the assumption of lognormal distribution for Sacol values corresponding to each of the SDOF
systems. In general, the KS test is used to investigate if the distribution of a random variable (here, Sacol)
can be approximated using a specic distribution (e.g., lognormal distribution), and its result is a p-value. Typically, a p-value greater than 0.05, obtained from the KS test, conrms the assumed distribution for Sacol
values. The results of the KS tests, for all of the SDOF systems, conrmed the lognormal distribution of Sacol. As an instance, Figure 2 presents the IDA
curves, collapse capacity points, normalized backbone curve, and the Probability Density Function (PDF) of a lognormal distribution tted on the normalized histogram of Sacol for an SDOF system. It can
be seen that there is a good resemblance between the normalized histogram of Sacol and the PDF of
lognormal distribution; the p-value obtained from the KS test is greater than 0.05.
After normalizing ln Sacol values for all of the
SDOF systems to the standard form, a vector of size 3618 (54 67) for the normalized ln Sacol values was
obtained. In addition, according to Section 2, nine vectors with the same size for "Sa, "Sa(1:5T1), "Sa(2T1),
"PGA, "PGV, "PGD, "ASI, "SI, and "DSIcorresponding to
the vector of collapse capacity values were obtained. To achieve the maximum correlation between the vector of normalized ln Sacol values and each combination
of "IM parameters, the PSO algorithm was applied.
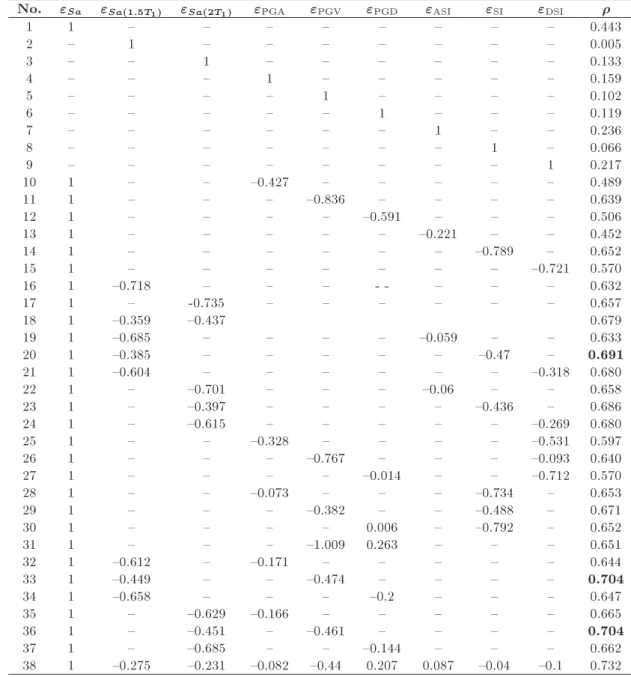
Table 1 presents the optimum coecients obtained for dierent combinations and the corresponding Pearson correlation [29] coecients (). It can be seen that "Sa, as a structural collapse capacity predictor, has
the highest correlation with the collapse capacity of the SDOF systems, compared with the other single "IM parameters. However, adding other "IM
pa-rameters to "Sa, in a combination, can result in a
more ecient predictor of structural collapse capacity. The results show that combination 11, containing "Sa
and "PGV, and combination 14, containing "Sa and
"SI, are more ecient than combination 15, which
contains "Sa and "DSI. The reason for this issue is
Figure 1. Correlation between the collapse capacity of an SDOF system (T = 0:5 sec and = 4) and epsilons of intensity measures: (a) "Sa and (b) "ASI.
Figure 2. (a) IDA curves, collapse capacity points and normalized backbone curve. (b) PDF of a lognormal distribution tted on the normalized histogram of Sacol, for an SDOF system with T = 0:5 sec, = 4 and the yield strength to weight
ratio Fy=W = 0:15.
Table 1. Results of optimization for dierent combinations of "IMparameters and the corresponding correlation
coecients.
No. "Sa "Sa(1:5T1) "Sa(2T1) "PGA "PGV "PGD "ASI "SI "DSI
1 1 { { { { { { { { 0.443
2 { 1 { { { { { { { 0.005
3 { { 1 { { { { { { 0.133
4 { { { 1 { { { { { 0.159
5 { { { { 1 { { { { 0.102
6 { { { { { 1 { { { 0.119
7 { { { { { { 1 { { 0.236
8 { { { { { { { 1 { 0.066
9 { { { { { { { { 1 0.217
10 1 { { {0.427 { { { { { 0.489
11 1 { { { {0.836 { { { { 0.639
12 1 { { { { {0.591 { { { 0.506
13 1 { { { { { {0.221 { { 0.452
14 1 { { { { { { {0.789 { 0.652
15 1 { { { { { { { {0.721 0.570
16 1 {0.718 { { { - - { { { 0.632
17 1 { -0.735 { { { { { { 0.657
18 1 {0.359 {0.437 0.679
19 1 {0.685 { { { { {0.059 { { 0.633
20 1 {0.385 { { { { { {0.47 { 0.691
21 1 {0.604 { { { { { { {0.318 0.680
22 1 { {0.701 { { { {0.06 { { 0.658
23 1 { {0.397 { { { { {0.436 { 0.686
24 1 { {0.615 { { { { { {0.269 0.680
25 1 { { {0.328 { { { { {0.531 0.597
26 1 { { { {0.767 { { { {0.093 0.640
27 1 { { { { {0.014 { { {0.712 0.570
28 1 { { {0.073 { { { {0.734 { 0.653
29 1 { { { {0.382 { { {0.488 { 0.671
30 1 { { { { 0.006 { {0.792 { 0.652
31 1 { { { {1.009 0.263 { { { 0.651
32 1 {0.612 { {0.171 { { { { { 0.644
33 1 {0.449 { { {0.474 { { { { 0.704
34 1 {0.658 { { { {0.2 { { { 0.647
35 1 { {0.629 {0.166 { { { { { 0.665
36 1 { {0.451 { {0.461 { { { { 0.704
37 1 { {0.685 { { {0.144 { { { 0.662
that PGV and SI indicate the severity of moderate-period content of ground motion records, whereas DSI indicates the severity of long-period content of ground motion records. When a short-period structure is close to collapse, its elongated period is in the range of moderate periods; thus, "PGVand "SIhave more eect
on its collapse capacity compared with "DSI. When
combining at least two "IM parameters, the obtained
coecient for each "IM expresses the weight of that
"IM in the considered combination. For example, in
combination 30, which contains "Sa, "SI, and "PGD, the
obtained coecient for "PGD(i.e., 0.006) indicates that
"PGD has negligible eect on the achieved correlation
coecient, when compared with "Sa and "SI. The
results indicate that combination 20 (containing "Sa,
"Sa(1:5T1), and "SI), combination 33 (containing "Sa,
"Sa(1:5T1), and "PGV), and combination 36 (containing
"Sa, "Sa(2T1), and "PGV) have comparatively high
correlation with the structural collapse capacity. It should be noted that combinations 33 and 36 result in the same correlation coecients, and also the obtained coecients for "Sa(1:5T1) and "Sa(2T1) in these
combi-nations are approximately the same. It can therefore be inferred that using "Sa(1:5T1) or "Sa(2T1) does not
lead to signicant dierence in the results. Thus, from these two combinations, combination 33 was selected. Furthermore, combination 38, which contains all of considered "IMparameters, has the highest correlation
coecient. However, its correlation coecient is not
signicantly higher than those from combinations 20 and 33, which are simpler. Therefore, combinations 20 and 33, due to their high correlation and simplicity (using fewer "IM parameters), were selected as the two
ecient predictors of structural collapse capacity. The proposed parameters as sare presented in Eq. (9):
s= "Sa 0:449"Sa(1:5T1) 0:474"PGV;
or:
s= "Sa 0:385"Sa(1:5T1) 0:47"SI: (9)
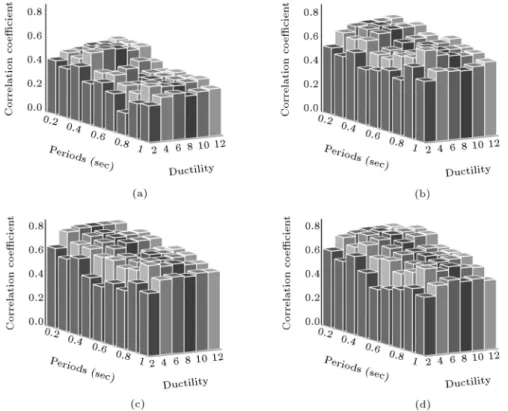
Figure 3(a)-(d) illustrate the correlation coecients between ln Sacol values of the SDOF systems and "Sa,
and s, respectively. It can be seen that the proposed
parameters as s are more ecient than "Sa and for
predicting the structural collapse capacity.
Mousavi et al. [12] used the genetic algorithm [30] to propose parameter . As described previously, in this study, the PSO algorithm was used to optimize coecients ki in each combination of "IM parameters.
In combination 11, which contains "Sa and "PGV, the
value obtained for the coecient of "PGV is {0.836.
This value is very similar to that of {0.826 obtained by Mousavi et al. [12] as the coecient of "PGV in
parameter . Thus, considering the dierences between the SDOF systems and ground motion records used in both studies, it can be inferred that the optimization algorithm used does not have signicant eect on the results.
Figure 3. Correlation coecients between the collapse capacity of the SDOF systems: (a) "Sa, (b) , (c) s= "Sa
5. Using s for collapse capacity prediction of
an MDOF structure
To investigate the eciency of s for predicting the
collapse capacity of short-period structures, a Multi-Degree-Of-Freedom (MDOF) 6-story structure with a fundamental period of 0.6 sec was considered. It is one of the two-dimensional generic one-bay frames designed by Medina and Krawinkler [31] and also used by Ibarra and Krawinkler [32]. The structural model was created in OpenSees. The nonlinear behavior was modeled by using rotational springs at both beam ends and the bottom end of the rst-story columns. Bilinear model [23] was used to specify the nonlinear moment-rotation behavior of the moment-rotational springs, and cyclic deterioration was neglected. For each member, the post-yield and negative post-capping stiness ratios of 0.03 and {0.1 were assumed, respectively, and the member ductility capacity value, c=y, was considered
to be 4. For nonlinear time history analyses, 5% Rayleigh damping was assigned to the rst mode and the mode at which the cumulative mass participation exceeds 95%. Furthermore, the P eect was considered in modeling.
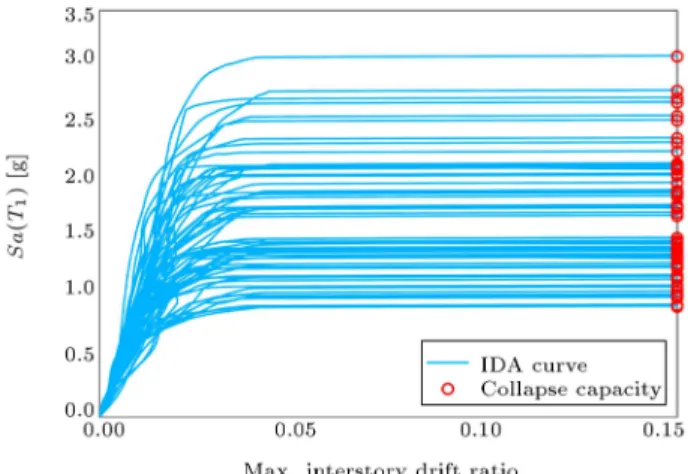
The IDA approach was applied to determine the collapse capacity of the structure. The far-eld ground motion record set, used for analyzing the SDOF systems, was used to perform IDAs. The collapse was assumed to occur when the IDA curve becomes at, i.e. the maximum inter-story drift ratio of the structure reaches 0.15. Figure 4 illustrates the IDA curves of the 6-story structure. Figure 5 shows the comparison between the eciency of s, "Sa, and for predicting
the collapse capacity of the considered structure. It can be seen that using both parameters proposed as s
for collapse capacity prediction of the structure results in higher eciency (correlation coecients of 0.77 and 0.8) in comparison to using "Sa and , resulting in
correlation coecients of 0.51 and 0.67, respectively. It can therefore be concluded that both s parameters
Figure 4. IDA curves of the 6-story structure.
are more ecient than "Sa and for collapse capacity
prediction of short-period structures. 6. Target value for s
In order to assess seismic collapse of structures, in a specic seismic hazard level, using both s parameters
as proxies for GMRS, target values of "Sa(1:5T1), "PGV,
and "SI are required. When the target value of
"Sa, determined from seismic hazard disaggregation, is
known, the target value of "Sa(1:5T1) can be obtained
as: "
Sa(1:5T1)= "Sa "Sa;"Sa(1:5T1); (10)
where "
Sa(1:5T1) and "
Sa are the target values of
"Sa(1:5T1) and "Sa, respectively; "Sa;"Sa(1:5T1) is the
correlation between "Sa and "Sa(1:5T1), which can be
obtained using the relationship proposed by Baker and Jayaram [33] for calculating the correlation of spectral accelerations. To determine target "PGV, the
empirical equation proposed by Mousavi et al. [12] can be used. Moreover, similar to the study performed by Yakhchalian et al. [13], the target value of "SI can be
determined based on a relationship between "Sa and
"SI. To obtain such a relationship, a set containing
350 horizontal ground motion records related to shallow crustal earthquakes, used by Yakhchalian et al. [13] to determine the empirical relationship between "Sa and
"DSI, was considered.
Figure 6 illustrates the correlation between "Sa
and "SI in two periods of 0.4 and 0.8 sec, obtained
using the set containing 350 ground motion records. It can be seen that the estimated regression coecients and correlation coecient vary by period. Figure 7 shows the variations of correlation coecient between "Saand "SIby period. It can be seen that by increasing
the period, the correlation between the two epsilons increases. Assuming that there is a linear relationship between "SI and "Sa as presented in Eq. (11), the
coecients of this equation, a(T ) and b(T ), can be determined as the functions of period:
"SI= a(T )"Sa+ b(T ): (11)
In this study, second- and third-order regressions were used to determine a(T ) and b(T ) as functions of period, respectively. Figure 8 shows these regression analyses that led to the following equations for a(T ) and b(T ):
a(T ) = 0:494T2+ 1:029T + 0:308; (12)
b(T ) = 0:483T3+ 1:05T2 0:729T + 0:205: (13)
Therefore, considering target "Sa, the target values of
"Sa(1:5T1), "SI, "PGV, and thus s can be calculated.
Then, the target values of both s parameters can be
Figure 5. Comparison between the eciency of dierent parameters for collapse capacity prediction of the 6-story structure: (a) "Sa, (b) , (c) s= "Sa 0:449"Sa(1:5T1) 0:474"PGV, and (d) s= "Sa 0:385"Sa(1:5T1) 0:47"SI.
Figure 6. Correlation between "Sa and "SIat periods of (a) 0.4 sec and (b) 0.8 sec.
Figure 7. Correlation coecients between "Sa and "SI at
dierent periods.
7. GMRS and seismic collapse assessment In this section, dierent GMRS procedures (based on s, , and "Sa) are investigated for seismic collapse
assessment of the 6-story structure. For this purpose, two seismic hazard levels with target "Sa values of 0.8
and 1.7 were considered. As mentioned previously, target values of s and can be obtained based on
target "Sa. It should be mentioned that the normalized
form of , proposed by Mousavi et al. [12], was used. Therefore, the target value of was equal to the target value of "Sa. In addition, by using the procedure
described in Section 6, the target values for the rst formulation of s corresponding to target "Sa values
of 0.8 and 1.7 were obtained as equal to 0.102 and 0.33, respectively. The target values for the second formulation of s corresponding to the considered
target "Sa values were also obtained as equal to 0.236
and 0.527, respectively.
The target values of s, , and "Sa were used
Figure 8. Obtaining a(T ) and b(T ) as functions of period using (a) second- and (b) third-order regressions.
containing 20 ground motion records were selected for each of the seismic hazard levels. The ground motion records in each bin were selected to satisfy the criterion that the mean value of the corresponding proxy pa-rameter should be equal to the target value determined for the assumed seismic hazard level. Additionally, the following criteria were also considered in GMRS:
Magnitude 6:5;
The closest distance to rupture between 10 and 100 km;
Soil Vs30 (average shear wave velocity in top 30 m
of the site prole) between 180 and 750 m/s. After GMRS, IDAs were performed using the selected ground motion records in each bin to obtain the collapse capacity of the structure. The KS test [28] was applied to verify the lognormal distribution of the obtained collapse capacity values for each bin. The results of the KS tests conrmed the lognormality assumption for collapse capacity values. Considering this assumption, collapse fragility curves were obtained for each GMRS procedure. Figure 9 shows the collapse fragility curves obtained by using the proxy parameters for GMRS considering the two seismic hazard levels.
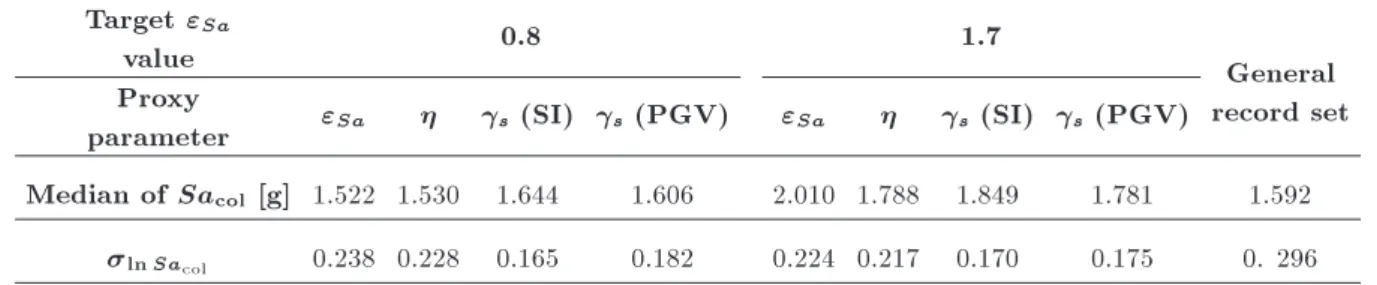
In addition, these fragility curves are compared with the fragility curve obtained using the general far-eld ground motion record set containing 67 records. It can be seen that using the proxies for GMRS leads to dierent fragility curves, implying that the obtained logarithmic means and standard deviations used for plotting the fragility curves are dierent. Table 2 presents the median of Sacol, which is the exponential
of the mean of ln Sacol values, and its corresponding
logarithmic standard deviation, ln Sacol, for each of the
GMRS procedures. It can be seen that using the proxy parameters for GMRS leads to reduction in ln Sacol
values, compared with the use of the general far-eld ground motion record set. Furthermore, using each of the proposed s parameters as a proxy for GMRS
re-sults in a lower ln Sacolthan those obtained from using
and "Sa for both of the target values. It should be
mentioned that the logarithmic standard deviation of collapse capacity values, ln Sacol, determines the slope
of the collapse fragility curve. A lower value of ln Sacol
represents a steeper collapse fragility curve. Thus, when using an ecient proxy parameter that results in a lower value of ln Sacol, the obtained collapse fragility
curve is steeper and more reliable than those obtained by using less ecient proxies parameters.
Figure 9. Collapse fragility curves obtained for the 6-story structure using the ground motion record bins selected based on the considered proxies: (a) Target "Sa value = 0.8 and (b) target "Sa value = 1.7.
Table 2. Results of the collapse assessment of the 6-story structure considering dierent proxies ("Sa, and s) for GMRS.
Target "Sa
value 0.8 1.7 General
record set Proxy
parameter "Sa s(SI) s(PGV) "Sa s(SI) s(PGV)
Median of Sacol [g] 1.522 1.530 1.644 1.606 2.010 1.788 1.849 1.781 1.592
ln Sacol 0.238 0.228 0.165 0.182 0.224 0.217 0.170 0.175 0. 296
In order to continue this study, epsilons of other intensity measures can be used to propose optimized combinations of "IM parameters as ecient proxies
for ground motion record selection in seismic collapse assessment of dierent types of structural systems. 8. Conclusions
In this study, two parameters were proposed as s to
be used as proxies for GMRS in seismic collapse assess-ment of short-period structures. Each of these proxies is a linear combination of dierent "IM parameters.
One of them is a combination of "Sa, "Sa(1:5T1), and
"SI; the other one is a combination of "Sa, "Sa(1:5T1),
and "PGV. The PSO algorithm was used in proposing
sparameters. It was shown that for the short-period
SDOF and MDOF structures having fundamental pe-riod less than 1 sec, each of these parameters has higher correlation with the structural collapse capacity, when compared with "Sa and . Because of their eciency
for structural collapse capacity prediction, s
param-eters were used as proxies for GMRS. To determine the target value for s parameter including "SI, an
empirical equation was proposed to obtain "SI for a
given "Sa. To investigate the eciency of sparameters
as proxies for GMRS in seismic collapse assessment of short-period structures, a 6-story moment-resisting frame with a fundamental period of 0.6 s was used. It was shown that using each of the proposed proxies for GMRS leads to a reduction in the structural collapse capacity dispersion, when compared with using "Saand
, and therefore a more reliable collapse fragility curve can be obtained.
References
1. Baker, J.W. and Cornell, C.A. \A vector-valued ground motion intensity measure consisting of spectral acceleration and epsilon", Earthq. Eng. and Struct. D., 34(10), pp. 1193-1217 (2005).
2. Haselton, C.B., Baker, J.W., Liel, A.B. and Deier-lein, G.G. \Accounting for ground motion spectral shape characteristics in structural collapse assessment through an adjustment for epsilon", J. of Struct. Eng., 137(3), pp. 332-344 (2011).
3. Baker, J.W. \Vector-valued ground motion intensity measures for probabilistic seismic demand analysis", Ph.D. dissertation, Department of Civil and Environ-mental Engineering, Stanford University, Stanford, CA (2005).
4. Kazantzi, A.K. and Vamvatsikos, D. \Intensity mea-sure selection for vulnerability studies of building classes", Earthq. Eng. and Struct. D., 44(15), pp. 2677-2694 (2015).
5. Baker, J.W. and Cornell, C.A. \Spectral shape, epsilon and record selection", Earthq. Eng. and Struct. D., 35(9), pp. 1077-1095 (2006).
6. Haselton, C.B. and Baker, J.W. \Ground motion intensity measures for collapse capacity prediction: Choice of optimal spectral period and eect of spectral shape", Proc. of 8th National Conf. on Earthq. Eng., Oakland, CA (2006).
7. Zareian, F. \Simplied performance based earthquake engineering", Ph.D. dissertation, Department of Civil and Environmental Engineering, Stanford University, Stanford, CA (2006).
8. Goulet, C.A., Haselton, C.B., Mitrani-Reiser, J., Beck, J.L., Deierlein, G.G., Porter, K.A. and Stewart, J.P. \Evaluation of the seismic performance of a code-conforming reinforced-concrete frame building-From seismic hazard to collapse safety and economic losses", Earthq. Eng. and Struct. D., 36(13), pp. 1973-1997 (2007).
9. Eads, L., Miranda, E. and Lignos, D. \Spectral shape metrics and structural collapse potential", Earthq. Eng. and Struct. D., 45(10), pp. 1643-1659 (2016).
10. McGuire, R.K. \Probabilistic seismic hazard analysis and design earthquakes: closing the loop", B. of the Seismol. Soc. of Am., 85(5), pp. 1275-1284 (1995).
11. Bazzurro, P. and Cornell, C.A. \On disaggregation of seismic hazard", B. of the Seismol. Soc. of Am., 89(2), pp. 501-520 (1999).
12. Mousavi, M., Ghafory-Ashtiany, M. and Azarbakht, A. \A new indicator of elastic spectral shape for the reliable selection of ground motion records", Earthq. Eng. and Struct. D., 40(12), pp. 1403-1416 (2011).
13. Yakhchalian, M., Ghodrati Amiri, G. and Nicknam, A. \A new proxy for ground motion selection in seismic collapse assessment of tall buildings", The Struct. Des. of Tall and Spec., 23(17), pp. 1275-1293 (2014).
14. Bradley, B.A. \Empirical equations for the prediction of displacement spectrum intensity and its correlation with other intensity measures", Soil Dyn. and Earthq. Eng., 31(8) , pp. 1182-1191 (2011).
15. Mara, N.A., Berman, J.W. and Eberhard, M.O. \Ductility-dependent intensity measure that accounts for ground-motion spectral shape and duration", Earthq. Eng. and Struct. D., 45(4), pp. 653-672 (2016).
16. Yakhchalian, M., Nicknam, A. and Ghodrati Amiri, G. \Proposing an optimal integral-based intensity measure for seismic collapse capacity assessment of structures under pulse-like near-fault ground motions", J. of Vibroeng., 16(3), pp. 1360-1375 (2014).
17. Yakhchalian, M., Nicknam, A. and Ghodrati Amiri, G. \Optimal vector-valued intensity measure for seismic collapse assessment of structures", Earthq. Eng. and Eng. Vib., 14(1), pp. 37-54 (2015).
18. Haj Naja, L. and Tehranizadeh, M. \New intensity measure parameter based on record's velocity charac-teristics", Sci. Iran., 22(5), pp. 1674-1691 (2015).
19. Bradley, B.A. \Site-specic and spatially distributed ground-motion prediction of acceleration spectrum intensity", B. of the Seismol. Soc. of Am., 100(2), pp. 792-801 (2010).
20. Bradley, B.A., Cubrinovski, M., MacRae, G.A. and Dhakal, R.P. \Ground-motion prediction equation for SI based on spectral acceleration equations", B. of the Seismol. Soc. of Am., 99(1), pp. 277-285 (2009).
21. Campbell, K.W. and Bozorgnia, Y. \Campbell-Bozorgnia NGA ground motion relations for the geometric mean horizontal component of peak and spectral ground motion parameters", PEER Report 2007/02, Pacic Earthquake Engineering Research Center, University of California, Berkeley, CA (2007).
22. OpenSees, Open System for Earthquake Engineer-ing Simulation, Pacic Earthquake EngineerEngineer-ing Re-search Center, University of California, Berkeley, CA http://opensees.berkeley.edu (2012).
23. Ibarra, L.F., Medina, R.A. and Krawinkler, H. \Hys-teretic models that incorporate strength and stiness deterioration", Earthq. Eng. and Struct. D., 34(12), pp. 1489-1511 (2005).
24. Vamvatsikos, D. and Cornell, C.A. \Incremental dy-namic analysis", Earthq. Eng. and Struct. D., 31(3), pp. 491-514 (2002).
25. Pacic Earthquake Engineering Research Center (PEER), PEER Next Generation Attenuation (NGA) database. http://peer.berkeley.edu/nga. (2008).
26. Ibarra, L. and Krawinkler, H. \Variance of collapse capacity of SDOF systems under earthquake excita-tions", Earthq. Eng. and Struct. D., 40(12), pp. 1299-1314 (2011).
27. Poli, R., Kennedy, J. and Blackwell, T. \Particle swarm optimization", Swarm Intell., 1(1), pp. 33-57 (2007).
28. Hogg, R.V. and Ledolter, J., Engineering Statistics, MacMillan, New York (1987).
29. Ang, A.H.S. and Tang, W.H., Probability Concepts in Engineering: Emphasis on Applications in Civil and Environmental Engineering, Wiley: New York (2007).
30. Goldberg, D.E., Genetic Algorithms in Search, Opti-mization, and Machine Learning, 412, Reading Menlo Park: Addison-Wesley (1989).
31. Medina, R.A. and Krawinkler, H. \Seismic demands for nondeteriorating frame structures and their depen-dence on ground motions", PEER Report 2003/15, Pacic Earthquake Engineering Research Center, Uni-versity of California, Berkeley, CA (2003).
32. Ibarra, L.F. and Krawinkler, H. \Global collapse of frame structures under seismic excitations", Report No. 152, The John A. Blume Earthquake Engineering Center, Department of Civil and Environmental Engi-neering, Stanford University, Stanford, CA (2005).
33. Baker, J.W. and Jayaram, N. \Correlation of spectral acceleration values from NGA ground motion models", Earthq. Spectra, 24(1), pp. 299-317 (2008).
Biographies
Masood Yakhchalian received his MSc degree in 2010 from Amirkabir University of Technology (AUT) and PhD degree in Structural Engineering in 2015 from Iran University of Science and Technology (IUST). His main research areas are performance-based earthquake engineering, seismic hazard analysis, and using opti-mization algorithms in structural engineering.
Gholamreza Ghodrati Amiri received his BSc de-gree in 1989, MSc dede-gree in 1992 from Sharif University of Technology in Iran, and PhD degree in 1997 from McGill University in Canada. Currently, he is a Professor at Iran University of Science and Technology (IUST). His research studies are about seismic hazard analysis, performance-based earthquake engineering, and structural health monitoring.
Mahdi Eghbali is a PhD candidate of Structural Engineering in Iran University of Science and Tech-nology (IUST). His current research interests include earthquake engineering, modern nonlinear dynamic analyses, development of nonlinear static analysis methods, seismic probabilistic risk assessment, and modern lateral load resisting systems.