Endurance Time Method for Seismic
Analysis and Design of Structures
H.E. Estekanchi
, A. Vafai 1
and M. Sadeghazar 2
In this paper, a new method for performance based earthquake analysis and design has been introduced. In this method, the structure is subjected to accelerograms that impose increasing dynamic demand on the structure with time. Specied damage indexes are monitored up to the collapse level or other performance limit that denes the endurance limit point for the structure. Also, a method for generating standard intensifying accelerograms has been described. Three accelerograms have been generated using this method. Furthermore, the concept of Endurance Time has been described by applying these accelerograms to single and multi degree of freedom linear systems. The application of this method for analysis of complex nonlinear systems has been explained. Endurance Time method provides a uniform approach to seismic analysis and design of complex structures that can be applied in numerical and experimental investigations.
INTRODUCTION
The basic objective of seismic design is to provide the structure with an appropriate safety margin against failure when subjected to strong earthquakes [1]. The common philosophy of most well-known seismic design codes is to achieve the dual goal of keeping the non-structural damage to a minimum in the case of service level earthquakes and, also, to prevent structural fail-ure in the case of collapse level earthquakes [2,3].
Early observations of structural failure during earthquakes revealed that most structure failures could be attributed to the weakness of structures in sustain-ing the imposed lateral loads and displacements. This observation formed the basis of well-known earthquake design criteria, based on lateral load, also known as the static seismic design method. In the static lateral load method, the structure is designed to resist a minimum lateral load specied by the code. In this way, minimum lateral strength and stiness is provided and lateral displacements are limited [2,4].
Extensive research work in the eld of earthquake
*. Corresponding Author, Department of Civil Engineering, Sharif University of Technology, Tehran, I.R. Iran.
1. Department of Civil Engineering, Sharif University of Technology, Tehran, I.R. Iran.
2. Department of Civil Engineering, Tehran University, Tehran, I.R. Iran.
engineering has revealed many deciencies and short-comings in the traditional method of static seismic analysis [5]. According to the static method of analysis, structures with higher lateral strength and stiness are superior to their less sti and less strong counterparts. However, experimental and analytical investigation shows that this is not always the case [6-8]. In fact, there are cases in which reducing lateral stiness results in better seismic performance. The concept of seismic base isolation is one example [9,10].
These apparent shortcomings in traditional seis-mic design, along with remarkable developments in the eld of information technology and the availability of vastly improved analytical tools, have led researchers and engineers to develop more rational and consistent methods for earthquake engineering [11-14]. In this re-spect, Performance Based Seismic Engineering (PBSE) has gained increased interest among practitioners in earthquake engineering eld [3,15,16]. Development of these new methods and criteria should be mainly contributed to the amazing improvement in computa-tional tools that have made possible the solution of sophisticated nonlinear models [17]. The use of static push over analysis is becoming standard practice in structural engineering design oces and the applica-tion of nonlinear time history analysis is also gaining popularity. Thanks to these recent developments, it has become possible for the structural analyst to incorporate the most signicant nonlinear material and
ment of new methods in structural engineering. In this paper, a new method for seismic analysis and evaluation of structures is introduced. The concept of the Endurance Time (ET) criteria, which is quite intuitive, is rst explained and prospective methods to implement it are discussed. The criterion is then evaluated by applying the concept to linear single and multi degree of freedom (SDOF and MDOF) systems.
ENDURANCE TIME CONCEPT
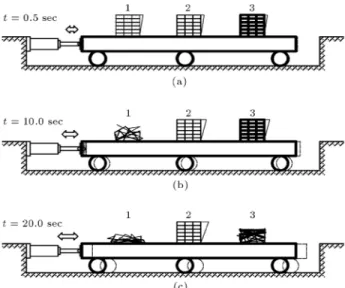
The concept of Endurance Time method (ET) can be best explained by considering a hypothetical ex-periment. Assume that three model buildings with unknown seismic resistance characteristics are to be in-vestigated with reference to their performance against collapse in high intensity earthquakes. Now consider that these models are put on the shaking table and xed to it. The experiment starts by subjecting the buildings to random vibration with gradually increas-ing intensity. In the beginnincreas-ing (e.g. att = 5 sec) the amplitude of shaking is quite low so all three buildings vibrate but remain stable, as shown in Figure 1a. As the amplitude of vibration is increased (say, att = 10 sec), a point is reached when one of the buildings collapses. It is assumed that this is model number one, as in Figure 1b. As time passes and the vibration amplitude is further increased (say, at t = 20 sec), the second structure fails. Assume this to be building number 3, as in Figure 1c. Further, consider that building number two happens to be the last building to fail in this hypothetical experiment.
Figure1. Hypothetical shaking table experiment.
time during which each building remained stable, with-out any reference to the building strength or stiness or other dynamic characteristics. If the goal were to evaluate the building's resistance to collapse, then, such experiments would seem to show a direct and relevant measure. This is the concept of the Endurance Time criterion in evaluating the performance of buildings subjected to earthquakes.
In the ET method, buildings are rated according to the time that they can endure a standard calibrated intensifying accelerogram. Higher endurance time is to be interpreted as a better performance. A minimum performance index can be set to be used as the design criterion. The idea of the Endurance Time method is somewhat similar to the method used by cardiologists to evaluate the condition of the heart, known as a stress test. In stress tests, the patient is asked to walk on a tread-mill with a variable slope and speed. The test starts with a low slope and low speed condition. During the test, the slope and speed are increased gradually, while the physical and biological condition of the patient, such as blood pressure, heart beat rate, etc. are monitored. The test is commenced until signs of distress or abnormal conditions are observed. The heart condition is then judged on the basis of the speed and slope level that could be tolerated.
In the Endurance Time method, nearly the same concept is applied. The idea behind the ET method is, roughly, to put the structure on a ramp-like ac-celerogram and see how far it can go. The structure is subjected to a standard accelerogram with intensifying dynamic demand. The specied performance indexes are monitored until they reach a predened maximum value. The performance of the structure is judged on the basis of the time when the damage limit index is exceeded. This concept has been explained in Figure 2. Consider the damage index curve (e.g. maximum drift, plastic energy, etc.) for a typical structure subjected to an intensifying accelerogram, as shown in this gure.
If the limit value for the specied damage index is specied to be 1.00, then, it can be concluded from Figure 2 that this structure has endured the accelerogram up to about the 12th second. Moreover, consider that the accelerogram has been calibrated and the design criterion is that endurance time should be at least 10 seconds. As can be seen from this gure, the damage value is about 0.82 at t = 10:0, seconds i.e. below the limit value; thus, one can conclude that the structure has met the design criteria. The analysis should not necessarily be limited to a single damage criterion. Various dierent damage indexes and
struc-Figure2. Damage curve against time for a typical
structure subjected to intensifying accelerogram.
tural criteria can be monitored simultaneously in order to reach more conclusive results.
In order to achieve quantitative results, one needs to propose a method for implementing the concept. Direct physical testing of actual structures as described above is, of course, not a practical proposition for gen-eral application considering time and cost [6]. Analyti-cal software that is capable of modeling and predicting structural behavior up to the complete collapse point are available, but are still considered to be at research level. In this paper, some practical implementations of the Endurance Time method are introduced by making some simplifying assumptions and by making use of already available analytical tools. Modied and improved implementations should be developed based on ongoing research. However, complete numerical implementation of the method, which should, ideally, follow the nonlinear response up to collapse level, should be left to the next generation of structural engineering software and computer hardware capable of performing such analysis.
Basic implementation of the concept is based on three fundamental bases, i.e. dynamic input, structural model and endurance criteria. These will be discussed next.
DYNAMIC EXCITATION
The choice of an appropriate dynamic input is fun-damental to the successful implementation of the ET concept. The ideal input function is the one that results in higher consistency and best correlation be-tween the endurance time analysis results and the actual or well-known performance characteristics of the structures subjected to earthquakes. Determination of the most appropriate and optimal dynamic input function should, in itself, be the subject of extensive research work. However, in this research, a function based on engineering judgment and some elementary calculations will be proposed so that the concept and application of the ET method can be explained.
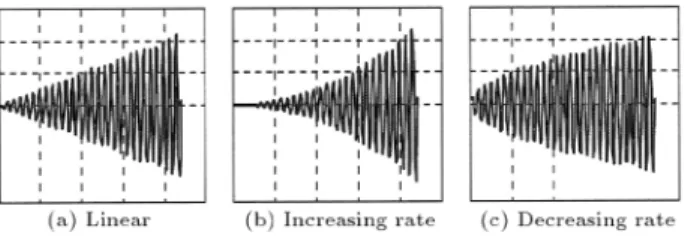
Figure 3. Input prole functions.
An important issue in determining dynamic input is the prole of amplitude increase. As shown in Fig-ure 3, the amplitude increase prole can take various forms. After considering several possible alternatives, the authors came to the conclusion that a linear prole, as shown in Figure 3a, is more suitable for the purpose of initial investigation. In this prole, maximum accel-eration is directly proportional to time. Determination of an optimum prole that results in better correlation and consistent results is under investigation.
Another important consideration in ET analysis is the specication of the dynamic input function itself. The most basic form of dynamic input is a simple harmonic. But this kind of input has obvi-ous disadvantages because of poor frequency content consisting of only one harmonic. The structures that have natural vibration periods near the input frequency will experience high dynamic magnication and, thus, will be too much penalized. Considering this issue, a random vibration input with a frequency content resembling that of a white noise has been used as the starting point for generating of intensifying ac-celerograms. As will be explained later, the frequency content is later modied to better correspond to what is expected in a real earthquake. The accelerograms generated by this procedure seem to be good enough for investigation of the ET concept and will be applied in this study. Further research is required and is under way, in order to propose optimized dynamic input so that the results of Endurance Time analysis are best correlated with the known actual performance of structures in earthquakes and shaking table experi-ments.
Generation of Intensifying Accelerograms
The rst generation of accelerograms to be used as dynamic input in the ET method is produced using random numbers with a Gaussian distribution of zero mean and a variance of unity [18]. A stationary random accelerogram is generated using t = 0:01 and n = 211= 2048 with PGA = 1 shown in Figure 4. Duration of the accelerogram is equal totn= 20:48 sec.
The frequency content of the random accelero-gram that is statistically similar to a white noise is then modied, in order to resemble actual earthquake accelerograms. For this purpose, lter functions given
Figure4. A typical random accelerogram with PGA = 1. by the following equations are applied to the random accelerograms. Application of these lter functions is explained by Clough and Penzien [18].
H1(i$) =
1 + 2i 1
$ !1 (1 $
2 !
2 1
) + 2i 1
$ !1
; (1)
H2(i$) =
($ !
2) 2 (1 $
2 !
2 2
) + 2i 2
$ !2
; (2)
where ! 1 = 2
=0:5; 1 = 0
:2;! 2 = 2
=0:1; 2 = 0
:2 are used. It should also be noted that the frequencies higher than 25 Hz are ltered out. A sample frequency content resulted from the accelerogram shown in Fig-ure 4 is depicted in FigFig-ure 5.
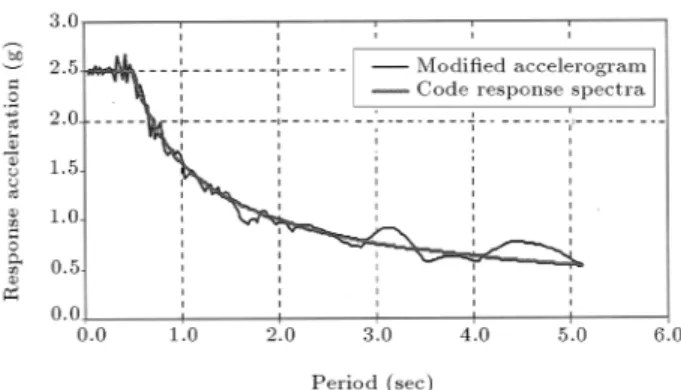
The frequency content is then further modied so as to make the resulting response spectra compatible with typical seismic code response accelerograms. Any given design response spectrum can be used for this purpose. In this paper, the response spectra of the Iranian National Building Code (Standard 2800) [4] has been used as a sample. The resulting frequency content of a response spectra compatible accelerogram, after several cycles of stepwise modication, is shown in Figure 6.
Acceleration response, which is compared with the code response spectrum curve, is depicted in Figure 7. The convergence is assumed to be good enough for the purpose of explanation of the ET
Figure5. Filtered frequency content.
acceleration values are multiplied by a prole function, which, in this study, is a linear one starting from zero and reaching a value of 1.00 at t = 10 sec. Three accelerograms have been generated using the procedure explained above. These accelerograms will be referred to hereafter as acc1, acc2 and acc3. Accelerogram acc1 that is obtained from the original accelerogram in Figure 4 is shown in Figure 8.
Figure6. Modied frequency content.
Figure7. Response of modied accelerogram compared
to codied value.
ANALYSIS METHOD
Collapse analysis of the structures is still considered a challenging task for structural engineers involved in the numerical analysis of structures. There are a few programs that are capable of conducting such analysis with reasonable assumptions. However, the experimental evidence to verify the results of such analyses is still quite limited. The minimum modeling requirement for collapse analysis is nonlinear material behavior, including material degradation due to cyclic behavior, large strain and fracture. Analysis should include the eect of large deformations, buckling and collision. Furthermore, for the purpose of illustrating the ET method, the simplest method of dynamic analysis is considered in this paper, i.e. linear systems. The Newmark linear method has been applied for the analysis [19]. It should be evident that, as far as the concept of the ET method is considered, the procedure remains almost the same, even for complex MDOF models, including nonlinear features.
ENDURANCE CRITERIA
The numerical denition of structural collapse and failure is not a straightforward procedure. An intuitive failure criterion can be dened as the displacement of the center of mass of the structure to a lower level from its initial position. However, analytical implementation of such criteria is still considered to be very demanding in terms of computational eort and modeling complex-ities. The state of the art in this regard is to dene the structural damage in terms of damage indexes. Various damage indexes have been dened and proposed by researchers in recent years. Seismic codes that are based on performance based design usually propose a certain damage index and set maximum acceptable values for it. In this way, the structure is assumed to have collapsed when its damage index exceeds specied code limits. The same simplied method shall be used for the purpose of this study, as described in the next sections. Endurance Time is dened as the time it takes for the specied damage criteria to reach its limit value as the structure is subjected to intensifying accelerograms. For example, in the static method of earthquake resistant design, structures are required to be designed according to a specied base shear, which is proportional to certain peak lateral ground acceleration. Also, limits to maximum lateral displace-ments and drift are usually specied. These can be considered as the simplest forms of damage indexes. In the discussion that follows, basic parameters such as \max response acceleration", \max displacement response" and \max inter-story drift" have been used for the matter of explanation of the idea. It will be up to the structural designer/analyst to choose an
applicable damage index that is more appropriate for the structure under investigation. It should be evident from the discussion that many dierent damage indexes can be applied in the procedure. Practical implications of applying dierent damage indexes for ET analysis are under investigation.
APPLICATION TO LINEAR SDOF
SYSTEMS
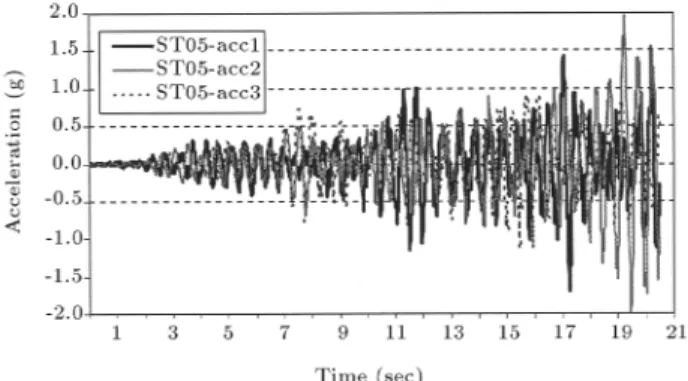
For linear SDOF systems, the most signicant pa-rameter that describes the dynamic characteristics of the structure is its natural frequency of vibration. Consider that three dierent linear structures, with natural periods of vibration equal to 0.1, 0.5 and 1.0 seconds, are to be studied. These structures will be, hereafter, referred to as ST01, ST05 and ST10. ST01 roughly pertains to a sti single-story masonry building, while ST05 and ST10 have a period typical of three and nine story steel frame buildings, respectively. Damping ratio will be assumed to be 0.05 of the critical value, as commonly assumed in dynamic analysis. The acceleration response for ST05, subjected to the three generated accelerograms, is shown in Figure 9. As expected, peak acceleration increases with time as the input acceleration is intensied.
In Figure 10, maximum acceleration as a function of time has been plotted, along with average value and a linear tting curve. As can be seen in this gure,
Figure 9. Acceleration time-history for ST05.
specify the time at which the structure has experienced a maximum acceleration of 1 g. From Figure 10, it can be seen that for acc1, this occurs att equal to about 11.5 seconds, while, for acc2, this occurs at t = 16 seconds.
This could be expected, considering the well-known characteristics of time-history analyses. An averaging method can be used to achieve better ap-proximation. In this example, using the linear tting curve, the time ata= 1 g can be seen to be about 14 seconds.
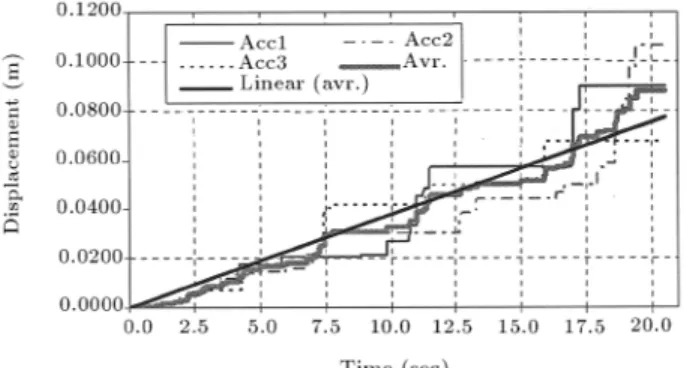
The displacement response of ST05 subjected to dierent accelerograms has been depicted in Figure 11. As can be seen in this gure, the displacement response is also an increasing function of time, as expected. Due attention should be paid to the pulsating characteristic of the displacement response. These pulsations can result in the maximum response, to remain constant during a relatively long period of time, making it dicult to interpret the result of analysis regarding the time corresponding to a certain response level. This problem can be avoided by using several accelerograms, along with an appropriate averaging method. Even though, in this paper, the number of accelerograms to be averaged has been set to three as a practical minimum, it should be clear that the desired accuracy and convergence can be achieved by considering a larger number of accelerograms.
Maximum and average accelerations are shown in Figure 12. Maximum displacement is considered to be a simple and eective damage criterion. In multistory buildings, maximum displacement is usu-ally proportional to maximum drift, which is another signicant response characteristic that can be related to building damage. Consider that the maximum tolerable displacement for this building has been set to 4cm. Based on Figure 12, one can conclude that the
Figure11. Displacement time-history for ST05.
experienced by all three structures is nearly the same, with that of ST05 being higher for almost the entire time range and that of ST10 being lower in the time interval from 7.5 to 12.5 seconds. These could be expected considering the shape of the codied response spectrum and the frequency content being amplied near T
0 = 0
:5 sec, according to the assumed soil conditions.
Displacement responses have been depicted in Figure 14. As can be seen in this gure, there is a
Figure12. Maximum displacement and average for ST05.
Figure13. Maximum average accelerations.
marked distinction between the displacement responses of sample structures. Signicant insight on the struc-tural performance of these structures can be gained through studying the curves of Figure 14. For example, consider that the maximum tolerable displacement for all these structures was to be limited to 4 cm. It can be concluded from Figure 14 that the endurance time for ST10 is about 6 seconds, for ST05 about 11 seconds and for ST01 more that 20 seconds. Now, by specifying the required endurance time of 10 seconds, it can be concluded that ST01 and ST05 are acceptable, i.e. can endure the specied dynamic demand, while ST10 is rejected.
As another example, consider that ST05 and ST10 are three and nine story buildings with heights of 10 m and 30 m, respectively, and the failure criteria is set to be a maximum drift of 0.005. If one, roughly, assumes the vibration mode to be linear, maximum displacements will be 0:00510 = 0:05 m and 0:005 30 = 0:15 m, respectively. Now, by referring to Figure 14, it can be seen that ST05 reaches the value limit at about t = 15 seconds, while ST10 reaches its value limit at t = 15:5 seconds. Thus, the endurance time for both structures is nearly the same and, if one sets the required endurance time to 10 seconds, then both structures will be considered acceptable.
In the above discussion, the linear analysis of a single degree of freedom is considered for the purpose of describing the basic idea behind the Endurance Time method. It should be clear from this discussion that the analysis can be readily extended to nonlinear and multi degree of freedom systems. The essence of the ET method lies in the denition of standard intensifying accelerograms and appropriate damage criteria. It is interesting to note that the concept of ET can also be readily applied in experimental dynamic investigation of structures. In this case, the most realistic perfor-mance criteria, i.e. actual failure of the structure, can be considered the endurance limit as measured against time. Another advantage of the ET method, as compared to other dynamic analysis methods, is in its applicability to experimental shaking table studies. In these cases, the cost and required resources usually eliminate the possibility of conducting the experiment several times with dierent levels of excitation. Using the concept of endurance time, a single run experiment can be used to obtain the desired results.
APPLICATION TO MDOF SYSTEMS
In this section, the application of the ET method in the dynamic analysis of MDOF systems is explained by considering a three story steel moment frame example. A three story steel frame, named \f3" in Figure 15, has been designed in accordance with conventional loading and analysis procedures, appropriate for ordinary
mo-Figure 15. Three story steel moment frames.
ment frames in high seismic zones. For the matter of comparison, another frame with similar properties, but utilizing steel sections with lower stiness and strength, has also been designed. This weak frame is named \f3w" in Figure 15. These frames are to be analyzed using the ET concept and the results will be studied. For multi story frames, inter-story drift has proved to be a very signicant and convenient measure of building damage and performance criteria. This criterion shall be used for the purpose of explanation of the method. It should be clear that other criteria, based on strain energy, nonlinear hysteresis behavior etc., can also be applied with no further complications. The only limitation in the application of the ET method will lie on the computational capability of the analysis program used.
Frame f3 has been subjected to accelerogram acc1 and the time-history of story drifts has been depicted in Figure 16. It can be seen from this gure that the story drifts are nearly the same for most of the time-history and, also, reach peak values at almost the same times. This is due to the fact that in MDOF frame structures, mode number 1 is, usually, the predominating deection mode. Higher vibration modes have had a much less pronounced eect at peak values for inter-story drifts.
Frame f3 has been subjected to accelerograms
Figure 16. Story drifts time-history for frame f3
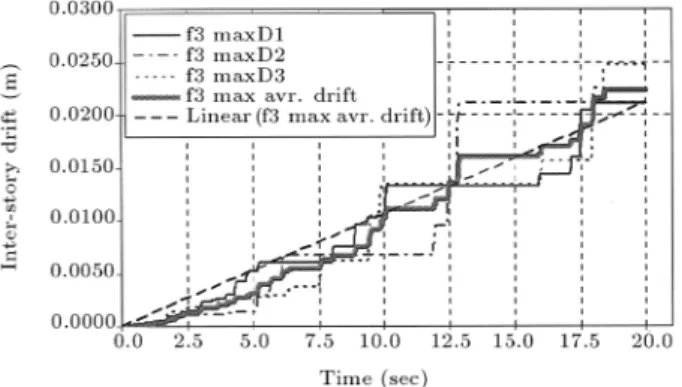
the randomness of input and resulting response, the peak value can remain constant for a prolonged period of time. For example, maximum drift has remained constant fromt= 10 tot= 16 seconds for f3 subjected to acc1, as shown in Figures 16 and 17. Considering the irregular uctuation in the drift values for the frame subjected to each accelerogram, the average value should be used, in order to avoid inaccuracy resulted from the random nature of the response.
A curve tting method can also be used in order to better dene the endurance time value. In Figure 17, a linear trend line has been added for this purpose. In linear systems subjected to linearly intensifying accelerograms, it is known that the response is roughly linear. This justies the use of linear trend line as the tting curve. However, it should be clear that when applying the ET method to non-linear problems, a more appropriate tting method, such as spline or polynomial curves, should be used.
Now, considering a limiting value of 0.005 for inter-story drift, as a typically recommended maximum value, the limiting drift for frame f3 with a story height of 3.0 m will be 0:0053:0 = 0:015 m. Thus, one can conclude from Figure 17 that frame f3 has endured an acc1-3 set of accelerograms up to timet= 13:5 seconds. If one had standardized these accelerograms for the specied site and had specied a minimum endurance time of, say, 10 seconds, one would then conclude that frame f3 passes the seismic design criteria. Generating a standard set of intensifying accelerograms to be used as the design criteria in the ET method is under investigation and is the subject of another study.
The result of the same analysis as applied to frame f3w, i.e. the weak version of f3, is summarized in Figure 18. The general trend for f3w is the same as f3. It should be noted that the resulting drift
Figure17. Maximum story drifts for frame f3 subjected
to acc1-3 accelerograms.
Figure18. Maximum story drifts for frame f3w
subjected to acc1-3 accelerograms.
Figure19. Maximum average story drifts for frames f3
and f3w.
values are, generally, higher for f3w. This could be expected, considering the lower stiness of frame f3w. Considering the limiting value of 0.005 for inter-story drifts, as above, it can be concluded that the endurance time for f3w is about 10.5 second.
Analysis results for frames f3 and f3w are com-pared in Figure 19. The signicant point in this gure is the endurance time for f3w being clearly lower than that of f3. On the other hand, the weakness of f3w as compared to f3 is observed in its response to the intensifying accelerograms. Again, if one considers that the accelerograms have been somehow standardized and a minimum endurance time of 10.0 seconds has been specied for the building site, it can be concluded that f3w passes the seismic design criteria. If, however, the minimum endurance time was specied to be 12.0 seconds, f3 would pass the design criteria while f3w would fail.
In case of the simple example considered above, one could already predict the analysis result by consid-ering the fact that f3w is less sti than f3. However, in cases of more complex models, particularly models involving several sources of nonlinearity, it is not possi-ble to predict the endurance time and the advantage of one design over the other. For example, consider that the eectiveness of various energy absorbing devices in reducing the maximum drift of a structure is to be stud-ied. These types of analysis are usually encountered
when considering seismic retrot studies. It should be clear from the above discussion that by applying the ET method, a conclusive analysis result can be readily achieved.
SUMMARY AND CONCLUSIONS
In this paper, a new approach to performance based earthquake analysis and design has been introduced. In this method, the structure is subjected to stan-dard accelerograms that impose increasing dynamic demands on structures with time. Specied damage indexes are monitored up to the collapse level or other performance limits that dene the endurance limit point for the structure. Endurance time is dened as the length of the time interval from start to failure point (or limit point), i.e. the time at which the damage index reaches its maximum tolerable value. Longer endurance time implies better or improved performance. Standard accelerograms are calibrated and a minimum endurance time is specied to be used as the design criteria. In this way, the structure is considered acceptable or unacceptable by its endurance time being higher or lower than the benchmark value. The Endurance Time method provides a unied and objective approach to seismic analysis and de-sign of structures that can be applied in numerical and experimental investigations, regardless of model complexity. Also, the method is readily applicable to complex nonlinear systems. The denition and calibration of standard intensifying accelerograms is a key issue in this method. Furthermore, a simple approach to generating required accelerograms has been discussed. Three such accelerograms were applied in the simple case of linear elastic single and multi degree of freedom systems. Methods for generating improved accelerograms to achieve better convergence are under investigation. Also, practical implications in cases of nonlinear MDOF systems are being studied.
ACKNOWLEDGMENTS
The authors would like to acknowledge the support of the Research Council and the Structures and Earth-quake Engineering Center of Excellence of the Sharif University of Technology for this Research. The authors also wish to express their appreciation for the constructive comments made by the reviewers.
REFERENCES
1. Estekanchi, H.E. \Basics of earthquake engineering (in Farsi)", Omran Magazine of Sharif University of Technology, Tehran, Iran, (15), pp 26-29 (1994). 2. Moghaddam, H.,Earthquake Engineering: Theory and
Application, Farahang Publications, Iran (2002).
3. Newmark, N.M., Fundamentals of Earthquake Engi-neering, Prentice-Hall, Englewood Clis (1971). 4. Estekanchi, H.E., Vafai, A. and Shahbodaghkhan, P.
\Comparative evaluation of braced steel frames de-signed according to the rst and second edition of the Iranian code for seismic resistant design of buildings (in Farsi)",Building Engineering and Housing Science, Building and Housing Research Center, Iran,1(1), pp
11-16 (2003).
5. Chandler, A.M. and Lam, N.T.K. \Performance based design in earthquake engineering: A multidisciplinary review", Engineering Structures, 23, pp 1525-1543
(2001)
6. Shortreed, J.S., Seible, F. and Benzoni, G. \Simula-tion issues with a real-time, full-scale seismic testing system", Special Issue: Controversial Issues in Earth-quake Engineering, Proceedings of First ROSE Sem-inar, Journal of Earthquake Engineering, 6, Special
Issue 1, pp 185-201 (2002)
7. Bertero, R.D. and Bertero, V.V. \Performance-based seismic engineering: The need for a reliable conceptual comprehensive approach", Earthquake Engineering&
Structural Dynamics,31(3), pp 627-652 (Mar. 2002).
8. Moehle, J.P. and Elwood, K.J. \Collapse performance prediction for RC frame structures",Proceedings of the 2003 Pacic Conference on Earthquake Engineering
(Electronic Resource), New Zealand Society for Earth-quake Engineering, Wellington, 8 pages, Paper No. 154 (2003).
9. Moghaddam, H.A. and Estekanchi, H.E. \A study of o-center bracing systems",Journal of Constructional Steel Research,51(2), pp 177-196 (1999).
10. Estekanchi, H.E. \A review of history, performance and application of seismic isolators (in Farsi)",Omran Magazine of Sharif University of Technology, Tehran, Iran, (10), pp 42-44 (1993).
11. Chopra, A.K. and Geoel, R.K. \Capacity-demand-diagram methods for estimating seismic deformation of inelastic structures: SDF systems", Report No. PEER-1999/02 Pacic Earthquake Engineering Re-search Center, College of Engineering, University of California, Berkeley, USA (1999).
12. Chopra, A.K. and Goel, R.K. \A modal pushover analysis procedure to estimate seismic demands for buildings: Summary and Evaluation", Fifth National Conference on Earthquake Engineering, 26-30 May 2003, Istanbul, Turkey (May 2003).
13. Medhekar, M.S. and Kennedy, D.J.L. \Displacement-based seismic design of buildings: Application", Engi-neering Structures,22(3), pp 210-221 (Mar. 2000).
14. Gupta, B. and Kunnath, S.K. \Adaptive spectra-based pushover procedure for seismic evaluation of structures", Earthquake Spectra, 16(2), pp 367-391
(May 2000).
15. Kelly, T.E. and Chambers, J.D. \Analysis procedures for performance based design",12th World Conference on Earthquake Engineering, New Zealand Society for
ence on Earthquake Engineering, New Zealand Society for Earthquake Engineering, 8 pages, Paper No. 108 (2003).
17. Vafai, A., Estekanchi, H.E. and Ghadimi, G. \The role of information technology in construction industry
applications to earthquake engineering",Prentice Hall International Series in Civil Engineering and Engi-neering Mechanics, Prentice Hall, Englewood Clis, New Jersey, USA (1995).