ARTICLE
Health Care 2030 outlines the vision, values and principles of the provincial Western Cape Department of Health (DoH) for restructuring the healthcare system.[1] The most important principles are patient-centred care, improvements in the quality of care, an increase in life expectancy and a reduction in maternal and child mortality. The aim is to apply this approach within populations and through health- and community-based services within subdistricts and districts, or geographic service areas (GSAs). The approach promotes integration and co-ordination of health services and the ownership of the population’s healthcare by their health institutions. Metro West represents one of five GSAs in the province. Oversight of the GSA is by both district and hospital managers supported by service co-ordinating working groups.[2]
A child health service co-ordinating working group (SCWG) was constituted in Metro West 6 years ago. The terms of reference of the group include identifying the current neonatal and child health status, supporting the implementation of interventions that
are consistent with Health Care 2030 and monitoring the impact of these interventions within the GSA. A previous situational analysis[2] and a review of provincial and national reports[3] provided the basis for developing a framework of key health indicators that could be used to monitor neonatal and child mortality, morbidity and health service-related outcomes in the GSA. The development of monitoring tools that track the health outcomes of populations over time provides a gauge of the performance of the health system, and can guide resource allocation, improve accountability and inform future health interventions. A dashboard of core indicators to monitor progress forms a key part of a health information system, which the World Health Organization identifies as one of the six building blocks of the health system.[4,5] The tracking and updating of health indicators in maternal and child health is a task that has been assigned to the district paediatricians in the province, and provides a means for them to identify areas within the health system that need to be improved on.
Background. Monitoring the health status of populations of children is one of the building blocks of the health system. The provision of an
indicator dashboard with disaggregated data that are collected over time can be used to gauge the performance of the health system, guide the allocation of resources and prioritise health interventions within districts.
Objectives. To determine neonatal and child mortality, morbidity and health service outcomes over a 6-year period in the Metro West
geographic service area (GSA) of the Cape Town metropole.
Methods. A dashboard with key indicators was developed using existing data.
Results. From 2010 to 2015, there was a decrease in the perinatal mortality rate from 31.7 to 24.8 per 1 000 deliveries, and the early
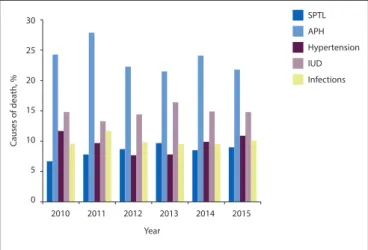
neonatal and neonatal mortality rates from 7.8 and 8.6 to 7.0 and 8.2 per 1 000 live births, respectively. The main obstetric causes of early neonatal deaths were antepartum haemorrhage (22 - 24%) and unexplained intrauterine death (13 - 16%); the main neonatal causes were immaturity (17 - 34%), congenital abnormalities (23 - 29%) and hypoxia (23 - 26%). Under-five mortality decreased in 2013 from 25 to 22 per 1 000 live births, with the main causes being neonatal conditions (32%), pneumonia (25%), congenital abnormalities (9%), injuries (8%) and diarrhoea (8%). Fifty percent of child deaths were out of hospital, with pneumonia and diarrhoea accounting for more than half of these. There was an improvement in health service coverage rates in 2015: immunisation <1 year old (99%); measles second dose (85%), pneumococcal third dose (100%) and rotavirus second dose (100%); maternal antiretroviral coverage (90%); HIV testing in mothers (93%); HIV DNA polymerase chain reaction testing in babies (97%); and a decrease in HIV transmission (2%). Exclusive breastfeeding coverage rates at 14 weeks, and vitamin A supplementation at 12 - 59 months, were only 30% and 44%, respectively, across the GSA.
Conclusion. There was a decrease in perinatal, early neonatal, infant and under-five mortality in Metro West over the 6 years. Further
reductions in under-five mortality will require focusing on interventions to reduce neonatal and out-of-hospital deaths across the service delivery platform. Home visits to at-risk mothers and infants by community health workers could prevent out-of-hospital deaths and improve exclusive breastfeeding and vitamin A coverage. This will require increasing the number of community health workers and broadening their scope of practice.
S Afr J Child Health 2019;13(1):36-43. DOI:10.7196/SAJCH.2019.v13i1.1581
Tracking progress on the health status and service
delivery outcomes for neonates and children in the
Metro West geographic service area of the Cape
Metropole, 2010 - 2015
M K Hendricks,
1,2MB ChB, MMed (Paed), MTropPaed, DCH; A Hawkridge,
1MB ChB, FCPHM; L Jacobs,
1MB ChB;
J Evans,
1PhD; H Mahomed,
1,3MB ChB, MMed (Public Health), PhD; L Linley,
1,2MB ChB, FCPaed;
A Westwood,
1,2MB ChB, FCPaed, MMed (Paed), MD
1 Department of Health, Western Cape Province, South Africa
2 Department of Paediatrics and Child Health, Faculty of Health Sciences, University of Cape Town, South Africa
3 Division of Health Systems and Public Health, Department of Global Health, Faculty of Medicine and Health Sciences, Stellenbosch University,
South Africa
Corresponding author: M Hendricks ([email protected])
ARTICLE
The aim of this study was to determine progress using a dashboard of the key child health indicators that assess mortality, morbidity and coverage of the main child health services in the Metro West GSA. This involved analysing and linking the different data systems that are currently used. It is envisaged that this information could be used in district health planning, and in the implementation of the key neonatal and child health interventions to reduce morbidity and mortality.
Methods
The study was carried out in the Metro West GSA of the Cape Town Metro district, which includes the Klipfontein, Mitchells Plain, Southern and Western subdistricts. In 2015, the populations aged <18 years and <5 years were estimated to be 421 100 and 152 620, respectively.[6] The largest number of children live in Mitchells Plain, followed by those in the Southern, Klipfontein and Western subdistricts. The health services in the GSA include two level 3 hospitals: Red Cross War Memorial Children’s Hospital (RCWMCH) and Groote Schuur Hospital (GSH), which also each have a level 2 function; there are two level 2 hospitals (New Somerset Hospital (NSH) and Mowbray Maternity Hospital (MMH)), and four level 1 hospitals (False Bay (FBH), Mitchells Plain (MPH), Victoria (VH) and Wesfleur (WFH) Hospitals). RCWMCH is one of the two major paediatric centres in the Cape Metropole, with a level 2 responsibility for child healthcare in two of the subdistricts, and tertiary care for the entire province. NSH and VH are responsible for healthcare in the other subdistricts. Primary care facilities include the following: clinics run by the City of Cape Town (CoCT) municipality; and six 24-hour community health centres, community day centres and five 24-hour maternity obstetric units (MOUs) run by the Western Cape DoH’s Metro District Health Services (MDHS).
The present study was a retrospective review of the health status and services of neonates and children in the Metro West GSA from 1 January 2010 to 31 December 2015. A dashboard was developed of indicators that could be used to track child health and service outcomes in the GSA (Table 1). The indicators were derived from previous reports[2,3] and in consultation with representatives from the provincial Information Management Directorate. The indicators were derived by linking the different data systems that are used by the CoCT and the provincial health authorities. The main health facility-based audit systems include the Perinatal Problem Identification Programme (PPIP) and the Child Healthcare Problem Identification Programme (Child PIP). PPIP audits deliveries, births and deaths within the birthing units at hospitals and MOUs, and Child PIP audits child deaths in hospitals. Child PIP and PPIP do not audit deaths occurring outside the health facilities. Some late neonatal deaths are captured by Child PIP following hospital admission. These audit systems have been adopted by all health facilities in the GSA, with the exception of False Bay Hospital, which has not implemented Child PIP, and where few deaths are reported. The Local Mortality Surveillance System (LMSS) combines death notification and forensic pathology information on deaths both in and out of hospital. Service coverage data were obtained from Clinicom (Siemens, Germany), including hospital admissions, the Patient Record and Health Management Information System (PREHMIS, CoCT, SA) of the CoCT clinics and the Primary Health Care Information System (PHCIS) of the MDHS health facilities. Data from PREHMIS and PHCIS and other manually collected data are aggregated and imported as monthly totals in a provincial computer application called Sinjani (Western Cape DoH, SA).
The PPIP data were analysed for the birthing units within the four subdistricts, including the hospitals (WFH, NSH, MMH, MPH, FBH) and the five MOUs (Gugulethu, Hanover Park, Vanguard, Mitchells Plain and Retreat). The main information captured included the perinatal, early neonatal and neonatal mortality rates
(PNMR, ENMR and NMR), the main causes of death and the avoidable factors. As these rates are much higher at GSH, where preterm and sick neonates are referred, the data for GSH were not included in the subdistrict information, but separately and in the total annual count for the GSA. The Child PIP data were analysed for information on child deaths in terms of the residential subdistrict, the cause of death and the in-hospital mortality rates (IHMRs). The LMSS provided information on the demographic characteristics, the number of infant and under-five deaths and causes of death within the different subdistricts for 2010 - 2013. In February 2014, there was an amendment to the South African Births and Deaths Registration Act No. 51 of 1992, changing the format of the death notification form, for confidentiality purposes, resulting in the cause-of-death information no longer being obtainable through Home Affairs.[7] Subsequently, for 2014 and 2015 there were no cause-of-death data, but the number of child deaths was determined from the in-hospital deaths captured by Child PIP, and the number of out-of-hospital deaths provided by the Forensic Pathology Service (FPS). Information was obtained from Sinjani and Clinicom to determine the various child health indicators: disease incidence rates on diarrhoea, pneumonia and severe acute malnutrition; immunisation coverage; vitamin A coverage; exclusive breastfeeding rates; and indicators relating to the prevention of mother-to-child transmission (PMTCT) of HIV.
The denominators used for the purpose of this study included the following: the numbers of births at the various birthing facilities where the PPIP programme was implemented were used to calculate the PNMR, the ENMR and the NMR; based on the Statistics South Africa (StatsSA) data[6] and adjusted for subdistrict populations from the SA Medical Research Council burden of disease study,[8] the births were used to calculate infant and under-five mortality for the subdistricts and Metro West; and the population estimates from Statistics South Africa (Stats SA) were used to calculate the service-related health indicators.[6]
Ethical approval for the study was obtained from the Human Research Ethics Committee of the University of Cape Town (ref. no. 288/2013), and it was registered on the National Health Research Database (ref. no. WC_2017RP20_958). As the review was based on secondary data sources and did not involve primary research, no consent was required from participants.
A data file was created in Excel 2013 (Microsoft, USA). Analyses were undertaken in Excel to determine summary statistics, including disease incidence rates and percentages relating to coverage. The data trends over the 6-year period were analysed.
Results
Perinatal, early neonatal and neonatal mortality
The total deliveries, live births, stillbirths, early and late neonatal deaths and the perinatal, early neonatal and neonatal mortality rates for the subdistricts in Metro West from 2010 to 2015 are outlined in Table 2. Over the 6-year period, there was a decrease in the PNMR from 31.7 to 24.8 per 1 000 deliveries, and in ENMR and NMR from 7.7 and 8.6 to 7.0 and 8.2 per 1 000 live births, respectively. The reduction in these rates largely resulted from a decrease in the proportion of stillbirths and early neonatal deaths in all the subdistricts.
The PNMR and ENMR declined progressively based on the weight categories of neonates. These mortality rates fell almost three times lower with each increase in weight category, from 1 000 - 1 500 g to 2 000 - 2 500 g (Figs 1 and 2).
ARTICLE
Infant and child mortality
The infant mortality rate (IMR) in Metro West decreased from 21 to 18 per 1 000 live births between 2010 and 2013 (Fig. 5). The relative decreases in IMR were 15% and 5% in Mitchells Plain and Southern subdistricts, respectively; this is in contrast with relative increases in Western and Klipfontein of 40% and 10%, respectively. The under-five mortality rate (U5MR) decreased in Metro West from 25 to 21 per 1 000 live births in 2010 v. 2011 and increased slightly to 22 per 1 000 live births in 2013. In 2015, using the data from Child PIP and the FPS, the U5MR was estimated to be 22 per 1 000 live births. At a subdistrict level, the largest decreases in under-five mortality were in Mitchells Plain and Southern, from 32 to 19 and 23 to 15 per 1 000 live births between 2010 and 2013. There was a slight decrease in the U5MR in Klipfontein, and an increase in Western from 21 to 27 per 1 000 live births.
Causes of under-five mortality
Neonatal conditions (preterm birth complications, birth asphyxia and perinatal injuries) and pneumonia were the most common causes of under-five mortality in Metro West between 2010 and 2013 (Fig. 6). Diarrhoea was the third most common cause of death in 2010, but there was a noticeable drop in diarrhoeal deaths. Diarrhoeal disease was the fifth most common cause of under-five mortality in 2014. The other important causes of under-under-five deaths were injuries (includes fires or hot substances, hanging or strangulation, interpersonal violence, road traffic accidents, drowning and poisoning) and congenital birth defects (cardiac, gastrointestinal, neural tube and other).
Child PIP, Clinicom and the LMSS were used to determine hospital admissions and deaths for all children and for those with diarrhoea and pneumonia. Using these data sources, we could determine child deaths that occurred within hospitals in the GSA, and those that
Table 1. Neonatal and child health indicators in dashboard
Indicator Calculation: numerator/denominator Data source* Coverage
PNMR Stillbirths + deaths 0 - 7 days per 1 000 deliveries PPIP Inpatients
ENMR Deaths 0 - 7 days per 1 000 live births in facility PPIP Inpatients
NMR Deaths 0 - 28 days per 1 000 live births in facility PPIP and Child PIP Inpatients
IMR Deaths <1 yr per 1 000 live births LMSS/Stats SA† Subdistrict
U5MR Deaths <5 yr per 1 000 live births LMSS/Stats SA† Subdistrict
Child deaths in first yr of life, % Deaths <1 yr/deaths <5 yr × 100 LMSS/Sinjani Subdistrict
IHMR <5 yr, % Deaths <5 yr/admissions <5 yr × 100 Child PIP Inpatients
Diarrhoeal disease
(% IHMR) Diarrhoeal hospital deaths/diarrhoea admissions × 100 Child PIP/Clinicom Inpatients
Pneumonia (% IHMR) Pneumonia hospital deaths/ pneumonia admissions × 100 Child PIP/Clinicom Inpatients SAM (% case fatality rate) SAM deaths <5 yr/SAM admissions <5 yr × 100 Child PIP/Clinicom Inpatients Diarrhoea incidence per 1 000 under-fives Children <5 yr with diarrhoea and dehydration per 1 000
under-five population Sinjani/StatsSA PHC
Diarrhoea % hospital admissions Children with diarrhoea admitted/total admissions × 100 Child PIP/Clinicom Inpatients Pneumonia incidence per 1 000
under-fives Children <5 yr with pneumonia per 1 000 population <5 yr Sinjani/StatsSA PHC
Pneumonia % hospital admissions Children with pneumonia admitted/ Total number of
child admissions × 100 Child PIP/Clinicom Inpatients
PMTCT: HIV transmission rate 6 wk Babies PCR test result positive/babies who had PCR test
× 100 Sinjani/ StatsSA PHC
PMTCT: NVP uptake in infants Babies on NVP/babies on PMTCT programme × 100 Sinjani/ StatsSA PHC PMTCT: HAART coverage of mother HIV-positive mothers on HAART/mothers who tested
HIV positive × 100 Sinjani/StatsSA PHC
PMTCT: HIV testing rate Accepted antenatal HIV testing/receiving antenatal care × 100 Sinjani/StatsSA PHC Immunisation coverage under 1 yr <1 yr immunised fully/population <1 yr × 100 Sinjani/StatsSA PHC Pneumococcal vaccine 3rd dose coverage Receiving 3rd dose PCV/population <1 yr × 100 Sinjani/StatsSA PHC Rotavirus 2nd dose coverage Number receiving 2nd dose RV/population under 1 yr × 100 Sinjani/StatsSA PHC Measles 1st dose under 1 yr coverage Number receiving 1st dose measles/population under 1
yr × 100 Sinjani/StatsSA PHC
Measles 2nd dose coverage Number receiving 2nd dose measles/population at 18 mo × 100 Sinjani/StatsSA PHC Infant exclusively breastfed at 3rd dose
hep B Infant exclusively breastfed at 3rd dose hep B/infants receiving hep B 3rd dose × 100 Sinjani/StatsSA PHC Vitamin A supplementation coverage of
children 1 - 5 yr Children 12 - 59 mo given vitamin A/population 12 - 59 mo Sinjani/StatsSA PHC
PNMR = perinatal mortality rate; PPIP = Perinatal Problem Identification Programme; ENMR = early neonatal mortality rate; NMR = neonatal mortality rate; Child PIP = Child Health Problem Identification Programme; IMR = infant mortality rate; LMSS = Local Mortality Surveillance System; Stats SA = Statistics South Africa; U5MR = under-five mortality rate; IHMR = in-hospital mortality rate; SAM = severe acute malnutrition; PMTCT = prevention of mother-to-child transmission; PCR = polymerase chain reaction; NVP = nevirapine; HAART = highly active antiretroviral therapy; hep B = hepatitis B.
ARTICLE
occurred outside the hospital or at home. As outlined in Table 3, more than 50% of the child deaths occurred outside the hospital or at home. Of the pneumonia and diarrhoeal deaths, more than 80% occurred outside the hospital or at home. There was a reduction of 45% in the in-hospital deaths, with a decline in the IHMR from 1.1% to 0.6% between 2010 and 2015. The decline in IHMR over this period was associated with a decline in the in-hospital diarrhoea- and the HIV-related deaths. The data show fluctuations but little change in the IHMR for pneumonia. In terms of the out-of-hospital deaths, there was a decline in the diarrhoeal but not in the
pneumonia deaths. With respect to severe acute malnutrition, there were 236 admissions and 7 deaths in 2015, with an in-hospital case fatality rate of 3%.
Indicators on child health services
Indicators relating to low birth weight (LBW), immunisation and PMTCT status are outlined in Table 4. There was a slight decrease in the LBW rate in Metro West between 2010 and 2015, from 17.1% to 14.6%; the LBW rate decreased in two of the subdistricts (Mitchells Plain and Western), but not in Klipfontein and Southern. The
Table 2. Perinatal, early neonatal and neonatal mortality rates by subdistrict in Metro West GSA, 2010 - 2015*
Subdistrict Deliveries Live births Stillbirths ENNDs LNNDs PNMR ENMR NMR
2010
Klipfontein 4 503 4 447 56 21 1 17.1 4.7 4.9
Mitchells Plain 3 669 3 626 43 12 5 15.0 3.3 4.7
Southern 13 172 12 975 199 77 10 21.0 5.9 6.7
Western 9 981 9 802 179 66 4 24.5 6.7 7.1
GSH 5 691 5 280 411 104 11 90.5 19.7 21.8
Metro West 37 016 36 130 888 280 31 31.6 7.7 8.6
2011
Klipfontein 4 378 4 332 46 22 4 16.4 5.1 6.0
Mitchells Plain 3 555 3 516 39 9 3 14.3 2.6 3.4
Southern 13 771 13 596 175 75 14 19.2 5.5 6.5
Western 9 754 9 605 149 59 3 21.6 6.1 6.5
GSH 5 590 5 229 361 61 5 75.5 11.7 12.6
Metro West 37 048 36 278 770 226 29 26.9 6.2 7.0
2012
Klipfontein 4 000 3 956 44 16 2 15.5 4.0 4.6
Mitchells Plain 3 280 3 234 46 12 0 17.7 3.7 3.7
Southern 13 503 13 347 156 58 12 16.7 4.3 5.2
Western 9 961 9 833 128 54 5 18.8 5.5 6.0
GSH 4 012 3 688 324 100 11 105.6 27.1 30.1
Metro West 34 756 34 058 698 240 30 27.0 7.0 7.9
2013
Klipfontein 3 541 3 485 56 15 1 20.5 4.1 4.6
Mitchells Plain 3 029 2 992 37 10 4 14.6 3.1 4.7
Southern 13 498 13 347 148 66 16 15.7 4.8 6.1
Western 10 140 9 985 155 64 4 21.7 6.5 6.8
GSH 3 196 2 871 325 82 11 127.3 28.6 32.4
Metro West 33 404 32 680 721 237 36 28.6 7.2 8.4
2014
Klipfontein 3 597 3 555 42 15 2 16.4 4.7 4.8
Mitchells Plain 2 892 2 873 19 12 0 10.7 4.2 4.2
Southern 12 942 12 777 165 64 11 18.5 5.0 5.9
Western 9 420 9 297 123 35 1 16.9 3.8 3.9
GSH 2 989 2 693 296 68 26 122 25.2 34.9
Metro West 31 840 31 195 645 194 40 26.4 6.2 7.5
2015
Klipfontein 3 259 3 228 31 15 2 14.1 4,6 5.3
Mitchells Plain 5 909 5 853 55 15 1 11.8 2.6 2.7
Southern 12 567 12 446 121 79 20 15.9 6.3 8.0
Western 10 411 10 276 135 68 4 19.5 6.6 7.0
GSH 3 061 2 773 288 66 13 115.6 23.8 28.5
Metro West 35 207 34 576 630 243 40 24.8 7.0 8.2
GSA = geographic service area; ENNDs = early neonatal deaths; LNNDs = late neonatal deaths; PNMR = perinatal mortality rate; ENMR = early neonatal mortality rate; NMR = neonatal mortality rate.
ARTICLE
rate for exclusive breastfeeding in 2015 was 30%, and ranged from 25% to 44% across the GSA. Vitamin A supplementation coverage improved in some subdistricts but not others over the 6-year period. There was an overall improvement in the immunisation
coverage indicators for the GSA. Coverage for the second dose of measles immunisation improved from 66% to 85%, while there were considerable improvements in the pneumococcal (PCV)
Per
ina
tal mor
talit
y per 1 000 deliv
er
ies 300
250
200
150
100
50
0
2010 2011 2012 2013 2014 2015 Year
1 000 - 1 499 g 1 500 - 1 999 g 2 000 - 2 499 g
>2 500 g All
Fig. 1. Perinatal mortality rates by weight category for neonates born in Metro West geographic service area, 2010 - 2015; Perinatal Problem Identification Programme data.
1 500 - 1 999 g 2 000 - 2 499 g >2 500 g All
ENMR per 1 000 bir
ths
30 25 20 15 10 5 0
2010 2011 2012 2013 2014 2015 Year
Fig. 2. Early neonatal mortality rates by weight category for neonates born in Metro West geographic service area, 2010 - 2015; Perinatal Problem Identification Programme data. (ENMR = early neonatal mortality rate.)
2010 2011 2012 2013 2014 2015 Year
Causes of dea
th, %
30 25 20 15 10 5 0
SPTL APH Hypertension IUD Infections
Fig. 3. Obstetric causes of death for neonates >1 000 g in Metro West geographic service area, 2010 - 2015; Perinatal Problem Identification Programme data. (SPTL = spontaneous preterm labour; APH = antepartum haemorrhage; IUD = intrauterine death.)
Hypoxia
Congenital abnormalities Immaturity
Infections
2010 2011 2012 2013 2014 2015
M
ain causes
, %
45 40 35 30 25 20 15 10 5 0
Year
Fig. 4. Main causes of neonatal deaths in Metro West geographic service area, 2010 - 2015; Perinatal Problem Identification Programme data.
Total MW 35
30
25
20
15
10
5
0
2010 2011 2012 2013
IMR U5MR IMR U5MR IMR U5MR IMR U5MR
D
ea
ths per 1 000 liv
e bir
ths 22
21 25
17 21
14 20
18
KF MP Southern Western All MW
Fig. 5. Infant and under-five mortality by subdistrict, 2010 - 2013; Local Mortality Surveillance System data. (IMR = infant mortality rate; U5MR = under-five mortality rate; KF = Klipfontein; MP = Mitchells Plain; MW = Metro West.)
2010 2011 2012 2013
M
ain causes
,
n
250 200 150 100 50 0
HIV Neona
tal
conditions Pneumonia Diar rhoea Injuries
Congenital abnor
malities
210
150 161
223
146
201
163 177
121
82
38 55
75
59 80 58
41 32 54 64 47 16 12 13
ARTICLE
third dose and rotavirus (RV) second dose immunisations. Southern had the greatest improvement in immunisation coverage <1 year old, from 62% to 100%.
In terms of PMTCT between 2010 and 2015, the HIV transmission rate at 6 weeks decreased in almost all the subdistricts to ≤2%; the uptake of nevirapine in infants remained high, at 98%; highly active antiretroviral therapy (HAART) coverage in mothers increased from 67% to 90%; and HIV testing antenatally, and polymerase chain reaction testing in infants, increased to 93% and 97%, respectively (Table 4).
Priority child health conditions:
Diarrhoea, pneumonia and
injuries
From 2010 to 2015, the incidence of pneumonia increased in all the subdistricts in the GSA, from 54 to 115 per 1 000 under-five children. This contrasts with the incidence of diarrhoea, which remained nearly constant, with a slight increase from 13 to 20 per 1 000 children under 5 years old.
Discussion
The PNMR and ENMR of 24.8 per 1 000 deliveries and 7 per 1 000 live births for Metro West are lower than the rates reported nationally.[9] While there has been a marginal decrease in the ENMR, the PNMR has shown a greater decrease, resulting from a drop in the stillbirth rate by almost a third over the 6-year period. Numerous factors have contributed to these decreases. These include monthly perinatal audit meetings at birthing units to address the avoidable factors and implement recommendations in line with the National Perinatal Mortality and Morbidity Committee,[3,9,10] ongoing training in medical and obstetric emergencies and neonatal resuscitation, implementation of maternal and neo-natal facility-based guidelines, increased PMTCT coverage and improvements in access to care through a more efficient interfacility emergency transport system (Dr L Jacobs, personal communication, 12 September 2018).
Further reductions in the PNMR, ENMR and NMR will require a greater focus on interventions to reduce stillbirths, prematurity and intrauterine growth restriction. The LBW rate remains high, and these neonates are at a higher risk of mortality.[11] This situation requires strengthening antenatal interventions, including promoting early booking, adequate maternal nutrition,[12] avoidance of substance abuse, regular antenatal attendance; monitoring for hypertension and infections and early care seeking.
The ongoing training days and rollout of programmes such as the Management of Sick and Small Newborn package to MOUs and district hospitals could address the patient- and medical personnel-related factors contributing to neonatal deaths.[13] Reducing the neonatal deaths that account for about a third of under-five deaths is critical in making further gains in child survival in the GSA.
The U5MR for the 6-year period is lower than the national rate of 39 per 1 000 live births.[14] Over this period there was a marginal decrease in the U5MR, which appears to be plateauing. The relative increase in the infant and U5MRs reported in Klipfontein and Western in 2013 could have resulted from an overestimation of the actual mortality rates for these subdistricts, as there was under-registration of births, which similarly affected these indicators in the province over this period.[15]
Contributing to the decrease in under-five mortality between 2010 and 2015 in the GSA was the decrease in in-hospital child deaths from diarrhoea and HIV. The reduction in diarrhoeal admissions and deaths could be attributed to increased coverage of the rotavirus vaccine, improved management of children with diarrhoea at the primary level of care and an increase in beds and part-time staff at district and regional hospitals during the diarrhoeal season. The decrease in HIV-related deaths could be attributed to improved PMTCT coverage and access to antiretroviral treatment for HIV-infected children. While there has been a reduction in in-hospital deaths, the high number of out-of-hospital deaths limits further reductions in the U5MR in the GSA.
The findings of the present study are consistent with those of previous research[16] that showed that more than half of the under-five deaths occurred out of hospital, with pneumonia and diarrhoea accounting for most of the natural deaths.A recent review of child deaths at two mortuaries in Cape Town and Durban showed that most of the out-of-hospital under-five deaths (40%) were due to pneumonia. Many of these deaths included preterm infants who died unexpectedly outside the neonatal period shortly after being discharged from hospital. The caregivers of these children lived in poor social circumstances with limited support. The authors of that review recom-mended a multi-pronged approach involving community-based services that could target high-risk mothers requiring support and interventions to prevent these deaths.[17]
The high number of out-of-hospital child deaths and the slow decline in the U5MR provides a strong motivation for the implementation of interventions on pneumonia and diarrhoea by community
Ta
bl
e 3. A
dmiss io ns a nd d ea ths f ro m di arrho ea, p ne umo ni a a nd a ll c aus
es in chi
ldr en und er fiv e y ea rs o
ld in M
et
ro W
es
t GSA, 2010 - 2015*
Ye ar Di arrho ea Pneumo ni a Al l Admis sio ns, n De ath s n (%) IHMR , % Admis sio ns, n De ath s, n (%) IHMR , % Admis sio ns, n De ath s, n (%) To ta l IHMR , % ‡ In-hos pi ta l O ut-o f- hos pi ta l In-hos pi ta l O ut-o f-hos pi ta l In-hos pi ta l † Ou t-o f-hos pi ta l 2010 3 695 12 (10) 109 (90) 0.4 2 870 28 (19) 123 (81) 1.0 24 984 441 (51) 418 (49) 859 1.1 2011 3 377 5 (6) 77 (94) 0.1 4 188 19 (10) 182 (90) 0.5 27 639 347 (49) 361 (51) 708 0.8 2012 3 000 2 (9) 36 (91) 0.2 4 355 15 (9) 137 (91) 0.3 26 988 353 (51) 337 (49) 690 0.7 2013 3 075 7 (13) 48 (87) 0.1 4 675 12 (7) 159 (93) 0.3 30 627 367 (48) 398 (52) 765 0.6 2014 3 224 0 -0.1 4 024 25 -0.6 30 667 343 (50) 340 (50) § 683 0.6 2015 2 798 3 -0.1 4 047 15 -0.4 30 475 359 (49) 376 (51) § 735 0.6 Bl an k ce
ll = d
at
a n
ot a
va
ila
ble; IHMR = in-h
os pi ta l m or ta lit y ra te . *S our ce: C linico m, C hi ld P IP a nd LMSS; †in cludes a ll c hi ld h os pi ta l de at
hs in M
et ro W es t g eog ra phic s er vice a re a; ‡ba se d o n a ll h os pi ta l de at
hs in M
ARTICLE
health workers (CHWs) who operate within ward-based outreach teams. These interventions have been incorporated into the integrated community case management (iCCM)[18] strategy of the World Health Organization and the United Nations Children’s Fund, and would require an increase in the number of CHWs trained and supervised in iCCM. As outlined by Doherty et al,[19] attention needs to be given to increasing the number of CHWs, improving the CHW-to-population ratio and broadening their scope of practice, so that these interventions can achieve their necessary goal.
One area where CHWs could make an impact is in vitamin A supplementation. Coverage doubled over the 6-year period in the GSA, but remains low, at just over 40%. Although the guidelines have been revised to allow CHWs to administer vitamin A, this can only be done under the supervision of a professional nurse.[20] Changing this practice to allow CHWs to routinely provide vitamin A during outreach visits would improve coverage and potentially reduce the all-cause under-five mortality within the GSA.[21]
Exclusive breastfeeding coverage during the first 6 months of life is low in Metro West. However, data were missing for certain health facilities, which may have contributed to these low figures. The reasons for this are not clear, as most of the birthing facilities within the GSA are Mother-Baby Friendly Initiative-accredited, and clinic staff are trained through the integrated management of childhood illness strategy and the integrated nutrition programme to promote and support breastfeeding. There is good evidence to show that educational interventions can increase the exclusive breastfeeding coverage rates, and that a combination of individual and group sessions is more effective than either alone.[12] Scaling up the coverage of exclusive breastfeeding will improve child survival and reduce the number of stunted children.[12] The promotion of and support for breastfeeding requires identifying the barriers to exclusive breastfeeding, its promotion using community- and facility-based platforms, the establishment of breastfeeding support groups within communities and the implementation of the postnatal care policy at MOUs and clinics.
The strengths of the present study relate to the linking of the different mortality audit systems that were used to report on all child deaths, and determine the various mortality indicators and the causes of death. Analysis of the PREHMIS and Clinicom data
provided valuable information on the service coverage rates. The linking of these data systems has resulted in the development of an indicator dashboard for the subdistricts in Metro West. Making this information available to service providers and managers could be used to inform policies and interventions to reduce mortality and morbidity and improve service delivery for neonates and children in the GSA. Further work is needed to develop a provincial system that will link these different data systems and ensure that this information is routinely provided. There is a need to determine the HIV and nutritional status of all the children whose deaths are captured by the different mortality audit systems.
The limitations of the study relate to it reporting only on children in the public health sector, which is utilised by about 75% of the population in the Western Cape. The data on service delivery outcomes therefore exclude about a quarter of the province’s children, who access private healthcare.[22] The service coverage estimations used Stats SA data that included projected population estimates by age, gender and subdistrict for the GSA, which could have affected the accuracy of these calculations. Furthermore, the quality of routine data is affected by the fact that there are multiple data collectors, and this influences completeness and accuracy.
The LMSS included child deaths among those accessing private healthcare for the period 2010 - 2013. Linking the FPS to Child PIP and PPIP ensured that out-of-hospital deaths were reported on for 2014 and 2015. We did not include the 2016 and 2017 data, as we did not have access to the FPS data for these years.
Conclusion
Progress has been made in reducing perinatal, early neonatal, infant and under-five mortality in Metro West. Achieving further reductions in these rates will require that health workers across the service delivery platform focus on interventions to reduce deaths from neonatal conditions and out-of- hospital deaths, especially resulting from pneumonia. This requires the prevention of stillbirths, and preterm and intrauterine growth-restricted births, at the different levels. Increasing the coverage of exclusive breastfeeding and vitamin A supplementation could contribute to averting child deaths in the GSA. CHWs have a key role to play in improving the coverage of these interventions and preventing out-of-hospital deaths, through
Table 4. Indicators of child health services by subdistrict and total GSA, 2010 and 2015, as % coverage
Klipfontein Mitchells Plain Southern Western Metro West GSA
Indicator 2010 2015 2010 2015 2010 2015 2010 2015 2010 2015
Low birth weight rate 9.7 11.9 11 5.9 12.3 14.7 15.8 12.2 17.1 14.6
Exclusive breastfeeding at 3rd hep B immunisation* - 27 - 44 - 25 - 26 - 30
Vitamin A coverage 12 - 59 months 18 48 21 51 16 35 25 42 20 44
SAM in-hospital CFR 3 0 1 0 0 0.7 2 0.0 1 0.3
Immunisation coverage <1 year 100 87 83 90 62 100 89 100 83 99
Measles 1st dose coverage 100 100 83 100 68 100 91 100 85 100
Measles 2nd dose coverage 75 74 75 84 54 90 63 88 66 85
PCV 3rd dose coverage 70 89 66 94 50 100 52 100 59 100
RV 2nd dose coverage 57 94 51 100 54 100 56 100 54 100
HIV transmission rate at 6 weeks 3 1 3 0 3 2 4 2 3 2
NVP uptake infant 100 98 99 100 99 99 97 97 99 98
HAART/ARV coverage in pregnant mother 67 84 57 86 83 90 62 95 67 90
HIV testing rate in mother antenatally - 91 - 94 - 95 - 92 - 93
HIV-exposed children whose PCR was done - 97 - 98 - 98 - 97 - 97
Percentages >100 reported as 100%.
GSA = geographic service area; hep B = hepatitis B; SAM = severe acute malnutrition; CFR = case fatality rate; PCV = polymerase chain reaction; RV = rotavirus; NVP = nevirapine; HAART = highly active antiretroviral therapy; ARV = antiretroviral; - = data not available.
ARTICLE
regular home visitation of at-risk infants. At GSA governance level, consideration should be given to increasing the CHW-to-population ratio and broadening the scope of practice of CHWs.
Acknowledgements. We would like to acknowledge the staff at the various health facilities who collected the data.
Author contributions. MH: conception, design, data analysis and interpretation, drafting, revision and approval of manuscript; AH: conception, design, data interpretation and drafting of manuscript; LJ: data analysis and interpretation, drafting of manuscript; JE: data analysis and interpretation; drafting of manuscript; HM: data analysis and interpretation; drafting and revision of manuscript; LL: conception, design and drafting of manuscript; AW: conception, design and drafting of manuscript.
Funding. None.
Conflicts of interest. None.
1. Western Cape Department of Health, South Africa. Healthcare 2030: The road to wellness. Cape Town: Department of Health, 2014:1-170. https://www.
westerncape.gov.za/assets/departments/health/healthcare2030.pdf (accessed
14 September 2018).
2. Hendricks M, Nelson C, Linley L, Westwood A, Hawkridge A. A situational analysis of neonatal and child health status in the Metro West geographical service area of the Western Cape. Cape Town: Department of Health, 2012. 3. Committee on Morbidity and Mortality in Children Under 5 Years. 1st
Triennial Report of the Committee on Morbidity and Mortality in Children Under 5 Years (CoMMiC). Pretoria: CoMMiC, 2012.
4. World Health Organization. Everybody’s business: Strengthening health systems to improve health outcomes: WHO’s framework for action. Geneva: WHO, 2007.
5. World Health Organization. Monitoring the building blocks of health systems: A handbook of indicators and their measurement strategies. Geneva: WHO, 2010. 6. Western Cape Government Department of Health. District population
estimates for the Western Cape based on Census 2011. Circular H28/2014, 2014:1-73.
7. Groenewald P, Azevedo V, Daniels J, et al. The importance of identified cause-of-death information being available for public health surveillance, actions and research. S Afr Med J 2015;105(7):528-530. https://doi.org/10.7196/ SAMJnew.8019
8. Zinyakatira N. Birth calculations based on Stats SA data 2009 - 2014. Cape Town: South African Medical Research Council, 2014.
9. Pattinson RC, Rhoda N. Saving babies 2012 - 2013: Ninth report on perinatal care in South Africa. Pretoria: Tshepesa Press, 2014.
10. National Perinatal Mortality and Morbidity Committee (NaPeMMCo) Triennial Report (2008 - 2010). Pretoria: Department of Health, 2011. 11. Katz J, Lee AC, Kozuki N, et al. Mortality risk in preterm and
small-for-gestational-age infants in low-income and middle-income countries: A pooled country analysis. Lancet 2013;382(9890):417-425. https://doi.org/10.1016/ S0140-6736(13)60993-9
12. Bhutta ZA, Das JK, Rizvi A, et al. Evidence-based interventions for improvement of maternal and child nutrition: What can be done and at what cost? Lancet 2013;382(9890):452-477. https://.doi.org/10.1016/ S0140-6736(13)60996-4 13. Department of Health, South Africa. Newborn care charts: Routine care at
birth and management of the sick and small newborn in hospital. Guidelines for the care of all newborns in district hospitals, health centres and midwife obstetric units in South Africa. Pretoria: Department of Health, 2014. http:// www.kznhealth.gov.za/kinc/Newborn_care_charts_March_2014.pdf (accessed 14 September 2018).
14. Dorrington R, Bradshaw D, Laubscher R, Nannan N. Rapid mortality surveillance report 2013. Cape Town: South African Medical Research Council, 2014.
15. Morden EG, Zinyakatira N, Neethling I, et al. Western Cape Mortality Profile 2013. Cape Town: South African Medical Research Council, 2016. 16. Reid AE, Hendricks MK, Groenewald P, Bradshaw D. Where do children die
and what are the causes? Under-5 deaths in the Metro West geographical service area of the Western Cape, South Africa, 2011. S Afr Med J 2016;106(4):359-364. https://doi.org/doi:10.7196/SAMJ.2016.v106i4.10521
17. Mathews S, Martin L, Coetzee D, et al. The South African child death review pilot: A multiagency approach to strengthen healthcare and protection for children. S Afr Med J 2016;106(9):895-889. https://doi.org/doi:10.7196/ SAMJ.2016.v106i9.112342016
18. World Health Organization, United Nations Children’s Fund. Joint statement integrated community case management. An equity-focused strategy to improve access to essential treatment services for children. New York: UNICEF, 2012.
19. Doherty T, Kroon M, Rhoda N, Sanders D. Ending preventable child deaths in South Africa: What role can ward-based outreach teams play? S Afr Med J 2016;106(7):672-674. https://doi.org/doi:10.7196/SAMJ.2016. v106i7.10790
20. Department of Health, South Africa. National vitamin A supplementation policy guidelines for South Africa. Pretoria: Department of Health, 2012. 21. Saitowitz R, Hendricks M, Fiedler J, et al. A proposed vitamin A
supplementation programme for South Africa: Design, coverage and cost. S Afr Med J 2001;91(9):755-760.
22. Statistics South Africa. Statistical Release PO318. Pretoria: Stats SA, 2016.