Identification of novel risk factors for
community-acquired Clostridium difficile
infection using spatial statistics and
geographic information system analyses
Deverick J. Anderson1,2*, Leoncio Flavio Rojas2, Shera Watson2, Lauren P. Knelson2,3, Sohayla Pruitt4,5, Sarah S. Lewis1,2, Rebekah W. Moehring1,2,6, Emily E. Sickbert Bennett7,
David J. Weber7, Luke F. Chen1,2, Daniel J. Sexton1,2, the CDC Prevention Epicenters Program
1 Department of Medicine, Duke University, Durham, North Carolina, United States of America, 2 Duke Center for Antimicrobial Stewardship and Infection Prevention, Duke University Durham, North Carolina, United States of America, 3 Breast Oncology Program, Susan F. Smith Center for Women’s Cancers at Dana-Farber Cancer Institute, Boston, Massachusetts, United States of America, 4 Duke Health Technology Solutions, Durham, North Carolina, United States of America, 5 Forecast Health, Durham, North Carolina, United States of America, 6 Durham VA Medical Center, Durham, North Carolina, United States of America, 7 Department of Hospital Epidemiology, University of North Carolina at Chapel Hill, Chapel Hill, North Carolina, United States of America
Abstract
Background
The rate of community-acquired Clostridium difficile infection (CA-CDI) is increasing. While receipt of antibiotics remains an important risk factor for CDI, studies related to acquisition of C. difficile outside of hospitals are lacking. As a result, risk factors for exposure to C. diffi-cile in community settings have been inadequately studied.
Main objective
To identify novel environmental risk factors for CA-CDI
Methods
We performed a population-based retrospective cohort study of patients with CA-CDI from 1/1/2007 through 12/31/2014 in a 10-county area in central North Carolina. 360 Census Tracts in these 10 counties were used as the demographic Geographic Information System (GIS) base-map. Longitude and latitude (X, Y) coordinates were generated from patient home addresses and overlaid to Census Tracts polygons using ArcGIS; ArcView was used to assess “hot-spots” or clusters of CA-CDI. We then constructed a mixed hierarchical model to identify environmental variables independently associated with increased rates of CA-CDI.
a1111111111 a1111111111 a1111111111 a1111111111 a1111111111
OPEN ACCESS
Citation: Anderson DJ, Rojas LF, Watson S,
Knelson LP, Pruitt S, Lewis SS, et al. (2017) Identification of novel risk factors for community-acquired Clostridium difficile infection using spatial statistics and geographic information system analyses. PLoS ONE 12(5): e0176285.https://doi. org/10.1371/journal.pone.0176285
Editor: Abhishek Deshpande, Cleveland Clinic,
UNITED STATES
Received: August 11, 2016
Accepted: April 7, 2017
Published: May 16, 2017
Copyright: This is an open access article, free of all
copyright, and may be freely reproduced, distributed, transmitted, modified, built upon, or otherwise used by anyone for any lawful purpose. The work is made available under theCreative Commons CC0public domain dedication.
Data Availability Statement: The dataset used for
Results
A total of 1,895 unique patients met our criteria for CA-CDI. The mean patient age was 54.5 years; 62% were female and 70% were Caucasian. 402 (21%) patient addresses were located in “hot spots” or clusters of CA-CDI (p<0.001). “Hot spot” census tracts were scat-tered throughout the 10 counties. After adjusting for clustering and population density, age
60 years (p = 0.03), race (<0.001), proximity to a livestock farm (0.01), proximity to farm-ing raw materials services (0.02), and proximity to a nursfarm-ing home (0.04) were indepen-dently associated with increased rates of CA-CDI.
Conclusions
Our study is the first to use spatial statistics and mixed models to identify important environ-mental risk factors for acquisition of C. difficile and adds to the growing evidence that farm practices may put patients at risk for important drug-resistant infections.
Introduction
Clostridium difficileinfection (CDI) leads to adverse patient outcomes [1]. Now the most com-mon pathogen causing healthcare-associated infections (HAI) [2], deaths related to CDI increased 400% between 2000 and 2007 [3]. In fact, the CDC estimates that approximately 500,000 patients have CDI each year in the US, and 29,000 die as a result of the infection [4]. As a result, CDI was recently classified as an “urgent” threat to public health [5].
While the threat from CDI continues to grow, its epidemiology is incompletely understood. More than 50% of CDI cases begin in the community [6], and the rate of community-acquired
(CA) CDI is increasing [6,7]. However, a large proportion of patients who develop CA-CDI
lack traditional risk factors such as antimicrobial use or proton pump inhibitor (PPI) exposure [8,9]. Ultimately, patients admitted to acute care hospitals with CA-CDI in turn impart “CDI pressure” that increases the risk of acquisition of CDI by other vulnerable hospitalized patients that share the same hospital unit [10].
Environmental factors may increase the risk for community acquisition of some
tradition-ally healthcare-associated pathogens, including methicillin-resistantStaphylococcus aureus
(MRSA) andC.difficile. For example, the authors of a recent analysis of 1,539 cases of
CA-MRSA in a population of 446,480 concluded that proximity to farms that applied swine manure fertilizer was a strong predictor for CA-MRSA skin infection [11]. Similarly, pig farms have recently been associated with CDI, particularly infections caused by ribotype 078 strain [12].
In light of our limited understanding of community reservoirs ofC.difficileand the fact
that many patients who develop CA-CDI lack traditional risk factors, new and innovative approaches are needed to determine if additional environmental factors increase the risk for
community acquisition ofC.difficile. Methods in spatial statistics including Geographic
Infor-mation Systems (GIS) are increasingly applied to healthcare investigations and allow research-ers to examine outpatient transmission by analyzing the dynamics of spatial configuration of disease over time. We therefore undertook this large, multicenter cohort study using GIS and spatial statistics to identify novel environmental risk factors for CA-CDI.
Funding: This work was supported by the CDC
Prevention Epicenters Program [U54CK000164] and the National Center for Advancing Translational Sciences (NCATS), National Institutes of Health [UL1TR001111]. The content is solely the responsibility of the authors and does not necessarily represent the official views of the NIH or the CDC.
Competing interests: Sohayla Pruitt was employed
Materials and methods
The Duke University Health System (Pro00063169) and University of North Carolina (#15– 1712) IRBs approved this research.
Patient identification
This population-based retrospective cohort study included patients with CDI from two health systems. These systems included two tertiary care hospitals, three community hospitals in the Duke Infection Control Outreach Network [13], and 802 outpatient facilities. Microbiology
records were queried to identify all patients with a positive stool test forC.difficilefrom
Janu-ary 1, 2007, through December 31, 2014 (hereafter, the “study period”). If a patient had more
than one positive test forC.difficile, only the first test during the study period was included.
Patients were defined as having CA-CDI if a positive test was obtained a) at an outpatient clinic or b) during the first 72 hours of a documented hospitalization [14]. Patients who met the above criteria were excluded from our analysis if they had been hospitalized in the prior 12 weeks. Finally, we narrowed our analysis to include only case patients with addresses in a 10-county area surrounding the five study hospitals in an attempt to include the collective catchment area of the study hospitals and health systems in central NC. The population of the 10 study counties was approximately 1.94 million; 1.2 million were located in the two largest population centers: Wake County (Raleigh) and Durham County (Durham).
Data management and GIS methods
Demographic data for North Carolina were obtained and grouped at Census Tract level using 2010 United Sates Census Bureau Data [15]; 360 Census Tracts in the 10 counties were used as the demographic GIS base-map. We obtained Census Tracts surfaces as measured in square kilometers and converted to square miles [16]. Data related to socioeconomic status were obtained for targeted census tracts from the American Community Survey (ACS) 2008–2012 [17]. Patient home addresses were used to identify longitude and latitude (X, Y) coordinates. The resulting points were overlaid to existing polygons describing the Census Tracts using ArcGIS (version 10.2.2 ESRI, Redlands CA). SAS Data Management Studio was used to USPS verify and standardize each patient address, and then geocode the standardized patient addresses at the rooftop/street level of geography, using USPS and TomTom/TeleAtlas. Arc-GIS was used to calculate Euclidean distance (in miles) between case addresses and environ-mental and geographic variables, as defined by ESRI infrastructure features and MAPINFO Business Points and categorized by standard industrial classification codes (SICCODE) (http://siccode.com/). Environmental variables of interest included proximity to livestock farms, agriculture services, mining services, meat processing facilities, wood mills, sewage treatment facilities, grocery stores, day care facilities, health service facilities such as skilled nursing facilities, hospitals, and dialysis centers, and natural waterways (e.g., rivers, streams, creeks, lakes). SICCODEs used in this study correspond to designations for addresses during 2014
Disease burden within census tracts was initially computed by calculating a rate of cases per thousand per census tract. These unstandardized ratios were then adjusted by age, race, and sex.
Spatial statistics methods
determine the likelihood that the data configurations were random [18]. The null hypothesis
that the geographic distributions of cases were random was rejected if p<0.05. Because patient
addresses may indicate clusters due to the tendency of groups with similar risk factors or demographic factors to reside together, the testing of rates was adjusted by age, race, and sex with exact 95% confidence limits to identify correlated clusters of incidence rates. Similarly, we specifically assessed population density to ensure that clusters were not simply reflective of high population density. We also conducted additional tests of temperatures and their monthly average, seasonal average, and variations over time according to geographical location to assess for potential alternative clustered distributions and time-related peaks of CA-CDI. We assessed differences in demographic data between clustered patients and not clustered patients using standard descriptive statistical tests.
Definitions
Patients and census tracts with Getis-Ord z-scores of1.96 were defined as “clustered;” those
with z-scores<1.96 were considered “not clustered”. For the purpose of our analyses, the
seven census-based age-groups were collapsed into three categories:<29 years, 30–59 years,
60 years or older. Population densities were calculated for census tracts and categorized as
“low” (1,729 persons per square mile), “medium” (1,730 to 2,454) and “high” (2,455).
Defi-nitions of poverty were categorized by Census Tract areas; “low” poverty was defined as 15.6% or less of the population living with an income below the poverty line, “medium” poverty
defined as 15.7% to 23.9%, and “high” poverty defined as24% [17].
Mixed hierarchical model
We constructed a mixed hierarchical model to identify variables independently associated with increased rates of CA-CDI, including distance from important environmental locations. We chose this approach to maximize mixed models’ ability to handle heterogeneous variations associated with spatial heterogeneity and “nuisance” or extra-Poisson variation, which violate the assumption of independence of observations required in standard models. In addition, multilevel mixed models accommodate large numbers of random effects simultaneously with large numbers of fixed effects by evaluating variability as fixed effects at the first level and including random intercepts of individual patients at a second level.
We used the SAS HPMIXED procedure (SAS v9.2, Cary, NC) to create a hierarchical model with multilevel, nested, and spatially clustered observations. Our models included three hierarchical levels: county, census tract, and individual (case patient). More specifi-cally, our modeling approach incorporated polygonal spatial locations (census tracts); individuals were treated as random effects in this model. In contrast, age, sex, race, socioeco-nomic status, population density, and distance variables were treated as fixed effects.
Aver-age monthly temperature and date ofC.difficiletest were included to determine if temporal
or seasonal trends in CA-CDI incidence were present during the study period. The covari-ates of the fixed part of the model were tested with Pearson Correlation Coefficients to assess potential collinearity between covariates. Interaction terms between poverty and race as well as population density and patient clusters were evaluated and included in the initial, full model as well.
Results
A total of 8,813 unique patients had a positive test forC.difficileduring the study period; 2,906
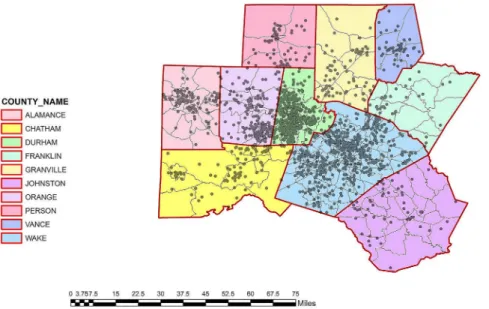
patients (33%) met our criteria for CA-CDI, and 1,895 patients with CA-CDI had addresses in the 10-county catchment area for the study hospitals (Fig 1). The mean patient age of our cohort was 54.5; 62% were female and 70% were Caucasian. The population of the 10 study counties was approximately 1.94 million; 1.2 million were located in the two largest population centers: Wake County (Raleigh) and Durham County (Durham).
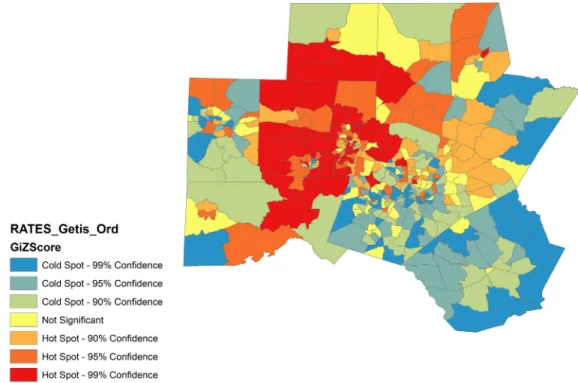
A total of 402 (21%) patient addresses were located in “hot spots” or clusters of CA-CDI
(Getis-Ord p<0.001). Rates of CA-CDI per census tract were also clustered (Getis Ord
p<0.001). “Hot spot” census tracts were scattered throughout the 10 counties (Fig 2). Patients
with CA-CDI in these clusters were more likely to be Caucasian, younger, and more likely to live in areas of medium or high poverty than patients not residing in clusters (Table 1). Fur-thermore, CA-CDI “hot spots” were more common in areas of medium population density and areas of medium poverty.
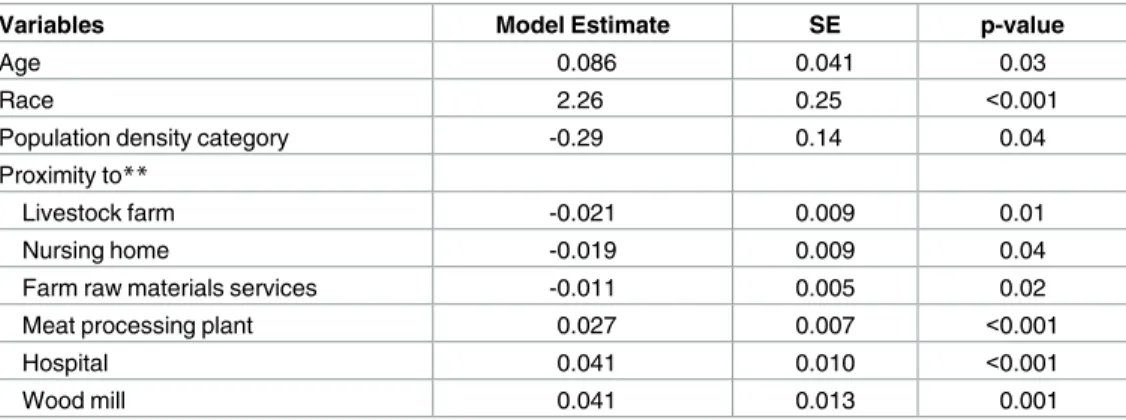
After adjusting for clustering and population density, two patient-specific variables were
independently associated with increased rates of CA-CDI: age60 years and race. Several
environmental variables were associated with rates of CA-CDI. Increasing proximity to a live-stock farm, increasing proximity to farming raw materials services, and increasing proximity to a nursing home were associated with increasing rates of CA-CDI (Table 2). In addition, increasing distances from meat processing plants, hospitals, and wood mills were each inde-pendently associated with increased rates of CA-CDI in our exploratory model. No linear tem-poral or seasonal/temperature trends in rates were observed in our models.
Discussion
Our large, multicenter study is the first to use GIS and spatial statistics to identify both specific
geographic clusters and novel environmental risk factors forC.difficileinfection (CDI)
Fig 1. Case location of 1,895 cases of community-associated Clostridium difficile infection in the 10-county study area in central North Carolina.*Census tract size is inversely proportional to population density. Grey dots represent individual cases. North is oriented to the top of the page. MAP SOURCE: Map created using ArcGIS software by Esri using TeleAtlas and US Census data sources.
Fig 2. “Hot spots” or clusters of community-acquired CDI in a 10-county area in central North Carolina. North is oriented to the top of the page. MAP SOURCE: Map created using ArcGIS software by Esri using TeleAtlas and US Census data sources.
https://doi.org/10.1371/journal.pone.0176285.g002
Table 1. Comparison of patients with community-acquired C. difficile infection (CA-CDI) in clusters or “hot spots” of infection versus patients with CA-CDI not located in clusters or hot spots.
Overall N = 1895
n (%)*
Clustered N = 402
n (%)*
Not Clustered N = 1493
n (%)*
p-value
Age—mean±SD 54.5±21.7 52.8±24.2 54.9±23.5 0.05
29 years 310 (16) 77 (19) 233 (16)
30 to 59 years 689 (36) 147 (37) 542 (36)
60 years 896 (47) 178 (44) 718 (48)
Female sex 1183 (62) 246 (61) 937 (63) 0.61
Race 0.001
Caucasian 1329 (70) 305 (76) 1024 (69)
African American 430 (23) 64 (16) 366 (25)
Other 136 (7) 33 (8) 103 (7)
Population density 0.02
High 282 (15) 53 (14) 229 (15)
Medium 390 (21) 102 (25) 288 (19)
Low 1223 (65) 247 (61) 976 (65)
Socioeconomic status 0.04
High poverty 301 (16) 68 (17) 233 (16)
Medium poverty 382 (20) 97 (24) 285 (19)
Low poverty 1212 (64) 237 (60) 975 (65)
*percentages may not add up 100 due to rounding
acquired in the community. Proximity to livestock farms and proximity to facilities that handle raw farming materials were independently associated with increasing rates of CA-CDI. Our model also supports findings from prior studies by showing that age greater than 60 years and nursing homes were independently associated with increased rates of CA-CDI [19].
Additional studies are needed to understand why proximity to farms and farming services are associated with increased rates of CA-CDI. The prevailing model for the pathogenesis of CDI requires a perturbation of the gut flora (e.g., medication or procedure) and exposure to/
acquisition ofC.difficile[20]. Prior studies of the risk factors for CA-CDI have primarily
focused on the factors that alter gut flora and render patients susceptible, including antimicro-bial therapy and exposure to proton pump inhibitors [21–23]. In contrast, few studies have
investigated community reservoirs for exposure to and acquisition ofC.difficile. These studies
have identified exposure to household contacts withC.difficile[24] and exposure to children
less than one1 year of age in the household as risk factors for CA-CDI [8,25]. Other
investiga-tors have identifiedC.difficilein retail food, livestock, domestic animals, and wild animals
[26–31], but no prior studies have demonstrated that proximity to or interaction with these potential animal reservoirs is a risk for subsequent human infection.
Despite John Snow’s original use of geographic mapping to identify an important source for an infectious disease over 150 years ago, the strategy has infrequently been employed to investigate environmental risk factors and healthcare-associated and/or multidrug-resistant pathogens. GIS and spatial statistics were recently used to evaluate risk factors for MRSA infec-tion among 867,254 people in a three-borough catchment area in London [32]. The risk of CA-MRSA was increased in areas with important socioeconomic factors such as overcrowd-ing, homelessness, low income, and recent immigration. Geographic areas adjacent to these high-risk areas were also at increased risk, confirming the impact of geographic proximity to high risk areas. To our knowledge, however, no prior studies have used GIS and spatial Table 2. Fixed effects variables in the final, reduced hierarchical model*to determine factors inde-pendently associated with community-associated Clostridium difficile infection (CA-CDI).
Variables Model Estimate SE p-value
Age 0.086 0.041 0.03
Race 2.26 0.25 <0.001
Population density category -0.29 0.14 0.04
Proximity to**
Livestock farm -0.021 0.009 0.01
Nursing home -0.019 0.009 0.04
Farm raw materials services -0.011 0.005 0.02
Meat processing plant 0.027 0.007 <0.001
Hospital 0.041 0.010 <0.001
Wood mill 0.041 0.013 0.001
*Model controlled for potential confounding from socioeconomic status, proximity to mining, and interactions between a) socioeconomic status and race and b) cluster and population density. Wood mill was included in the analysis for check for model validity. Wood mill and farming locations serve as inverse geographic variables. That is, locations close to farming locations are further away from wood mill locations and vice-versa. As expected, proximity to wood mill was significant, but inverse to the relationship observed for livestock farm.
**Proximity variables based on SICCODES, negative values for estimates implies correlation with smaller values (i.e., closer proximity to the environmental location).
SE—Standard Error
statistics to investigate risk factors forC.difficileacquisition and infection in the community. Chitnis et al. recently summarized 984 patients with CA-CDI identified through the CDC’s Emerging Infection Program. Similar to our study, the median age of patients in this cohort was 51 and the majority were female [8]. A total of 345 (36%) patients had no antibiotic expo-sure and 177 (18%) had no known healthcare expoexpo-sure. Occupational expoexpo-sure to animals was not found to be a risk factor for CA-CDI, though only 22 (2%) patients had this exposure in the entire cohort. Other environmental or geographic factors were not evaluated in this investigation.
Proximity to farms has also previously been show to put patients at risk for acquisition of other multidrug-resistant organisms such as MRSA [33–35]. This increased risk in populations that live close to livestock operations and farms may be related to practices used in modern farming, including the application of swine manure to fields. Aerosolized MRSA isolates gen-erated on farms can be identified in the air up to 150m downwind and in the soil up to 300m
downwind [36,37]. In fact, proximity to farms that apply swine manure to crop fields and
live-stock operations is associated with a 1.4-fold increase in CA-MRSA infection, a 1.3-fold increase in HA-MRSA, and a 1.4-fold increase in skin and soft tissue infection [11]. Of note, this exposure also led to a 30% increase in risk of HA-MRSA, implying that patients exposed to MRSA from farm practices can import MRSA into hospitals.
By our review, proximity to livestock farms has not previously been described as a risk fac-tor for CDI. We believe this association is plausible. Multiple studies have documented the
presence ofC.difficilein the farm environment and farm workers, and identified common
C.difficilestrains and clones in both livestock and humans. First, 80% of the antimicrobials
used in the US are used in livestock [38], which likely increases selection forC.difficile. Second,
pathogenicC.difficileisolates, most notably ribotypes 078 and 027, have been isolated on
farms and from farm animals such as pigs. For example, Hopman et al. evaluated 71 newborn
piglets and observed that they were routinely colonized withC.difficileribotype 078 within 48
hours of birth. This strain ofC.difficilewas also cultured from soil and air samples from pig
farms; 20 of 21 isolates evaluated were clonal by multiple locus variable number tandem repeat analysis (MLVA) [39]. Ribotype 078 is the most common circulating strain among both pigs and humans in Spain [40], and the third most common strain in humans in Europe [41].
Kees-sen et al investigated 32 hog farms in the Netherlands and identifiedC.difficileribotype 078 in
pig manure in all farms [12]. Humans were exposed to and colonized by the same strains as the pigs in this study; more specifically, 25% of people with direct interaction with pigs on the
farms hadC.difficilecolonization of stool. Pig and humanC.difficileisolates were identical by
MLVA in 13 of 15 farms evaluated. These studies, however, did not evaluate for CA-CDI in the general population living near these farms.
Our study has limitations. First, this analysis was performed as a hypothesis-generating exercise that needs further validation. Though plausible, our findings are inferential and do not demonstrate clear causality. Second, our dataset did not include specific information regarding long term care facility (LTCF)-associated CDI. However, our final model found risk factors independently associated with increasing rates of CA-CDI despite including proximity to nursing home, which we believe should adequately account for LTCF-associated CDI.
Third, all hospitals transitioned to more sensitive PCR testing forC.difficileduring the study
the type of farm but the practices performed at the farm (e.g., spraying of manure). Next, our models were built on assumptions such as a stable census (measured in 2010) and stable SIC-CODEs. In reality, we suspect that population changes occurred and businesses changed dur-ing the seven-year study period. We believe the error introduced by these changes, however, would be random error and, thus, believe that the use of these assumptions in our model was reasonable. In addition, we did not check residual spatial variation in our regression residuals. Finally, our analysis included only limited patient-specific variables and did not include antibi-otic exposure for the patient cohort. However, the risk factors that we identified in our analysis
may reflect potential risk factors forC.difficileexposure and acquisition, rather than risk
fac-tors for perturbation of colonic flora.
In summary, our study is the first to use GIS, spatial statistics, and mixed models to
investi-gate potential environmental risk factors for acquisition ofC.difficile. Using this novel
approach, we found that proximity to livestock farms, proximity to facilities that handle raw farming materials, age, and nursing homes were risk factors for CA-CDI. Our data adds to the growing evidence that farms and farming practices, such as regular use of antibiotics in live-stock and use of manure, may increase the risk of disease among people living near these facili-ties. Subsequent molecular studies will be required to more definitively demonstrate causality. Further investigation and confirmation, however, is important, as increasing rates of CA-CDI have direct impact on the spread of CDI within hospitals [42]. In light of increasing informa-tion suggesting that CDI spread in the hospital originates from community reservoirs [43], more studies like ours are needed.
APPENDIX 1. Detailed hierarchical model
Variables and variable definitions
Subscripts:kthobservation fromjthpatient in theitharea (polygons, catchment areas)
Fixed effects variables
Yijk¼ mþ b1ðGetOrdijkÞ þ b2ðSTD COUNTYijkÞ þ b3ðagecat2ijkÞ þ b4ðrace4ijkÞþ
b5ðpctpovcatijkÞ þ b6ðpopdenscatijkÞþ
b7ðlivestock farmijkÞ þ b8ðminingijkÞ þ b9ðmeat processingijkÞþ
b10ðwood millsijkÞ þ b11ðfarm raw materialsijkÞ þ b12ðnursing homeijkÞþ
b13ðhospitalijkÞ þ b4ðrace4ijkÞb5ðpctpovcatijkÞ þ b1ðGetOrdijkÞ
b
6ðpopdenscatijkÞ þ
ajðPatientÞ þ bij þ eijk
μ = Intercept, Overall mean
β1= GetOrd (Hot-spot indicator, 1 = clustered 0 = not clustered)
β2= Counties (catchment area counties 1, 2, 3. . .8, 9, 10)
β3= Age categories
β4= Race categories (“Whites”, “Blacks/African-American”, “Other”)
β5= Poverty in percentages of individuals living below poverty line (“high”, “medium”,
“low”)
β6= Population density in number of persons per Square Miles (“high”, “medium”, “low”)
β7= Livestock farm distance from patient address in Square miles
β8= Mining site distance from patient address in Square miles
β9= Meat processing plants distance from patient address in Square miles
β11= Farm raw materials processing site distance from patient address in Square miles
β12= Nursing-home facility distance from patient address in Square miles
β13= Hospital distance from patient address in Square miles
β4(race4ijk)β5(pctpovcatijk) = Interactions of race by poverty
β1(GetOrdijk)β6(popdenscatijk) = Interactions of hot-spots by population density
aj= Patients (Random intercepts)
bij= Patients nested to catchment areas
eijk= Random residual
Supporting information
S1 File. Image copyright information. Copyright details and information regarding Figs1
and2.
(PDF)
Acknowledgments
Address mapping data were obtained from the Decision Support Repository (DSR) in the Duke University Health System, in which all patient address records are automatically verified, standardized, geocoded, and enriched with socio-geographic information in support of research and real-time visual analytics.
The content is solely the responsibility of the authors and does not necessarily represent the official views of the CDC.
Author Contributions
Conceptualization: DJA DJS LFR.
Data curation: DJA LFR SP.
Formal analysis: DJA LFR.
Funding acquisition: DJS.
Investigation: SW LPK SSL RWM EESB DJW LFC.
Methodology: DJS LFR SW LPK SP.
Project administration: SW LPK.
Resources: DJS.
Software: LFR SP.
Supervision: DJA DJS.
Validation: DJA SW LPK.
Visualization: DJA LFR SW LPK SP SSL RWM EESB DJW LFC DJS.
Writing – original draft: DJA.
References
1. Kwon JH, Olsen MA, Dubberke ER. The morbidity, mortality, and costs associated with Clostridium diffi-cile infection. Infectious disease clinics of North America. 2015; 29(1):123–34. Epub 2015/02/14. https://doi.org/10.1016/j.idc.2014.11.003PMID:25677706
2. Miller BA, Chen LF, Sexton DJ, Anderson DJ. Comparison of the burdens of hospital-onset, healthcare facility-associated Clostridium difficile Infection and of healthcare-associated infection due to methicil-lin-resistant Staphylococcus aureus in community hospitals. Infect Control Hosp Epidemiol. 2011; 32 (4):387–90. Epub 2011/04/05.https://doi.org/10.1086/659156PMID:21460491
3. Hall AJ, Curns AT, McDonald LC, Parashar UD, Lopman BA. The roles of Clostridium difficile and noro-virus among gastroenteritis-associated deaths in the United States, 1999–2007. Clin Infect Dis. 2012; 55(2):216–23. Epub 2012/04/12.https://doi.org/10.1093/cid/cis386PMID:22491338
4. Lessa FC, Mu Y, Bamberg WM, Beldavs ZG, Dumyati GK, Dunn JR, et al. Burden of Clostridium difficile infection in the United States. The New England journal of medicine. 2015; 372(9):825–34.https://doi. org/10.1056/NEJMoa1408913PMID:25714160
5. Centers for Disease Control and Prevention. Antibiotic Resistance Threats in the United States, 20132013 09/18/2013.http://www.cdc.gov/drugresistance/threat-report-2013/.
6. Vital signs: preventing Clostridium difficile infections. MMWR Morbidity and mortality weekly report. 2012; 61(9):157–62. Epub 2012/03/09. PMID:22398844
7. Khanna S, Pardi DS, Aronson SL, Kammer PP, Orenstein R, St Sauver JL, et al. The epidemiology of community-acquired Clostridium difficile infection: a population-based study. The American journal of gastroenterology. 2012; 107(1):89–95. Epub 2011/11/24.https://doi.org/10.1038/ajg.2011.398PMID: 22108454
8. Chitnis AS, Holzbauer SM, Belflower RM, Winston LG, Bamberg WM, Lyons C, et al. Epidemiology of community-associated Clostridium difficile infection, 2009 through 2011. JAMA internal medicine. 2013; 173(14):1359–67. Epub 2013/06/20.https://doi.org/10.1001/jamainternmed.2013.7056PMID: 23780507
9. Naggie S, Miller BA, Zuzak KB, Pence BW, Mayo AJ, Nicholson BP, et al. A case-control study of com-munity-associated Clostridium difficile infection: no role for proton pump inhibitors. The American jour-nal of medicine. 2011; 124(3):276.e1–7. Epub 2011/03/15.https://doi.org/10.1016/j.amjmed.2010.10. 013PMID:21396512
10. Dubberke ER, Yan Y, Reske KA, Butler AM, Doherty J, Pham V, et al. Development and validation of a Clostridium difficile infection risk prediction model. Infect Control Hosp Epidemiol. 2011; 32(4):360–6. Epub 2011/04/05.https://doi.org/10.1086/658944PMID:21460487
11. Casey JA, Curriero FC, Cosgrove SE, Nachman KE, Schwartz BS. High-density livestock operations, crop field application of manure, and risk of community-associated methicillin-resistant Staphylococcus aureus infection in Pennsylvania. JAMA internal medicine. 2013; 173(21):1980–90. Epub 2013/09/18. https://doi.org/10.1001/jamainternmed.2013.10408PMID:24043228
12. Keessen EC, Harmanus C, Dohmen W, Kuijper EJ, Lipman LJ. Clostridium difficile infection associated with pig farms. Emerging infectious diseases. 2013; 19(6):1032–4. Epub 2013/06/06.https://doi.org/10. 3201/eid1906.121645PMID:23735347
13. Anderson DJ, Miller BA, Chen LF, Adcock LH, Cook E, Cromer AL, et al. The network approach for pre-vention of healthcare-associated infections: long-term effect of participation in the Duke Infection Con-trol Outreach Network. Infect ConCon-trol Hosp Epidemiol. 2011; 32(4):315–22. Epub 2011/04/05.https:// doi.org/10.1086/658940PMID:21460482
14. Multidrug-Resistant Organism & Clostridium difficile Infection (MDRO/CDI) Module. Centers for Dis-ease Control and Prevention website.http://www.cdc.gov/nhsn/PDFs/pscManual/12pscMDRO_ CDADcurrent.pdf. Published January 2014. Accessed March 1, 2016.
15. US Census Bureau. The Data Web—DataFerrett 2016 [http://dataferrett.census.gov.
16. US Census Bureau. United States Census Bureau Census Tracts 2013 [http://www2.census.gov/geo/ tiger/TIGER_DP/2013ACSI
17. US Census Bureau. American Community Survey 2014 [http://factfinder.census.gov/faces/nav/jsf/ pages/searchresults.xhtml?refresh=t.
18. Getis A, Ord JK. The analysis of spatial association by use of distance statistics. Geographical Analysis. 1992; 24:189–206.
19. Centers for Disease Control and Prevention. Vital signs: preventing Clostridium difficile infections. MMWR Morbidity and mortality weekly report. 2012; 61(9):157–62. PMID:22398844
21. Kutty PK, Woods CW, Sena AC, Benoit SR, Naggie S, Frederick J, et al. Risk factors for and estimated incidence of community-associated Clostridium difficile infection, North Carolina, USA. Emerging infec-tious diseases. 2010; 16(2):197–204.https://doi.org/10.3201/eid1602.090953PMID:20113547 22. Kuntz JL, Chrischilles EA, Pendergast JF, Herwaldt LA, Polgreen PM. Incidence of and risk factors for
community-associated Clostridium difficile infection: a nested case-control study. BMC infectious dis-eases. 2011; 11:194.https://doi.org/10.1186/1471-2334-11-194PMID:21762504
23. Dial S, Delaney JA, Barkun AN, Suissa S. Use of gastric acid-suppressive agents and the risk of com-munity-acquired Clostridium difficile-associated disease. Jama. 2005; 294(23):2989–95.https://doi.org/ 10.1001/jama.294.23.2989PMID:16414946
24. Pepin J, Gonzales M, Valiquette L. Risk of secondary cases of Clostridium difficile infection among household contacts of index cases. The Journal of infection. 2012; 64(4):387–90.https://doi.org/10. 1016/j.jinf.2011.12.011PMID:22227466
25. Wilcox MH, Mooney L, Bendall R, Settle CD, Fawley WN. A case-control study of community-associ-ated Clostridium difficile infection. The Journal of antimicrobial chemotherapy. 2008; 62(2):388–96. https://doi.org/10.1093/jac/dkn163PMID:18434341
26. Zidaric V, Zemljic M, Janezic S, Kocuvan A, Rupnik M. High diversity of Clostridium difficile genotypes isolated from a single poultry farm producing replacement laying hens. Anaerobe. 2008; 14(6):325–7. https://doi.org/10.1016/j.anaerobe.2008.10.001PMID:19022388
27. Rodriguez-Palacios A, Staempfli HR, Duffield T, Weese JS. Clostridium difficile in retail ground meat, Canada. Emerging infectious diseases. 2007; 13(3):485–7.https://doi.org/10.3201/eid1303.060988 PMID:17552108
28. Rodriguez-Palacios A, Stampfli HR, Duffield T, Peregrine AS, Trotz-Williams LA, Arroyo LG, et al. Clos-tridium difficile PCR ribotypes in calves, Canada. Emerging infectious diseases. 2006; 12(11):1730–6. 29. Weese JS. Clostridium difficile in food—innocent bystander or serious threat? Clin Microbiol Infect.
2010; 16(1):3–10.https://doi.org/10.1111/j.1469-0691.2009.03108.xPMID:20002685
30. Bondo KJ, Weese JS, Rouseau J, Jardine CM. Longitudinal study of Clostridium difficile shedding in raccoons on swine farms and conservation areas in Ontario, Canada. BMC Vet Res. 2015; 11:254. https://doi.org/10.1186/s12917-015-0563-xPMID:26446591
31. Schneeberg A, Rupnik M, Neubauer H, Seyboldt C. Prevalence and distribution of Clostridium difficile PCR ribotypes in cats and dogs from animal shelters in Thuringia, Germany. Anaerobe. 2012; 18 (5):484–8.https://doi.org/10.1016/j.anaerobe.2012.08.002PMID:22951303
32. Tosas Auguet O, Betley JR, Stabler RA, Patel A, Ioannou A, Marbach H, et al. Evidence for Community Transmission of Community-Associated but Not Health-Care-Associated Methicillin-Resistant Staphy-lococcus Aureus Strains Linked to Social and Material Deprivation: Spatial Analysis of Cross-sectional Data. PLoS medicine. 2016; 13(1):e1001944.https://doi.org/10.1371/journal.pmed.1001944PMID: 26812054
33. Carrel M, Schweizer ML, Sarrazin MV, Smith TC, Perencevich EN. Residential proximity to large num-bers of swine in feeding operations is associated with increased risk of methicillin-resistant Staphylococ-cus aureus colonization at time of hospital admission in rural Iowa veterans. Infect Control Hosp Epidemiol. 2014; 35(2):190–3.https://doi.org/10.1086/674860PMID:24442084
34. Feingold BJ, Silbergeld EK, Curriero FC, van Cleef BA, Heck ME, Kluytmans JA. Livestock density as risk factor for livestock-associated methicillin-resistant Staphylococcus aureus, the Netherlands. Emerging infectious diseases. 2012; 18(11):1841–9.https://doi.org/10.3201/eid1811.111850PMID: 23092646
35. Schinasi L, Wing S, Augustino KL, Ramsey KM, Nobles DL, Richardson DB, et al. A case control study of environmental and occupational exposures associated with methicillin resistant Staphylococcus aureus nasal carriage in patients admitted to a rural tertiary care hospital in a high density swine region. Environ Health. 2014; 13(1):54.https://doi.org/10.1186/1476-069X-13-54PMID:24958086
36. Gibbs SG, Green CF, Tarwater PM, Mota LC, Mena KD, Scarpino PV. Isolation of antibiotic-resistant bacteria from the air plume downwind of a swine confined or concentrated animal feeding operation. Environ Health Perspect. 2006; 114(7):1032–7.https://doi.org/10.1289/ehp.8910PMID:16835055 37. Schulz J, Friese A, Klees S, Tenhagen BA, Fetsch A, Rosler U, et al. Longitudinal study of the
contami-nation of air and of soil surfaces in the vicinity of pig barns by livestock-associated methicillin-resistant Staphylococcus aureus. Applied and environmental microbiology. 2012; 78(16):5666–71.https://doi. org/10.1128/AEM.00550-12PMID:22685139
39. Hopman NE, Keessen EC, Harmanus C, Sanders IM, van Leengoed LA, Kuijper EJ, et al. Acquisition of Clostridium difficile by piglets. Vet Microbiol. 2011; 149(1–2):186–92.https://doi.org/10.1016/j.vetmic. 2010.10.013PMID:21111541
40. Pelaez T, Alcala L, Blanco JL, Alvarez-Perez S, Marin M, Martin-Lopez A, et al. Characterization of swine isolates of Clostridium difficile in Spain: a potential source of epidemic multidrug resistant strains? Anaerobe. 2013; 22:45–9.https://doi.org/10.1016/j.anaerobe.2013.05.009PMID:23764416
41. Bauer MP, Notermans DW, van Benthem BH, Brazier JS, Wilcox MH, Rupnik M, et al. Clostridium diffi-cile infection in Europe: a hospital-based survey. Lancet. 2011; 377(9759):63–73.https://doi.org/10. 1016/S0140-6736(10)61266-4PMID:21084111
42. Tabak YP, Johannes RS, Sun X, Nunez CM, McDonald LC. Predicting the risk for hospital-onset Clos-tridium difficile infection (HO-CDI) at the time of inpatient admission: HO-CDI risk score. Infect Control Hosp Epidemiol. 2015; 36(6):695–701.https://doi.org/10.1017/ice.2015.37PMID:25753106 43. Eyre DW, Cule ML, Wilson DJ, Griffiths D, Vaughan A, O’Connor L, et al. Diverse sources of C. difficile