AN EXPOSURE STUDY LINKING ENVIRONMENTAL AND HUMAN BIOLOGICAL PARAMETER MEASUREMENTS, WITH A FOCUS ON TH1/TH2 CYTOKINE
EXPRESSION
Matthew Alexander Stiegel
A dissertation submitted to the faculty at the University of North Carolina at Chapel Hill in partial fulfillment of the requirement for the degree of Doctor of Philosophy in the Department
of Environmental Sciences and Engineering in the Gillings School of Global Public Health.
Chapel Hill 2014
©2014
ABSTRACT
Matthew Alexander Stiegel: An Exposure Study Linking Environmental and Human Biological Parameter Measurements, with a Focus on Th1/Th2 Cytokine Expression
(Under the direction of Michael R. Flynn and Joachim D. Pleil)
Diesel exhaust (DE) and ozone (O3) inhalation exposures are both recognized for
creating, or exacerbating, cardiopulmonary health effects in humans. The U.S. Environmental Protection Agency (EPA) has regulations described in the National Ambient Air Quality Standards (NAAQS) that establish ambient standards for O3 and for some of the constituents of
DE, including particulate matter, carbon monoxide, nitrogen oxides and sulfur oxides, but there are no regulations that include all components of DE emissions. While there is scientific
evidence for exposure-related health effects from DE and O3 separately, there is little research
investigating co-exposures to these two pollutants. To address this data gap, this dissertation explores the human inflammatory response as an early indicator for exposures sufficient for activating the immune system with a series of highly-controlled environmental chamber studies.
Healthy human subjects were exposed to clean filtered air, DE, O3, and DE+O3 at typical
DE-only and O3-DE-only exposures, and a synergistic relationship was found as a suppression (lasting as long as 22 hrs) of IL-5, IL-12p70, IFN-γ, and TNF-α after DE + O3 co-exposure. Varieties of
relationships were explored between subject meta-data and physiological (cardiopulmonary) observations, which demonstrated high exposure-response variability between individuals and that summary data can mask certain underlying relationships. The overall results suggest that O3
exposure is highly correlated with decreased pulmonary function, that Th1-mediated inflammation is a moderator between DE+O3 exposure and post-exposure blood pressure
ACKNOWLEDGEMENTS
I would like to express my deepest gratitude to Joachim Pleil for his advice and guidance during this journey. I have had the pleasure of many conversations that have inspired my
intellectual curiosity, with hopefully many more to come. I thank Mike Flynn for his time, help and encouragement, and knowing that he was always there when needed. Thanks to Mike Madden for the providing the opportunity to work on DEPOZ. To my committee members, for their helpful suggestions and for making sure I did not waver too far in the wrong direction. I thank Jon Sobus for the countless hours he spent helping with the many aspects of this process, and for always having a friendly chair in his office. I also like to thank all the people at the Environmental Protection Agency (EPA) that helped along the way, including: Myriam Media-Vera, Peter Egeghy, Andy Lindstrom, Mark Strynar, and Lisa Dailey.
To my family, I thank you for the endless encouragement. Tricia, I would have never made it without your love and support over the years. Finally, to my loving daughter, Elizabeth, for teaching me that eight hours of sleep is only a luxury.
PREFACE
TABLE OF CONTENTS
LIST OF TABLES ... xii
LIST OF FIGURES ... xiii
LIST OF ABBREVIATIONS AND SYMBOLS ... xiv
CHAPTERS 1. Introduction ...1
1.1 Overview ...1
1.2 Epidemiological and Controlled Exposure Evidence for Diesel Exhaust and Ozone Health Effects ...6
1.3 Inflammatory Cytokines and Health Effects ...7
1.4 Study Design ...10
1.5 Objectives ...12
2. Analysis of Inflammatory Cytokines in Human Blood, Breath Condensate, and Urine using a Multiplex Immunoassay Platform ...15
2.1 Introduction ...15
2.2 Methods...19
2.2.1 Sample Collection ...19
2.2.2 Analysis...20
2.2.3 Method Development ...21
2.2.4 Statistical Analysis ...22
2.2.4.1 Model Development...22
2.2.4.3 Correlations and Variance Estimates ...23
2.3 Results ...26
2.3.1 Objective 1-Detection of Cytokines in Three Biological Media ...26
2.3.2 Objective 2-Cytokine Methodological Parameters ...28
2.3.3 Objective 3-Study Sample Cytokine Measurement Distributions and Correlations ...31
2.4 Discussion ...37
2.4.1 Calibration...38
2.4.2 Sensitivity and Method Precision ...38
2.4.3 Study Sample Cytokine Measurement Distributions and Correlations ...39
2.5 Conclusions ...42
3. Diesel Exhaust and Ozone Inhalation Exposures affect Inflammatory Cytokine Levels and White Blood Cell Counts...43
3.1 Introduction ...43
3.2 Methods...48
3.2.1 Study Population ...48
3.2.2 Exposure Scenario: Highly-controlled Environmental Chamber ...48
3.2.3 Sample Collection and Analysis ...49
3.2.4 Statistical Analysis ...50
3.3 Results ...51
3.3.1 Descriptive Statistics for the Four Exposures ...51
3.3.2 Exposure Responses - Pre vs. Post vs. Follow-up ...55
3.3.4 Cellular Response and Correlations with Cytokines ...61
3.4 Discussion ...65
3.4.1 Pre, Post, and Follow-up Trends ...67
3.4.2 TNF-α ...68
3.4.3 White Blood Cells and Correlations ...70
3.5 Conclusions ...72
4. Co-exposure to Diesel and Ozone Modifies Inflammatory Cytokine Expression, Blood Pressure, and Lung Function ...74
4.1 Introduction ...74
4.2 Methods...76
4.2.1 Study Design ...76
4.2.2 Statistical Analysis ...77
4.3 Results ...78
4.3.1 Summary Statistics...78
4.3.2 Correlations ...82
4.3.3 Comparisons of Percent Change from Baseline ...87
4.4 Discussion ...90
4.5 Conclusions ...94
5. Concluding Remarks and Observations ...96
5.1 Cytokine Methods Development ...98
5.2 Inflammatory Response Following Diesel Exhaust and Ozone Exposures ...100
5.3 Correlations between Diesel and Ozone Co-exposure and Cardiovascular Health ...101
LIST OF TABLES
Table 2.1 - Comparison of the Percentage of Samples above the nominal
LLOQs between the Original Output and the “New” 5pl Model ...27
Table 2.2 - Estimated 95% Fold-Ranges (Y 0.95c) and Intraclass Correlation Coefficients ρ for repeated measures of spiked calibration samples ...29
Table 2.3 - Descriptive Statistics and Estimated Fold-Ranges for Duplicate Samples ...30
Table 2.4 -Descriptive Statistics (pg/mL) for Cytokines in Plasma ...31
Table 2.5 -Descriptive Statistics (pg/mL) for Cytokines in Exhaled Breath Condensate ...31
Table 2.6 -Descriptive Statistics (pg/mL) for Cytokines in Urine ...32
Table 2.7 -Estimated Variance Components, Fold-ranges, and ICCs for the Study Samples ...34
Table 3.1 - Demographics of Study Participants for Selected Samples ...48
Table 3.2 - Descriptive Statistics by Exposure, for Plasma ...54
Table 3.3 - Cell Count Descriptive Statistics by Exposure and Sample Time ...62
Table 3.4 - Pre, Post, and Follow-up Statistical Comparisons by Exposure ...63
Table 4.1 - Demographics of Study Participants...76
Table 4.2 - Baseline and Post-Exposure Blood Pressure and Lung Function Measurements ...79
Table 4.3 - Summary of Statistically Significant Day 1 Pre-to-Post Exposure Results for Selected Cytokines ...81
Table 4.4 -Estimated Intraclass Correlation Coefficients ρ for the Four Exposures ...83
Table 4.5 - Individual Responses by Exposure in Comparison to the Clean Arm ...84
LIST OF FIGURES
Figure 1.1 - Ultra-fine Particulate Exposure and Causal Pathways for
Cardiovascular-related Health Effects ...8
Figure 2.1 - IL-8 Calibration Curve for Urine Displaying the Additional
Sample Concentrations Gained from using a 5pl Model ...28
Figure 2.2 - Cytokine Correlations (Spearman “Rho”) between Blood Plasma
and Exhaled Breath Condensate ...37
Figure 3.1 - Exposure Schedule for Volunteers ...49 Figure 3.2 - Heatmap of the Plasma Cytokine Levels for All Exposure
Treatments over a 24-hour Period...52
Figure 3.3 - Post/Pre Exposure Cytokine Concentration Ratios
for the Four Treatments ...55
Figure 3.4 -Follow-up/Pre Exposure Cytokine Concentration Ratios
for the Four Treatments ...56
Figure 3.5 - TNF-α Cytokine Results for Three Exposure Scenarios ...60 Figure 3.6 - Spearman Correlations for Pre, Post and 22-hour Post DE+O3
Co-Exposure Responses...64
Figure 4.1 - Post/Pre DE+O3 Exposure Ratios for Blood Pressure, FEV1, FVC,
and Th1/Th2 Inflammatory Cytokines...82
Figure 4.2 - Systolic Blood Pressure Post/Pre Exposure Ratio versus IL-8
Post/Pre Exposure Ratio for the DE+O3 Exposure ...86 Figure 4.3 - Systolic Blood Pressure Post/Pre Exposure Ratio versus IFN-γ
Post/Pre Exposure Ratio for the DE+O3 Exposure ...87 Figure 4.4 - Percent Change from “Pre” Measurement following O3 Exposure ...88 Figure 4.5 - Percent Change from “Pre” Measurement following DE+O3 Exposure ...89 Figure 5.1 – Differential Lung Function Results for Four Individual Participants Following
LIST OF ABBREVIATIONS AND SYMBOLS
Abs absolute
ADME absorption, distribution, metabolism, and excretion ANOVA analysis of variance
AOP adverse outcome pathway
b random effect
B biological media
BALF bronchoaveolar lavage fluid
BP blood pressure
BMI body mass index c concentration
oC degrees centigrade
CDC Centers for Disease Control and Prevention COPD chronic obstructive pulmonary disease CV coefficient of variation
CXCL2 chemokine ligand 2
DALYs disability-adjusted life years DBP diastolic blood pressure
DE diesel exhaust
DE+O3 diesel exhaust plus ozone
DEP diesel exhaust particulate
DEPOZ Cardiopulmonary Responses to Exposure to Ozone and Diesel Exhaust with Moderate Exercise in Healthy Adults
ε random-error effect EDTA Ethylenediaminetetraacetic acid
EPA Environmental Protection Agency EBC exhaled breath condensate
FEV1 forced exhaled volume in one second
FR fold-range
FVC forced vital capacity
GM geometric mean
GSD geometric standard deviation GSTM1 glutathione S-transferase mu 1
h biological measurement
Hg mercury (element)
HSF Human Studies Facility i plate
ICC intra-class correlation coefficient IFN-γ interferon gamma
IL-12p70 interleukin 12p70 IL-13 interleukin 13
IRB Institutional Review Board
ln natural logarithm
LOD limit of detection LOQ limit of quantitation L/min liters per minute
LLOQ lower limit of quantitation Lymph lymphocyte
MSD Mesoscale Discovery MTBE methyl tertiary butyl ether
mg milligram(s)
ml milliliter(s)
mm millimeter(s)
Mono monocyte
n number
NAAQS National Ambient Air Quality Standards
NIOSH National Institute of Occupational Safety and Health ng nanogram(s)
ng/ml nanogram per milliliter
NSAIDs non-steroidal anti-inflammatory drugs NO nitrogen oxide
NOx oxides of nitrogen
O3 ozone
PM particulate matter
PM2.5 particulate matter less than 2.5 microns diameter
PM10 particulate matter less than10 microns diameter
ppm parts per million pg picogram(s) pg/ml picogram per milliliter pg/m3 picogram per cubic meter
PMN polymorphonuclear neutrophils
Proc procedure
PGF2α Prostaglandin F2α
ρ rho
estimated intraclass correlation coefficient
0.95 estimated 95% fold-range
rpm rotations per minute SBP systolic blood pressure SD standard deviation SE standard error
SEM standard error of the mean SO2 sulfur dioxide
TCE trichloroethylene Th1 T helper cell 1 Th2 T helper cell 2
TNF-α tumor necrosis factor alpha TWA time weighted average UFP ultra-fine particulate
US United States
µ mean
µL microliter
μg/m3 microgram per cubic meter
µm microns
WBC white blood cells
CHAPTER 1
Introduction
1.1 Overview
The World Health Organization estimates that outdoor air pollution contributes to the deaths of 3.7 million people each year in the world, with approximately 40,600 deaths per year and 11.4 million disability-adjusted life years (DALYs) lost in the United States (US) due to asthma, cardiovascular disease, and chronic obstructive pulmonary disease (COPD) (CDC, 2002; CDC, 2011a and 2011b; WHO, 2009; WHO, 2014). In the US, the relative risk of death
attributable to outdoor air pollution exposures is comparatively low, but air pollution is usually concentrated in large urban areas with dense populations and thus the exposure potential to outdoor air pollution remains relatively high (Dockery et al., 1993; Ghio and Huang, 2004). Outdoor inhalation exposures to particulate matter (PM) and ozone (O3) are driving causes of
environmentally acquired disease and mortality (Bell et al., 2005; Dockery et al., 1993; Huang 2014; Jerrett et al., 2009; Knol et al., 2009). Acute PM exposures have been shown to
exacerbate existing asthmatic conditions and COPD and contribute to decreases in lung function (Huang and Ghio, 2009; Ghio and Huang, 2004; Lepeule et al., 2012; Pope and Dockery, 2006). Chronic exposures to PM have been shown to cause acute lower respiratory disease, ischemic heart disease, and lung cancer (Ghio and Huang, 2004; Montesano and Hall, 2001; Pope and Dockery, 2006). Long-term effects of O3 exposure have not been as extensively studied as PM,
emergency room admissions, respiratory morbidity and mortality (Alexeeff et al., 2008; Bell et al., 2004; Huang 2014; Jia et al., 2011; Samoli et al., 2009).
The United States Environmental Protection Agency (US EPA) has regulations in the National Ambient Air Quality Standards (NAAQS) for coarse (PM10) PM, fine (PM2.5) PM, and
ground level O3, which are designed to protect human health (Clean Air Act, 1963). The US
EPA estimates that 23% of PM2.5 in the US comes from diesel exhaust (DE) emissions; however,
there are no NAAQS for all of the components of DE (U.S. EPA, 2002). NAAQS does establish emission criteria for some of the constituents of DE, including particulate matter, carbon
monoxide, nitrogen oxides and sulfur oxides, but the mixture of components is not regulated. The US EPA does regulate in production diesel engine emissions related to PM and NOx (U.S. EPA, 1997). Current estimates show that there at least 26 million people in the US with asthma, 15 million with COPD, and approximately 24 million with impaired lung function (CDC, 2002; CDC, 2011a and 2011b;). Given a large population with diagnosed cardiovascular impairments as well as other susceptible sub-populations, and the potential for continued exposure-related health effects even with the current NAAQS, research into the underlying exposure-response biological mechanisms responsible for the initiation or progression of DE-related health effects is pertinent (Brook, 2008; Fariss et al., 2013; Huang, 2014; Kamal et al., 2009).
There is scientific evidence for exposure-related health effects from DE and O3, but there
is little research investigating co-exposure to these two pollutants. Investigating a DE+O3
co-exposure is potentially more important than a DE-only or O3-only exposure because an
silico computational methods, and cross-sectional or observational epidemiological studies. Each of these study designs has its respective benefits toward defining exposure and subsequent risk. Most often, the benefit is the ability to have high throughput risk analysis for as many chemicals as possible, which is often an area where the use of human test subjects is very
difficult and sometimes unethical. However, the main limitation for most of these study designs, particularly in vitro and non-human in vivo studies, is the ability to investigate individual
responses to an exposure. Nevertheless, the goal of each study type is to link the exposure source to an environmental measure, through the ADME (absorption, distribution, metabolism, and excretion) process, and to biologically relevant outcome parameter(s).
Assigning risk for a DE+O3 co-exposure involves the creation of a link from the exposure
to a health outcome with exposure, kinetic, or statistical models that assign exposure, dose, or biologically relevant dose. Measurements (i.e. empirical data) are needed to create and validate these models but the state of the science often lacks a clear link from an exposure source to a health outcome based on unambiguous empirical evidence. There are many difficulties in making said measurements, determining the degree to which a person has been exposed to a contaminant of concern, and then trying to link this exposure to a health outcome. Each
individual also has their own “exposome”, which is defined as the “representation of the totality of all exposures” that a person might receive in their lifetime and includes exposure to
socio-economic status, etc.). Given the obvious sources of variance that can contribute to differing biological responses, limiting potential exposure variance is the easiest way to examine how an individual will respond. As such, highly-controlled environmental exposure chambers are used as a potential solution, which creates a uniform exposure potential and thus exposure-response differences can be attributed to the individual. The present study uses a highly-controlled exposure scenario to investigate the relationship between DE, O3, and DE+O3 co-exposures and
the resulting responses in human volunteers.
Understanding the underlying biological exposure-response mechanisms following the exposure is also important because it can help to describe the biological pathway that contributes to adverse outcomes (Ankley et al., 2010; Vinken, 2013). Scientific evidence demonstrates that an inflammatory response by the immune system is one of the first biological responses
following exposure (Duramad et al., 2007; Elvidge et al., 2013; Goldsby et al., 2000; Hetland et al., 2004; Nakamura et al., 2014; Selgrade et al., 2006; Spatari et al., 2013;). A large diversity of immune system cells respond during an inflammatory reaction and cytokines are used as
communication vehicles between these cells. Research shows that inflammatory cytokines are associated with DE and O3 exposure-response mechanisms and independently with human
disease and health endpoints (Bosson et al., 2008; Chuang et al., 2007; De Prins et al., 2014; McCreanor et al., 2007; Mills et al., 2005; Villeneuve et al., 2011; Xu et al., 2013). However, the studies that have established the relationships between inflammatory cytokines and disease have usually focused on small and select representative populations that are already categorized as “unhealthy”. Given that there is scientific, biological linkage between inflammatory
The overall objective of this dissertation is to describe the relationships that DE, O3, and
DE+O3 exposures have with the human inflammatory pathway and resulting cardiopulmonary
health effects. Inflammation is used not only as a parameter to describe the exposure-response-health effect relationship, but also as a parameter that links the exposure to a biological pathway that is associated with disease. While the exposure levels in this study are not going to induce disease, studying the relationship between these exposures and potential preclinical health effects are essential for assigning associated risk, especially for identifying susceptible sub-populations. This research study is organized around three objectives:
1. Develop and optimize a human Th1/Th2 Cytokine 10-Plex immunoassay and then apply this method to generate measurement distributions of inflammatory proteins in a group of human cohorts.
2. Determine the difference in inflammatory cytokine expression for clean filtered air, DE (300 μg/m3), O3 (0.3 ppm), and a DE+O3 co-exposure under the following hypotheses:
a.There will be no change in the expression of the cytokines for the control (i.e. clean) exposure; however, there will be some statistically significant increases in the expression of the pro-inflammatory cytokines for the other three (DE, O3, and
DE+O3) exposures.
b.The anti-inflammatory cytokines will show no change in expression for any of the four treatments.
3. Determine whether inflammatory cytokine expression can be an indicator of a
cardiopulmonary health outcome following exposure to the DE, O3, or DE+O3 exposure
a. Inflammatory cytokines can be used as quantitative markers of inflammation and possible indicators of cardiopulmonary health effects.
b. The relationship among three exposures will demonstrate individual variance in responses for both the cytokines and the health outcomes.
1.2 Epidemiological and Controlled Exposure Evidence for Diesel Exhaust and Ozone Health Effects
Numerous epidemiological studies have shown that DE and O3 exposures are related to
cardiopulmonary health effects (Dong et al., 2013). The primary concern for DE exposure comes from the much-studied inhalation effects of PM2.5 or ultrafine PM (≤0.1μm) due to the
ability of the PM to deposit in the deep lung (Elvidge et al., 2013; Sydbom et al., 2001).
Dockery et al., 1993, in the Harvard Six Cities prospective cohort study, were one of the seminal groups that defined strong associations between fine particulate and increased mortality.
Nineteen years later, and after the establishment of more stringent PM regulations, Lepeule et al., 2012 showed a linear exposure-response relationship between increases in PM2.5 and increases in
cardiovascular and lung cancer mortality from additional years (2001-2009) of Harvard Six Cities data. Epidemiological studies for O3-related health effects from ambient exposures have
shown decreases in lung function, changes in heart rate variability, and vascular inflammation (Alexeeff et al., 2008; Bell et al., 2004; Jerrett et al., 2009; Jia et al., 2011).
2013). More recently, Morishita et al., 2014, showed an association between exposure to PM 2.5-10 and modifications in systolic blood pressure for healthy human volunteers following a
controlled exposure. Controlled O3 exposures with healthy human volunteers demonstrate health
effects similar to DE exposure with increases in pulmonary and vascular inflammation and decreases in lung function (Alexis et al., 2010; Devlin et al., 2012; Kim et al., 2011). Finally, Madden et al. 2014, showed decreases in lung function though a controlled O3 exposure, but no
health effects following controlled exposure to DE. This same study also established a
relationship between DE and O3 by using controlled DE+O3 co-exposures that demonstrated a
synergistic effect on lung function changes following the combined exposure versus individual exposure to DE or O3.
1.3 Inflammatory Cytokines and Health Effects
The biological mechanisms that create acute or chronic health effects following DE or O3
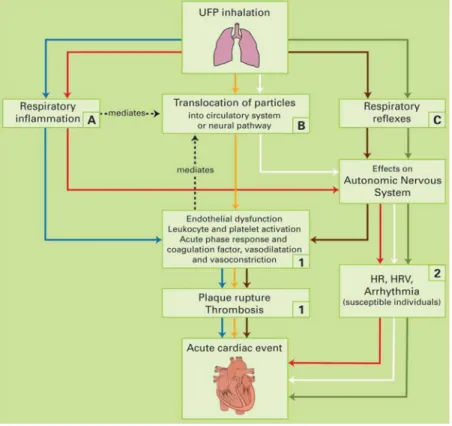
exposure are still not well understood; however, there are multiple hypotheses for the initiating mechanism that lead to downstream cardiopulmonary health effects. The majority of the DE exposure literature focuses on the particulate component of the exhaust as the initial stressor (Bosson et al., 2008; Holgate et al., 2003; Shan et al 2014; Törnqvist et al., 2007; Xu et al., 2013). Figure 1, below, describes the three most plausible mechanistic pathways for
Figure 1.1: Ultra-fine particulate exposure and causal pathways for cardiovascular-related health
effects*
*from Knol et al., 2009.
Inflammation is also the driving cause for O3-related cardiopulmonary health effects (Alexis et
al., 2010; Devlin et al., 2012; Koren et al., 1989; Tank et al., 2011). Given the potential for both DE and O3 to create an inflammatory reaction, investigating biomarkers related to inflammation
could elucidate the mechanistic pathway(s) that link said exposures to cardiovascular outcomes. Thus, we chose a select group of inflammatory proteins (cytokines) and examined their
expression and response as a mediator between the exposures and cardiopulmonary health outcomes.
(Chung and Barnes, 1999; Goldsby et al., 2000). Unlike hormones, which are loosely categorized into the other class of signaling molecules in the body and primarily work in an endocrine fashion, cytokines usually behave in a paracrine manner and are rarely stored, meaning that their expression is exclusively linked as a response to specific stimuli. The cytokines chosen for this study are responsible for initiating (IL-1β, IL-2, IL-8, IL-12p70, IFN- γ, and TNF- α) or suppressing (IL-4, IL-5, IL-10, IL-13) an inflammatory reaction, and primarily originate from T helper cell Type 1 (Th1), T helper cell Type 2 (Th2), and macrophages
(Boonpiyathad et al., 2013; Cannas et al., 2010, Chung and Barnes, 1999; Cousins et al., 2002; Elenkov and Chrousos, 1999; Goldsby et al., 2000; Sack et al., 2006).
Researchers have investigated the relationships between cytokine expression and DE or O3 exposures as well as cytokine expression and health effects, but these two research aims
(exposure to inflammation, inflammation to health effect) are often mutually exclusive of one another. There are no studies that investigate an inflammatory response following controlled DE+O3 exposure in humans. De Prins et al. 2014, demonstrated that black carbon (a component
of DE) exposure is associated with oxidative stress and increases in IL-1B. Holgate et al. 2003, demonstrated increased IL-8 concentrations following a controlled 2-hour DE chamber study. Törnqvist et al. 2007, found statistically significant increases in IL-6 and TNF-α after DE exposure. Finally, Xu et al. 2013, studied healthy volunteers exposed to DE and saw no change in inflammatory cytokines, but they did see a significant increase in peripheral blood monocyte and leukocyte counts.
There is also scientific evidence linking O3 exposure to changes in inflammatory
health human volunteers exposed to O3. Devlin et al. 2012, also showed statistically significant
increases in IL-1β, IL-8, TNF-α, and neutrophils in healthy human volunteers following O3
exposure. Schelegle et al. 1989, investigated acute ozone exposures (0.20ppm and 0.35ppm for 80 minutes) on O3-sensitive and non-sensitive human volunteers and found statistically
significant increases in Prostaglandin F2α(PGF2α) in the O3-sensitive cohort following exposure.
There is less chamber-based research investigating relationships between O3 exposure and
inflammation when compared to the DE exposure literature. However, the studies that do investigate O3 exposure are always near or below the NAAQS standard (0.075ppm, 8-hour
TWA) for O3 exposure, and they still demonstrate statistically significant exposure-response
inflammation in healthy humans.
1.4 Study Design
The data for this dissertation was derived from the “Cardiopulmonary Responses to Exposure to Ozone and Diesel Exhaust with Moderate Exercise in Healthy Adults” (DEPOZ) study at the U.S. EPA Human Studies Facility in Chapel Hill, NC. DEPOZ was a “proof of concept” random crossover double-blind exposure design that was used to investigate the
relationship between DE exposure, O3 exposure, a DE+O3 combination, inflammatory cytokines,
Fifteen participants were recruited for the study, with eligibility based on the following: 18-55 years old, nominally healthy, have to be able to exercise for four 15-minute increments on a recumbent bike at a target minute ventilation rate of 25 L/min*body surface area, non-smoking, and had to be willing to discontinue use of non-steroidal anti-inflammatory drugs (NSAIDs), vitamin C, and vitamin E. Further description of the protocol can be seen in Madden et al. 2014. Each participant was exposed in an environmentally controlled exposure chamber to clean
filtered air, DE (300 μg/m3), O3 (0.3 ppm), or a combination of DE and O3. The chosen exposure
concentrations for DE and O3 were based on ambient outdoor air concentrations, occupational
environmental exposure levels, and the demonstrated safety of these concentrations in healthy adults from prior studies. The environmental exposure order was random, meaning that the participant started the study in any of the four exposure arms, but the second day of exposure was always O3.
Five blood samples were collected per subject per exposure arm, in 10mL Vacutainer® (Becton, Dickinson and Company, Franklin Lakes, New Jersey) collection tubes containing EDTA. The tubes were centrifuged at ≥1300 RCF, and the separated blood fractions were aliquotted into individual 2mL polypropylene-vials (Corning Incorporated, Corning, NY), and then frozen at ≤-80°C until analysis.
Exhaled breath condensate samples were collected using a RTubeTM (Respiratory
placed in a polypropylene-vial (Corning Incorporated, Corning, NY), and then frozen at ≤80°C until analysis.
Consecutive urine voids were individually collected over a three-day period for each study participant in individual 1L high-density polyethylene containers (Chase Scientific Glass, Inc., Rockwood, TN). An 8mL-aliquot of each sample was transferred into a 10ml
polypropylene vial (Corning Incorporated, Corning, NY) and immediately frozen at ≤-20°C as they were received at the EPA Humans Studies Facility.
The primary health outcomes of interest to this study were inflammatory and
cardiopulmonary related. As such, for each 2-hour exposure period each participant had minute ventilation and portable spirometry before, during, and after the exposure period, which were then used to assess pulmonary function (e.g. Forced Exhaled Volume in 1 Second (FEV1) and
Forced Vital Capacity (FVC)). Participants also had blood pressure measurements taken before and after each exposure period.
Post-exposure processing of collected biological samples included analysis of the following: GSTM1 genotyping, total lymphocyte, monocyte, and neutrophil counts, and the Th1/Th2 cytokines (interleukins (1β, 2, 4, 5, 8, 10, 12p70 and 13), interferon gamma (IFN- γ), and tumor necrosis factor alpha (TNF-α)). The ten cytokines of interest to this study were analyzed using a Meso Scale Discovery (MSD, Gaithersburg, MD) Human Th1/Th2 10-plex Ultra-Sensitive electrochemiluminescent immunoassay and a MSD SECTOR Imager 2400.
1.5 Objectives
In summary, there is a wealth of evidence that demonstrates that DE and O3 exposures
Standards. Controlled chamber studies have demonstrated that DE and O3 create acute
cardiovascular effects in healthy human volunteers and that these effects might be related to an inflammatory response. The GSTM1- polymorphism has also been associated with sensitivity to O3 exposure and decreased lung function and the increased production of cytokines in response
to diesel particles instilled intranasally (Alexis et al., 2009; Gilliland et al., 2002; Gilliland et al., 2004; Yang et al., 2008). As such, examination of the exposure-response relationships by GSTM1 genotype as well as body mass index (BMI) and gender will help to elucidate potential differences in response following the respective exposures. The motivation for this research is to contribute to the knowledge gaps surrounding the relationship between exposures to DE and O3
and acute cardiovascular events, with inflammation as the mediator between the exposure and the health effects.
The research in this dissertation establishes a method for measuring 10 inflammatory cytokines in 3 different human-acquired biological media, which will help to explain the totality of the inflammatory exposure-response mechanism. The method is then applied to human
plasma samples from a highly-controlled chamber study to investigate individual and group-level responses from exposures to DE, O3, or a combination of DE+O3. Finally, this research
establishes correlations between the 3 exposure scenarios, inflammatory cytokines, blood pressure modifications, and lung function changes. Hopefully, this research will contribute to future DE and O3 risk analyses, by demonstrating that even in the best case scenario (i.e. healthy
young humans) there are notable health effects from these exposures that are driven by inflammation.
for investigating the inflammatory markers in exhaled breath condensate, plasma, and urine. Chapter 3 examines the relationship between the DE, O3, and DE+O3 exposures and the resulting
CHAPTER 2
Analysis of Inflammatory Cytokines in Human Blood, Breath Condensate, and Urine Using a Multiplex Immunoassay Platform
(Stiegel MA, Pleil JD, Sobus JR, Morgan MK, and Madden MC. Analysis of inflammatory cytokines in human blood, breath condensate, and urine using a multiplex immunoassay
platform. Biomarkers. 2014, in review.)
2.1 Introduction
Random intermittent environmental exposures or chronic low-level exposures can produce subtle biological responses in humans that are generally difficult to quantify due to the complexity of biological matrices and the variability in responses to environmental exposures within and between individuals (Pleil, 2009; Pleil and Sobus, 2013). Observation of such
responses or perturbations in humans, however, is necessary to provide direct empirical evidence of the initiation or progression of an adverse outcome pathway (AOP) (Ankley et al., 2010; Vinken, 2013; Pleil and Sheldon, 2011). An AOP, in the context of human environmental exposure and risk assessment, can be described as the process by which an exogenous
environmental stressor interacts with a receptor at the molecular level, thus initiating a sequence of events that can eventually lead to an adverse health effect (Ankley et al., 2010).
Therefore, the discovery and identification of meaningful biomarkers and appropriate analytical methodologies for quantifying these biomarkers in targeted studies are important for
understanding exposure-health effect linkages (Pleil and Stiegel, 2013).
The human inflammatory response has been studied in detail as an initial biological response to all types of external influences, including physical injury, psychological stress, environmental chemicals, bacteria, and viruses, and thus plays an important part in exposure-response mechanisms or AOPs (Koh et al., 2008; Dybing et al., 2004; Duramad et al., 2007; Selgrade et al., 2006; Spatari et al., 2013; Nakamura et al., 2014). Scientific evidence suggests that inflammation has been directly associated with a large number of adverse health outcomes, including cancer, cardiovascular disease, and autoimmune disease (Elenkov and Chrousos, 1999; Murase et al., 2013; Campbell, 2004; Kampa and Castanas, 2008; Goldbergova et al., 2012). Furthermore, research has shown that inflammation related to environmental exposures can create or exacerbate cardiopulmonary health effects such as asthma and chronic obstructive pulmonary disease (COPD) (Devlin et al., 2012; Devlin et al., 1991; Salvi et al., 1999; Pope et al., 2004). To date, most studies of inflammatory responses to environmental exposure focus on human populations that are already considered “unhealthy” or “at risk” so ultra-sensitive
methods for quantifying inflammation have been considered unnecessary.
Current in vitro and in vivo research investigating links between inflammatory responses and health effects often focus on a very selective group of proteins, primarily chosen based on the anticipated location of the inflammatory response (Candela et al., 1998; Bonisch et al., 2012; Ghoniem et al., 2011; Robroeks et al., 2006). Cytokines are a large group of intercellular
of the immune systems in response to an exogenous/endogenous antigen, cell growth and differentiation, and initiating or suppressing an inflammatory response (Chung and Barnes, 1999). The majority of research into pro- and anti-inflammatory cytokines focuses on their expression from T helper cell Type 1 (Th1), T helper cell Type 2 (Th2), and macrophages (Chung and Barnes, 1999; Boonpiyathad et al., 2013; Cannas et al., 2010; Cousins et al., 2002; Elenkov and Chrousos, 1999; Sack et al., 2006). Unlike hormones, which are loosely
categorized into the other class of signaling molecules in the body, cytokines are usually expressed in localized areas and are rarely stored, meaning that their expression is exclusively linked as a response to specific stimuli.
In the past, and still to some extent, the choice of which cytokine to study was often limited by methodological constraints, including: lack of specificity due to competitive antibody binding, time/cost constraints associated with the need to run multiple singleplex ELISAs for different biomarkers, and matrix interferences from the selected biological media (blood, cerebrospinal fluid, urine, etc.) (Elshal and McCoy, 2006; Malekzadeh et al., 2012). The development of very specific antibodies and multiplex and bead-based analytical techniques have resolved issues with specificity but assay robustness has typically limited the use of the analytical technique to one biological medium (Bomert et al., 2011; Chowdhury et al., 2009; Tighe et al., 2013; van Bussel et al., 2013).
In human-based health effects research, blood is considered the “gold standard” biological fluid of choice. Consequently, there is considerably less knowledge of cytokine expression in other human biological media, especially when it pertains to environmental exposures. In this study, 10 cytokines (interleukins [1β, 2, 4, 5, 8, 10, 12p70 and 13],
media: plasma, EBC, and urine. These cytokines are primarily produced by Th1 cells, Th2 cells, and macrophages and are associated with initiating (IL-1β, IL-2, IL-8, IL-12p70, IFN- γ, and TNF- α) or suppressing (IL-4, IL-5, IL-10, IL-13) an inflammatory response (Chung and Barnes, 1999). The majority of literature values for “control” samples in case-control studies show that each individual cytokine, as sampled in blood, EBC, or urine, are either near or below the methodological limit of detection (~1-10 pg/mL) or are below this nominal value and are generally not reported (Sanchez Perez et al., 2006; Ostrowski et al., 1998; Jacobs et al., 2001; Matsunaga et al., 2006). An analytical method that can simultaneously measure each cytokine in plasma, EBC, and urine with each biological media at a level of detection sensitive enough to address subtle biological changes clearly would enhance the prospect of successfully linking them to health effects. This study uses an existing ultra-sensitive multiplex (Human Th1/Th2 Cytokine 10-Plex Assay) kit from Meso Scale Discovery (Gaithersburg, MD) that is designed for human plasma/serum and applies it to blood, EBC and urine samples from a nominally healthy group of adult volunteers (Bastarache et al., 2014). The work presented here is novel as it describes analytical methods, measurement distributions, and correlations across 10 cytokines in three different biological media. All of these steps are critical for evaluating chemical
interactions at a cellular level, resulting biological responses, and potential downstream health effects. The cytokine analyses were completed in distinct phases to address the following objectives:
1. Determine whether cytokine markers can be detected in human biological samples from nominally healthy volunteers, and whether method modifications are needed to improve detection?
3. Describe cytokine measurement distributions, and investigate pairwise correlations within and across biological media.
2.2 Methods
2.2.1 Sample Collection
All biological specimens were collected with informed consent from healthy human adult volunteers at the United States Environmental Protection Agency’s (US EPA) Human Studies Facility in Chapel Hill, North Carolina. The study protocol and procedures were reviewed and approved by the University of North Carolina at Chapel Hill’s Institutional Review Board and the EPA’s Human Subjects Approving Official. A total of 90 whole blood samples and 77 exhaled breath condensate samples were collected from 15 adult volunteers (ages 23-37 years old) participating in an environmental exposure assessment study conducted at the Human Studies Facility in Chapel Hill, NC (IRB Study #: 09-1344). Urine samples were also collected from this cohort but a limited analysis (n=18) of these samples was performed. As such, this data set was supplemented with a larger and more comprehensive sample set of an earlier study that included 382 spot urine samples collected from 29 adult volunteers, ages 19-50 years old, in 2009-2011 (IRB Study #: 09-0741). The addition of these samples allowed for a more
comprehensive investigation of the methodological parameters and distributions of cytokines in urine.
polypropylene - vials (Corning Incorporated, Corning, NY), and then frozen at ≤-80°C until analysis.
Six EBC samples per subject were collected using a RTubeTM (Respiratory Research,
Inc., Austin, Texas) exhaled breath condensate collector using the (method described in Pleil et al. 2008). After collection, the volume of each sample was measured, placed in a 2mL
polypropylene vial (Corning Incorporated, Corning, NY), and then frozen at ≤-80°C until analysis.
A total of 400 spot urine samples were collected from 33 adults across the two studies. Consecutive urine voids were individually collected over a three-day period for each study participant in individual 1L high-density polyethylene containers (Chase Scientific Glass, Inc., Rockwood, TN). An 8mL-aliquot of each sample was transferred into a 10ml polypropylene vial (Corning Incorporated, Corning, NY) and immediately frozen at ≤-20°C until analysis.
2.2.2 Analysis
The calibration standards for the immunoassay were supplied in a single mix at 2500 pg/mL and required a series of 4-fold dilutions to achieve an 8-point standard curve. Twenty-five uL of a proprietary diluent were added to each of the 96-well plates, and the plates were sealed and incubated at room temperature (approximately 22.2°C) for 30 minutes at 1000 rpm. Next, duplicate 25 uL aliquots of each calibration standard (a total of 16 wells) and 80 individual samples were then added to the plate. The 96-well plate was sealed and incubated at room temperature for two hours at 1000 rpm. Then, the plate was washed three times with a phosphate buffered saline-0.05% Tween (PBS-T) solution. Twenty-five uL of a detection antibody solution was added into each of the 96 wells followed by sealing and incubating the plate for an
additional two hours at 1000rpm. The plate was washed three times with PBS-T and 150 uL of Read Buffer was added to each well. Finally, the plate was analyzed on a MSD SECTOR Imager 2400.
2.2.3 Methods Development
The methods development work proceeded in three stages. First, human blood plasma samples (n=13) and spiked method blanks (n=84, 12 repeated spikes at each of the 7
In the second stage of our analysis, a selection of EBC (n=24) and urine (n=18) samples was analyzed using the existing method to determine if the immunochemistry was compatible between different biological media, to assure that the samples were pre-processed appropriately and fit into the associated concentrations of the calibration curve, and to determine if the MSD SECTOR Imager 2400 could identify the 10 target cytokines. Success in this stage was
measured by the presence or lack of cytokines in EBC and urine. In a separate experiment, we
analyzed an additional 77 plasma samples, 53 EBC samples, and 382 urine samples; these measurements were combined with those from the earlier experiment to allow a comprehensive
statistical analysis.
2.2.4 Statistical Analysis 2.2.4.1 Model Development
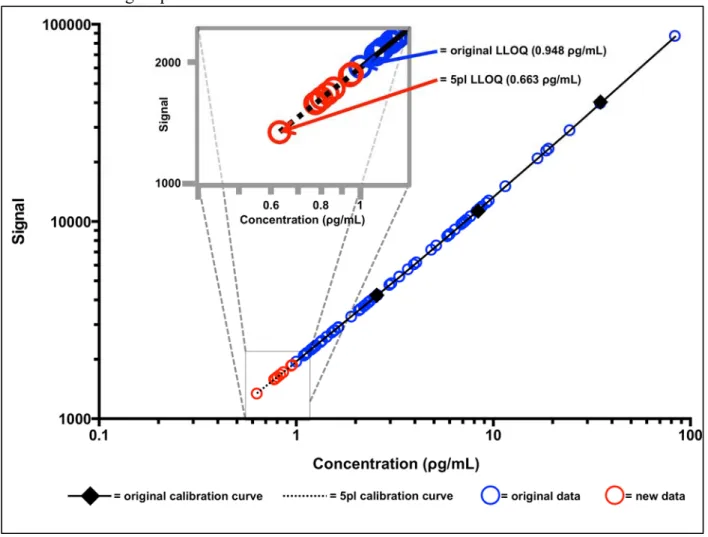
The MSD DISCOVERY WORKBENCH® analysis software was used to estimate the concentration data for each target cytokine. These data are based on an internally calculated signal-concentration 4-paramter logistic calibration curve. When a sample’s signal is below the instrument derived LLOQ the software will frequently report the signal but not a calculated concentration. We developed a series of 5-parameter logistic (5pl) models for each target cytokine to interpret these low-end signal values (Richards, 1959). Fitting the empirical data with this approach allowed us to extend the original calibration curve to make robust estimates between “zero” and the nominal (instrument derived) LLOQ.
2.2.4.2 Calibration and Sensitivity
respective plate (GraphPad Prism version 6.0, GraphPad Software, La Jolla, CA). Each LLOQ for a specific cytokine, in an individual analysis, was established during the model construction. Sample detections comparing the original calibration model to the 5pl model were also
calculated during this stage using the initial set of 13, 24, and 18 blood, EBC, and urine samples, respectively. The cytokine distribution percentiles for each biological media were estimated using the Proc UNIVARIATE procedure of the SAS statistical software package version 9.3 (SAS Institute, Cary, NC, USA).
2.2.4.3 Correlations and Variance Estimates
An α=0.05 criterion was used as the significance level for all statistical tests. Spearman correlation coefficients were calculated in GraphPad for each cytokine measured in both blood and EBC, but not urine, given that the majority of the urine sample-set was derived from another sample cohort. Cytokine measurement distributions across all three biological media were evaluated via visual inspection of quantile-quantile plots and Shapiro-Wilks tests for normality (SAS Proc UNIVARIATE). All data were right-skewed and were natural log-transformed prior to further analysis to satisfy normality assumptions.
ln (2.1) The model used for spiked samples is given in equation 2.1, where c = spiked concentration of 0.610, 2.44, 9.80, 39.1, 156, 625, or 2500 pg/mL; i = plate 1, 2, 3, 4, 5, 6, or 7 for the cth
concentration; j = measurement 1 or 2, on the ith plate, for the cth concentration. Here, Xcij
represents the concentration of a cytokine (pg/mL) from the jth measurement, on the ith plate, at
the cth concentration, and Ycij is the natural logarithm of the measurement Xcij. The coefficients
, bci, and εcij represent, respectively, the true (logged) mean cytokine level at the cth
concentration, the random effect of the ith plate at the cth concentration, and the random-error
effect of the jth measurement, on the ith plate, at the cth concentration. It is assumed that bci and
ε
cij are independent random variables with means of 0 and variances of and ,representing the between- and within-plate variance, respectively, at each concentration, c. Duplicate study samples (n= 28, 18, and 54 duplicates for blood, EBC and urine, respectively) were investigated using SAS Proc NESTED to estimate the proportion of
measurement error that could be attributed to biological matrix (i.e. blood, EBC or urine) effects; matrix effects were not examined using spiked samples, since spikes were prepared using a PBS/BSA solution.
ln (2.2)
Equation 2.2, similar to equation 2.1 but with “B” biological media instead of “c” concentration, was used to evaluate the study samples, specifically: B = biological media 1 (blood), 2 (EBC), or 3 (urine); i = 1, 2, …, nB individuals for the Bth biological media; and j = 1, 2, …, nBi
measurements of a particular cytokine from the ith individual, for the Bth biological media. Here,
B. Partitioning of the variance within- and between- persons helps determine whether the variance across the distribution for a specific cytokine (and a specific biological media) is more closely related to an individual or to the group.
Restricted maximum likelihood estimates of variance components (between- and within-plate for spiked samples, and between- and within-person for study samples) were used to calculate estimated 95% fold-ranges and intraclass correlation coefficients (ICC). Estimated fold-ranges ( 0.95) were calculated for each variance component result from the spiked
calibration sample analysis (using Equation 2.1), duplicate study sample analysis (using Equation 2.2), and repeated study sample analysis (using Equation 2.3). The fold-range estimates used here are a scale-independent way of comparing the central 95% of the measurement data, thus making it easier to compare estimates across analytes and media (Rappaport and Kupper, 2008).
Y . . (2.3)
For the spiked calibration samples, Equation 2.3 was used, where, Y . is the estimated overall
95% fold-range and and represent the estimated between- and within-plate variance components for each spiked concentration, c.
w . . (2.4)
For the duplicate study samples, Equation 2.4 was used, where, w . is the estimated within
sample 95% fold-range and represents the estimated within-person variance component for each biological media, B. Here, “duplicate” is defined as the same sample that was analyzed two different times.
For the repeated study samples, Equation 2.5 was used, where, Y . is the estimated overall
95% fold-range and and represent the estimated between- and within-person variance components for each biological media, B.
Estimated ICCs ( were calculated for the spiked calibration samples (Equation 2.6) and the study samples (Equation 2.7) using the following formulas:
= (2.6)
= (2.7)
MATLAB version 8.2 (R2013b, Mathworks, Natick, MA) and GraphPad were used for graphical representations.
2.3 Results
2.3.1 Objective 1-Detection of Cytokines in Three Biological Media
above the LLOQ by 9.24%, 7.92%, and 9.39% for the blood, EBC and urine samples, respectively.
Table 2.1: Comparison of the Percentage of Samples above the nominal LLOQs between the
Original Output and the “New” 5pl Model
Blood1 EBC2 Urine3
Cytokine Original New Original New Original New IL-1β 100 100 87.5 95.8 100 100
IL-2 92.3 100 87.5 95.8 100 100
IL-4 69.2 100 79.2 91.7 83.9 100 IL-5 92.3 100 79.2 83.3 83.3 100 IL-8 100 100 83.3 100 88.9 100 IL-10 92.3 100 87.5 87.5 94.4 100 IL-12p70 100 100 75.0 83.3 100 100 IL-13 69.2 100 8.30 16.7 55.6 100 IFN-γ 92.3 100 75.0 79.2 100 100 TNF-α 100 100 83.3 91.7 100 100 1:n=13, 2:n=24, 3:n=18
Figure 2.1 displays the total range and a “zoomed-in” view of the lower end of the calibration
Figure 2.1: IL-8 Calibration Curve for Urine Displaying the Additional Sample Concentrations
Gained from using a 5pl Model.
2.3.2 Objective 2- Cytokine Methodological Parameters
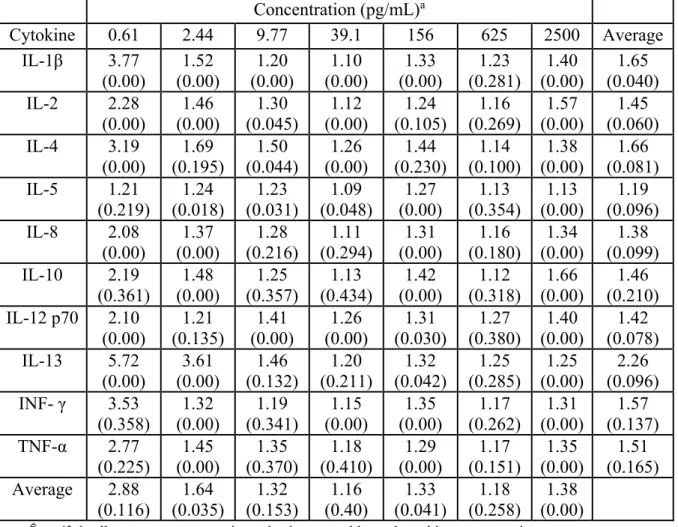
Overall fold-range (Y 0.95c) and ICC (ρ estimates, based on repeated measurements of
Table 2.2: Estimated 95% Fold-Ranges (Y 0.95c) and Intraclass Correlation Coefficients ρ for
repeated measures of spiked calibration samples.
Concentration (pg/mL)a
Cytokine 0.61 2.44 9.77 39.1 156 625 2500 Average
IL-1β 3.77 (0.00) 1.52 (0.00) 1.20 (0.00) 1.10 (0.00) 1.33 (0.00) 1.23 (0.281) 1.40 (0.00) 1.65 (0.040) IL-2 2.28
(0.00) (0.00) 1.46 (0.045) 1.30 (0.00) 1.12 (0.105) 1.24 (0.269) 1.16 (0.00) 1.57 (0.060) 1.45 IL-4 3.19
(0.00) (0.195) 1.69 (0.044) 1.50 (0.00) 1.26 (0.230) 1.44 (0.100) 1.14 (0.00) 1.38 (0.081) 1.66 IL-5 1.21
(0.219) (0.018) 1.24 (0.031) 1.23 (0.048) 1.09 (0.00) 1.27 (0.354) 1.13 (0.00) 1.13 (0.096) 1.19 IL-8 2.08 (0.00) 1.37 (0.00) 1.28 (0.216) 1.11 (0.294) 1.31 (0.00) 1.16 (0.180) 1.34 (0.00) 1.38 (0.099) IL-10 2.19 (0.361) 1.48 (0.00) 1.25 (0.357) 1.13 (0.434) 1.42 (0.00) 1.12 (0.318) 1.66 (0.00) 1.46 (0.210) IL-12 p70 2.10
(0.00) 1.21 (0.135) 1.41 (0.00) 1.26 (0.00) 1.31 (0.030) 1.27 (0.380) 1.40 (0.00) 1.42 (0.078) IL-13 5.72 (0.00) 3.61 (0.00) 1.46 (0.132) 1.20 (0.211) 1.32 (0.042) 1.25 (0.285) 1.25 (0.00) 2.26 (0.096) INF- γ 3.53
(0.358) 1.32 (0.00) 1.19 (0.341) 1.15 (0.00) 1.35 (0.00) 1.17 (0.262) 1.31 (0.00) 1.57 (0.137) TNF-α 2.77 (0.225) 1.45 (0.00) 1.35 (0.370) 1.18 (0.410) 1.29 (0.00) 1.17 (0.151) 1.35 (0.00) 1.51 (0.165) Average 2.88 (0.116) 1.64 (0.035) 1.32 (0.153) 1.16 (0.40) 1.33 (0.041) 1.18 (0.258) 1.38 (0.00)
a: Y 0.95c ρ , all parameters were estimated using natural logged cytokine concentrations.
On average, the central 95% of measurements were observed within a 1.55 fold-range across the 10 cytokines and seven spiked concentrations. Fold range estimates generally
increased as the spiked concentration decreased, with the lowest spiked concentration having the largest overall FRs. The average Y 0.95c for the 10 cytokines at 0.610pg/mL is 2.88, where the
average fold ranges for the other six concentrations, in increasing concentration from 2.44-2500pg/mL, are 1.64, 1.32, 1.16, 1.33, 1.18 and 1.38, respectively.
from the mixed models show indicate no significant random plate effects across all cytokines and concentrations (p≥0.18). Taken together, these results confirm that the variation in
measurements between plates can be treated as random error, and that samples analyzed across different plate are directly comparable.
Table 2.3 displays mean (±standard error) and fold-range (w 0.95β) estimates associated
with all duplicate measurements of cytokines in blood, EBC, and urine. Fold-range estimates based on biological media measurements were similar to those of the lowest spiked
concentration (0.610 pg/mL). The fold range estimates ranged from 1.36 to 4.29 for blood, from 2.12 to 4.96 for EBC, and from 0.935 to 38.7 for urine, while the lowest spiked concentration had fold ranges of 1.21 to 5.72. IL-13 had the largest fold-range for the blood and EBC samples, while IL-4 had the largest fold-range for the urine samples. These results were expected given that the majority of the sample concentrations (not shown) lie within a concentration range spanning from the LLOQ-1.00pg/mL for the respective cytokines.
Table 2.3: Descriptive Statistics and Estimated Fold-Ranges for Duplicate Samples
Blood EBC Urine
μ ± SEMa w 0.95Bb μ ± SEMa w 0.95Bb μ ± SEMa w 0.95Bb
IL-1β 1.51(0.515) 3.95 5.26(1.29) 2.82 1.74(0.226) 3.33 IL-2 0.127(0.012) 2.50 0.340(0.051) 4.96 0.935(0.208) 1.97 IL-4 0.380(0.047) 1.36 1.27(0.159) 3.39 1.54(0.046) 5.25 IL-5 0.639(0.256) 2.03 0.106(0.0121) 2.40 0.444(0.043) 2.41 IL-8 2.60(0.450) 1.50 3.67(2.89) 2.27 38.7(9.27) 2.10 IL-10 1.24(0.063) 1.56 1.12(0.082) 2.12 1.83(0.325) 2.30 IL-12 p70 0.448(0.028) 1.45 0.612(0.074) 3.35 1.20(0.032) 2.09
IL-13 1.32(0.108) 4.29 1.38(0.163) 4.77 2.03(0.045) 1.58 INF- γ 0.469(0.059) 1.75 0.386(0.051) 4.45 0.945(0.050) 2.28 TNF-α 2.14(0.118) 1.82 0.433(0.058) 4.34 0.974(0.058) 1.73
2.3.3 Objective 3- Study Sample Cytokine Measurement Distributions and Correlations
Descriptive statistics are given in Table 2.4, 2.5, and 2.6 for cytokines measured in blood plasma (n=90), EBC (n=77), and urine (n=400) samples, respectively; individual cytokines are sorted based on the percentage of samples above the LLOQ.
Table 2.4: Descriptive Statistics (pg/mL) for Cytokines in Plasma
Cytokine LLOQa %>LLOQ Min 5% 25% 50% 75% 95% Max
IL-8 0.056 (0.038) 100 0.980 1.15 1.50 1.97 2.67 3.86 41.7
TNF-α 0.064 (0.038) 100 1.06 1.29 1.44 1.73 2.49 3.73 8.77
IL-10 0.224 (0.060) 99.0 <LLOQ 0.486 0.746 1.26 1.59 2.31 3.23
IL-12 p70 0.197 (0.028) 95.2 <LLOQ 0.207 0.257 0.339 0.582 0.830 1.62
IL-5 0.055 (0.038) 94.3 <LLOQ <LLOQ 0.115 0.208 0.373 0.881 20.4
IL-4 0.228 (0.117) 81.0 <LLOQ <LLOQ 0.220 0.277 0.347 0.569 2.59
INF- γ 0.163 (0.104) 80.1 <LLOQ <LLOQ 0.085 0.305 0.649 1.51 3.01
IL-13 1.34 (0.845) 78.1 <LLOQ <LLOQ 0.220 1.62 2.04 2.75 4.38
IL-2 0.087 (0.068) 78.1 <LLOQ <LLOQ 0.047 0.093 0.189 0.262 0.633
IL-1β 0.511 (0.717) 73.3 <LLOQ <LLOQ <LLOQ 0.160 1.56 3.38 40.3
a: mean (standard deviation)
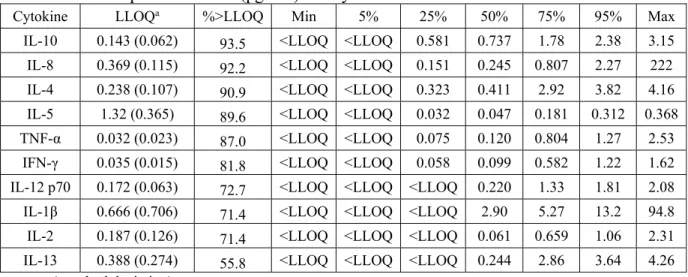
Table 2.5: Descriptive Statistics (pg/mL) for Cytokines in Exhaled Breath Condensate
Cytokine LLOQa %>LLOQ Min 5% 25% 50% 75% 95% Max
IL-10 0.143 (0.062) 93.5 <LLOQ <LLOQ 0.581 0.737 1.78 2.38 3.15
IL-8 0.369 (0.115) 92.2 <LLOQ <LLOQ 0.151 0.245 0.807 2.27 222
IL-4 0.238 (0.107) 90.9 <LLOQ <LLOQ 0.323 0.411 2.92 3.82 4.16
IL-5 1.32 (0.365) 89.6 <LLOQ <LLOQ 0.032 0.047 0.181 0.312 0.368
TNF-α 0.032 (0.023) 87.0 <LLOQ <LLOQ 0.075 0.120 0.804 1.27 2.53
IFN-γ 0.035 (0.015) 81.8 <LLOQ <LLOQ 0.058 0.099 0.582 1.22 1.62
IL-12 p70 0.172 (0.063) 72.7 <LLOQ <LLOQ <LLOQ 0.220 1.33 1.81 2.08
IL-1β 0.666 (0.706) 71.4 <LLOQ <LLOQ <LLOQ 2.90 5.27 13.2 94.8
IL-2 0.187 (0.126) 71.4 <LLOQ <LLOQ <LLOQ 0.061 0.659 1.06 2.31
IL-13 0.388 (0.274) 55.8 <LLOQ <LLOQ <LLOQ 0.244 2.86 3.64 4.26
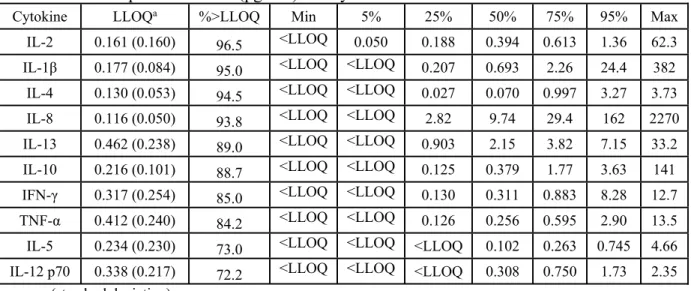
Table 2.6: Descriptive Statistics (pg/mL) for Cytokines in Urine
Cytokine LLOQa %>LLOQ Min 5% 25% 50% 75% 95% Max
IL-2 0.161 (0.160) 96.5 <LLOQ 0.050 0.188 0.394 0.613 1.36 62.3
IL-1β 0.177 (0.084) 95.0 <LLOQ <LLOQ 0.207 0.693 2.26 24.4 382
IL-4 0.130 (0.053) 94.5 <LLOQ <LLOQ 0.027 0.070 0.997 3.27 3.73
IL-8 0.116 (0.050) 93.8 <LLOQ <LLOQ 2.82 9.74 29.4 162 2270
IL-13 0.462 (0.238) 89.0 <LLOQ <LLOQ 0.903 2.15 3.82 7.15 33.2
IL-10 0.216 (0.101) 88.7 <LLOQ <LLOQ 0.125 0.379 1.77 3.63 141
IFN-γ 0.317 (0.254) 85.0 <LLOQ <LLOQ 0.130 0.311 0.883 8.28 12.7
TNF-α 0.412 (0.240) 84.2 <LLOQ <LLOQ 0.126 0.256 0.595 2.90 13.5
IL-5 0.234 (0.230) 73.0 <LLOQ <LLOQ <LLOQ 0.102 0.263 0.745 4.66
IL-12 p70 0.338 (0.217) 72.2 <LLOQ <LLOQ <LLOQ 0.308 0.750 1.73 2.35
a: mean (standard deviation)
Plasma samples had a greater percentage of samples (87.9%) that were above the LLOQ when compared to the EBC (80.6%) and urine (87.2%) samples. IL-4, IL-5, IL-8, IL-10, and TNF-α had the largest %>LLOQ in both plasma and EBC. IL-12p70 also had a large %>LLOQ in plasma, but was low in EBC and urine. IL-1β, IL-2, and IL-13 had the smallest %>LLOQ in the blood and EBC samples. The urine samples were unique in that the %>LLOQ was largest for IL-1β and IL-2; these results are the exact opposite of those observed for blood and EBC. LLOQs for specific cytokines were usually similar across the three biological media (e.g.
LLOQIL-2,blood≈ LLOQIL-2,EBC≈ LLOQIL-2,urine). However, LLOQs for IL-5, IL-8, IFN-γ and
TNF-α varied considerably across the three media, by as much as an order of magnitude. These variations did not appear to appreciably affect the percentage of measurements above these values. For example, IL-8 in the blood, EBC and urine samples had mean LLOQs of 0.056pg/mL, 0.369pg/mL, and 0.116pg/mL, respectively, but 100, 92.2, and 93.8 percent of samples above the LLOQ.
medium. Investigating individual cytokines across the different biological media shows that they have different concentration ranges from media to media. For example, IL-8 ranged from 0.980-41.7pg/mL in blood, <LLOQ-222pg/mL in EBC, and <LLOQ-2270pg/mL in urine,
demonstrating a wide range across the three media for this specific cytokine. In contrast, IL-12p70 had concentration ranges across the three biological media that were very similar to one another; IL-12p70 ranged from <LLOQ-1.62pg/mL in blood, <LLOQ-2.08pg/mL in EBC, and <LLOQ-2.35pg/mL in urine. There were also large ranges exhibited within each biological media. For example, the maximum concentrations in blood ranged from 0.633pg/mL for IL-2 to 41.7pg/mL for IL-8. The maximum concentrations in the EBC samples ranged from
0.368pg/mL for IL-5 to 222pg/mL for IL-8, and the maximum concentrations in urine ranged from 2.35pg/mL for IL-12p70 to 2270pg/mL for IL-8.
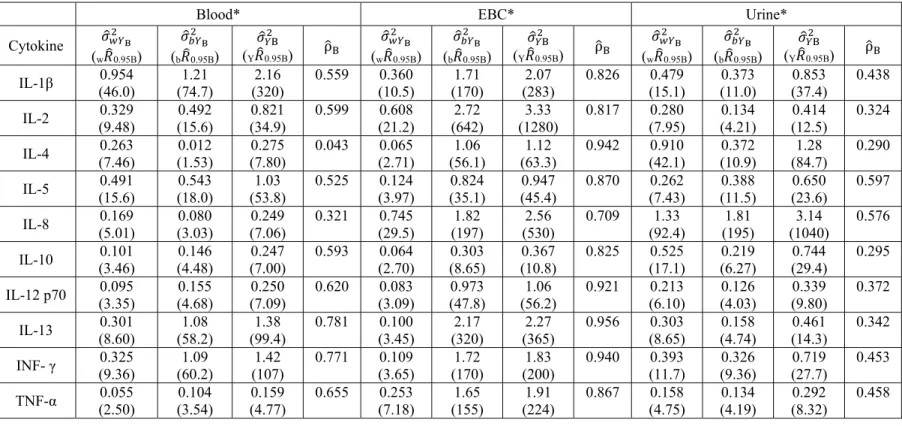
Table 2.7 displays estimated variance components, fold-ranges, and ICCs based on
measurements of study plasma, EBC, and urine samples. Here, , , and are the estimated within, between, and total variance for the respective cytokine in each biological medium. w 0.95B is the estimated fold-range containing the central 95% of cytokine
measurements for any given person in the sampled population. The parameter b 0.95B represents
the estimated fold-range containing the central 95% of mean cytokine levels across all individuals in the sampled population. Finally, Y 0.95B represents the estimated overall
Table 2.7: Estimated Variance Components, Fold-ranges, and ICCs for the Study Samples
*All parameters were estimated using natural logged cytokine concentrations
Blood* EBC* Urine*
Cytokine
(w 0.95B)
(b 0.95B) (Y 0.95B) ρ (w 0.95B)
(b 0.95B) (Y 0.95B) ρ (w 0.95B)
(b 0.95B) (Y 0.95B) ρ IL-1β (46.0) 0.954 (74.7) 1.21 (320) 2.16 0.559 0.360 (10.5) (170) 1.71 (283) 2.07 0.826 0.479 (15.1) (11.0) 0.373 (37.4) 0.853 0.438
IL-2 (9.48) 0.329 (15.6) 0.492 (34.9) 0.821 0.599 0.608 (21.2) (642) 2.72 (1280) 3.33 0.817 0.280 (7.95) (4.21) 0.134 (12.5) 0.414 0.324
IL-4 (7.46) 0.263 (1.53) 0.012 (7.80) 0.275 0.043 0.065 (2.71) (56.1) 1.06 (63.3) 1.12 0.942 0.910 (42.1) (10.9) 0.372 (84.7) 1.28 0.290
IL-5 (15.6) 0.491 (18.0) 0.543 (53.8) 1.03 0.525 0.124 (3.97) (35.1) 0.824 (45.4) 0.947 0.870 0.262 (7.43) (11.5) 0.388 (23.6) 0.650 0.597
IL-8 (5.01) 0.169 (3.03) 0.080 (7.06) 0.249 0.321 0.745 (29.5) (197) 1.82 (530) 2.56 0.709 1.33 (92.4) (195) 1.81 (1040) 3.14 0.576
IL-10 (3.46) 0.101 (4.48) 0.146 (7.00) 0.247 0.593 0.064 (2.70) (8.65) 0.303 (10.8) 0.367 0.825 0.525 (17.1) (6.27) 0.219 (29.4) 0.744 0.295
IL-12 p70 (3.35) 0.095 (4.68) 0.155 (7.09) 0.250 0.620 0.083 (3.09) (47.8) 0.973 (56.2) 1.06 0.921 0.213 (6.10) (4.03) 0.126 (9.80) 0.339 0.372
IL-13 (8.60) 0.301 (58.2) 1.08 (99.4) 1.38 0.781 0.100 (3.45) (320) 2.17 (365) 2.27 0.956 0.303 (8.65) (4.74) 0.158 (14.3) 0.461 0.342
INF- γ (9.36) 0.325 (60.2) 1.09 (107) 1.42 0.771 0.109 (3.65) (170) 1.72 (200) 1.83 0.940 0.393 (11.7) (9.36) 0.326 (27.7) 0.719 0.453
TNF-α (2.50) 0.055 (3.54) 0.104 (4.77) 0.159 0.655 0.253 (7.18) (155) 1.65 (224) 1.91 0.867 0.158 (4.75) (4.19) 0.134 (8.32) 0.292 0.458
Total fold-range estimates (Y 0.95B) were between 4.77 and 320 for blood, 8.32 and 1040 for
urine, and 10.8 and 1280 for EBC. These results suggest that total measurement variability was similar for urine and EBC, but somewhat smaller for blood. For the majority of the cytokines in blood (8/10 cytokines) and EBC (10/10 cytokines), b 0.95B was larger than w 0.95B. However, the
opposite trend was observed for urinary cytokines, where, for 8 out of 10 analytes, fold-range estimates were larger within-person than between-person.
Large differences were also observed between the estimated within- and between-person fold ranges for specific cytokines across the three biological media. Considering results for IL-4, w 0.95B values were 7.46, 2.71, and 42.1, and b 0.95B values were 1.52, 56.1, and 10.9 for blood,
EBC and urine, respectively. IL-4 is also interesting in that it is one of two cytokines in blood that had more estimated within-person variance than between-person variance. IL-2 is a more extreme example of large differences in FRs having Y 0.95B for blood, EBC and urine of 34.9,
1280, and 12.5, respectively.
Observations across biological media show that the estimated mean ICCs for the blood and EBC samples are 0.547 and 0.867, indicating that the majority of the variance in cytokine concentrations for these two biological media was observed between-people. Alternatively, the mean ICC across the urinary cytokines was 0.415 (i.e. more within-person than between person variance). The results do not show a consistent trend across cytokines (i.e. an increase/decrease in within- or between- person variance) and media. This demonstrates that despite an overall across-media trend (more between-person variance for blood and EBC and within-person variance for urine), the actual source of variation is dependent not only on the medium but also on the specific cytokine. These ICC results, and the accompanying variance results that
The next step in this analysis was to investigate the relationship between the ten cytokines in matched blood and EBC samples (n=77). These results show that all of the EBC cytokines, except IL-1β, are positively correlated with one another, and that the blood samples have a mix of positive and negative correlations (Figure 2.2). The Blood/EBC correlations have
positive and statistically significant correlations for most cytokines, except IL-1β, IL-4, IL-5, and IL10. Correlation coefficients ranged from 0.620 to 0.836 for the blood/blood comparisons, -0.045 to 0.852 for the EBC/EBC comparisons, and -0.236 to 0.600 for the blood/EBC
Figure 2.2: Cytokine Correlations (Spearman “Rho”) between Blood Plasma and Exhaled
Breath Condensate.
* A white dot in a cell denotes a statistically significant (p<0.05) positive or negative correlation.
2.4 Discussion
encompass EBC and urine samples as a complement to blood/plasma data. These new observations can be categorized as follows:
2.4.1 Calibration
During initial tests, the ostensible calibration range of the instrument needed to be adjusted to address the low concentrations that were found in nominally healthy subjects. The instrumentation provides signal “count” numbers beyond the internal calibration default values, and so a set of equations were developed that could be used to interpolate such results back to a new LLOQ. The 5-parameter logistic model was chosen for these concentrations calculations primarily based on the range and shape (log-normally distributed) of the data, and the ability the model to interpolate low-end signals, averaging 8.85% more samples across the three biological media. Experience with the 5pl model showed that the LLOQ could be decreased even lower using calibration strategies (based on trial and error) wherein individual cytokines were tested at vanishingly low concentrations to assess the empirical quantitation limits.
2.4.2 Sensitivity and Method Precision