Abstract: This paper describes a novel approach to traffic capture and analysis in high speed networks. A format for the representation of captured packets that (i) limits the amount of data stored and (ii) enables efficient processing is defined. Then, data mining techniques widely studied and deployed for extracting relevant information from extremely large data bases, are applied as a means to effectively process the significant amount of captured data.
The paper provides a first evaluation of the proposed approach in terms of its ability of extracting relevant information and its computational complexity. Such evaluation is based on the first experiments run on the prototypal implementation of the proposed approach within the Analyzer traffic capturing and analysis tool.
I. INTRODUCTION
ne of the most critical issues in keeping a network under control is capturing and analyzing its traffic. The complexity of these tasks is increasing as networks become faster and faster.
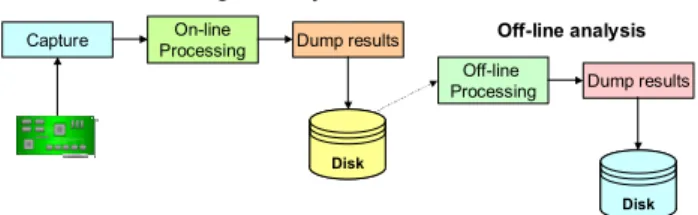
Traffic capturing and analysis goes through the steps depicted in Figure 1, all of which are critical when operating at high data rates. Some equipment vendors, such as Endace [1], offer network interfaces specifically designed for supporting packet capture at high data rates (e.g., 10 Gbps), thereby facilitating the realization of the first step in Figure 1.
Capture ProcessingOn-line Dump results
Disk Disk
On-line monitoring and analysis
Off-line analysis
Off-line
Processing Dump results
Disk Disk Figure 1. Basic steps in network traffic capture and analysis.
The time required to receive a minimum size Ethernet frame at 10 Gbps speed is less than 70 ns, which leaves a few hundreds clock cycles to a multi-GHz processor for handling a captured packet. This makes the realization of the second step critical. However, the deployment of multi-processor machines that concurrently process multiple packets increases the time available for handling each packet.
While ad-hoc solutions based on advanced hardware can mitigate the problems related to the first two steps in Figure 1,
no straightforward solution exists to reduce the criticalities of the following steps. For instance, a 10Gbps pipe carries more than 100 TBytes in the course of a day, which is a tremendous amount of data to be stored on a disk for subsequent processing. This results in two problems: on the one hand, the infrastructure needed to store such amount of data is sophisticated and costly and, on the other hand, locating relevant information within the saved data is computationally intense and time consuming.
This work addresses the above problems, whose solutions are strictly related since the complexity of off-line data processing depends on the amount and format of such data. After having provided the current state of the art in significantly reducing the amount of data stored (Section II), we describe our approach, which consists of two strictly related parts. First, Section III defines a format to represent captured packets that (i) limits the amount of data stored and (ii) enables efficient processing. Second, as explained in Section IV, data mining techniques [13] widely studied and deployed for extracting relevant information from extremely large data bases are applied to our problem. A prototypal implementation of the proposed approach has been integrated into the Analyzer traffic capturing and analysis tool [2]. Section V discusses the benefits and limitations expected from the deployment of the proposed approach, especially for what concerns the extraction of relevant information, which is still under evaluation.
II. RELATED WORK
Two methods are known in literature to reduce the amount of information about network traffic to be stored before further processing.
Packet sampling [3] consists in capturing only a subset of the packets, e.g. one out of N. Although several studies demonstrate that statistical properties can be inferred from sampled traffic without any noticeable loss of information, this approach is not be effective when all packets must be analyzed. One example is the detection of network attacks that are usually based on a small number packets exploiting a security bug (e.g. ping of death).
The second method is based on the fact that each packet can be associated to a flow (e.g. a TCP connection). A flow
Data Mining Techniques for Effective
Flow-based Analysis of Multi-Gigabit Network Traffic
Mario Baldi, Elena Baralis, Fulvio Risso
Computer Engineering DepartmentPolitecnico di Torino, Italy
E-mail: {mario.baldi, elena.baralis, fulvio.risso}@polito.it
can be defined as the set of packets that share the value of some fields in their headers (e.g. IP source and destination addresses, TCP source and destination ports, etc.), which can be seen as the signature of the flow. Flow-based techniques use this signature as elementary unit for storing traffic information: the network administrator is no longer able to see complete packets, but this might not be necessary for most applications. However, this approach cannot be used in case the payload should be available for inspection, e.g. in case of applications that detect network attacks based on some data in the packet payload (e.g. a malformed URL).
One of the most common flow-based technologies is Cisco Netflow [4] (currently being standardized under the umbrella of the IETF IPFIX working group [5]) in which a probe (usually running within a network device) analyzes traffic and creates a record for each flow. Flow records are then exported to a collector machine for further processing. A flow is usually exported when one of following conditions applies:
• the flow ends (e.g. a TCP segment with the FIN or RST flags is captured);
• the flow has been inactive for a certain period of time, i.e. no packets belonging to it have been observed for a given time (usually 15 sec);
• the flow is still active, but a timeout (usually 30 min) is expired; this is useful for exporting long-lasting flows on a regular basis;
• internal constraints (e.g. counters wrapping or low memory) compromise the probe functionality or accuracy; in this case, a flow may be forced to “expire” prematurely.
The main advantage of this technology compared to similar proposals is the support offered by many other vendors, among which is notably included Cisco Systems. However it suffers several limitations [10], among others (1) the large number of events possibly triggering flow export (which increases the amount of required processing) and (2) records representing a variable time of flow life, which causes unnecessary complexity and inaccuracy for trace analysis. Furthermore, Netflow (and IPFIX) is suitable only for TCP/IP networks since it does not take into account either link-layer headers, or other protocol stacks.
The Realtime Traffic Flow Measurement (RTFM) IETF working group [6] proposed another technology based on flow sampling in the past [7]. From many points of view, the RTFM proposal is more advanced than Netflow, among other reasons because processing in the probe can be partially customized. The Simple Ruleset Language [8] provides a method to customize both the flow definition and the actions (byte count, etc.) to be performed on each flow. Additionally, flows are bidirectional, making it easier to keep under control the two directions of a connection. Interaction between the
probe and the flow collector is done through SNMP queries, therefore the probe must store flow records in memory until the collector asks for them. Unfortunately, router vendors did not support this proposal and the public-domain NeTraMet software [9] is the only implementation available.
The sFlow technology [11] is a mixture between packet sampling and flow extraction. Packet sampling is deployed to achieve scalability and either sampled packets or the flow information related to it can be exported. This approach makes this technology suitable for a large set of environments because it allows both packet analysis (although limited to the first few hundred bytes of the packet) and flow analysis. The most important limitation is the lack of support from some of the key equipement vendors.
A common problem among the presented technologies is the impossibility to customize the set of fields being stored for each flow, which is one of the key advantages of the approach presented in this paper.Other solutions, such as standards like RMON (the IETF’s remote network monitoring system) or applications like ntop [12], provide another way to measure network traffic. However, while they allow a network manager to determine traffic levels in network segments, total traffic loads to/from busy hosts, etc., they do not provide any flow measurement capability.
III. DATA COLLECTION AND STORAGE Saving to disk each captured packet — or possibly just a snapshot of it — may be feasible in some cases, but it anyway requires a significant amount of resources. Therefore, such approach cannot be considered as the basis of generic traffic monitoring procedures.
In any case, single packets are not necessarily relevant for many types of traffic analysis whose focus is on packet flows. Our approach is based on flow-based processing: a probe collecting data saves a given set of information related to each flow, rather than dumping to disk (part of) the content of each packet. As mentioned earlier, a flow is a set of packets that have the same values in a given set of fields; in our approach they are not necessarily IP source/destination address, source/destination port, and protocol type — widely used as transport flow identifiers in TCP/IP networks. Our flow definition mechanism is more general and several fields can be included in the set that best characterizes each flow. For instance, if the administrator is interested in the analysis of differentiated services traffic, the value of the DS field can be saved for each flow. Alternatively, if the administrator is interested only in the accounting based on the IP source address, this can be the only parameter identifying a flow. Due to the flexible architecture of the underlying dumping mechanism, the addition of a new field in the definition of flows does not preclude the possibility of extracting statistics on previously stored data that do not have such information. A
difference between our approach and the RTFM one is that the former doed not support netmasks (e.g. network 130.192.0.0/16). The problem of using such a coarse flow definition is that there is no way to disaggregate data. For example, the amount of traffic sent by each host cannot be known.
The most relevant novelty of our approach is that the fields that are saved for each flow are completely customizable. For instance, the fields that are extracted by default in the current prototypal implementation of our solution are listed in Table 1; however, any field present in any protocol header can be extracted. The flow identification process does not require all these fields to be present at the same time: for example, ARP-related fields are not present when analyzing IPv6 flows.
Protocol Field name (s)
Ethernet Source and destination address Ethernet Protocol type VLAN Priority
VLAN VLAN ID
ARP Source and destination IP address IP / IPv6 Traffic class
IP / IPv6 Protocol type / Next header IP / IPv6 Source and destination address ICMP / ICMPv6 Type
TCP /UDP Source and destination port
Table 1. Default list of fields extracted for each flow.
For each packet the probe determines the flow the packet belongs to and updates a set of counters (e.g. number of bytes/packets, timestamps, etc.). The selected fields are extracted for each flow and periodically dumped to disk together with the value of the above counters. For instance, the NetLogger module of the Analyzer tool [2], a prototypal implementation of our approach, by default dumps the content of the flow cache every 2 minutes. A session lasting longer will be represented by several subsequent records. The time between subsequent dumps of the flow cache is called
flushing interval.
The complete dump of the flow cache every flushing interval is somewhat new among the flow-based technologies currently in use (NetFlow, sFlow). This solution uses more memory (expired flows reside still in memory) and disk (a long-lasting flow originates several flow records), but makes processing simple because the database contains a periodic and complete snapshot of the exiting flows. Therefore, real-time statistics, such as the amount of TCP traffic over real-time, are simpler to obtain.
The NetLogger module dumps flow information into a database to facilitate further information processing. The structure of the database is shown in Figure 2.
In order to support a variable number of fields within each flow, data is organized in three tables:
1. a transaction table keeps invariant information related to each flow;
2. an element table holds, for each flow, the list of fields to
be stored;
3. the Field Type table lists all valid fields.
Num_Elements Packets_Count Bytes_Count Last_Seen First_Seen End_Time Start_Time Interface_ID ID Transactions Num_Elements Packets_Count Bytes_Count Last_Seen First_Seen End_Time Start_Time Interface_ID ID Transactions Value Field_ID Trans_ID ID Elements Value Field_ID Trans_ID ID Elements Field Protocol ID Field_Type Field Protocol ID Field_Type 1 N N 1
Figure 2. Structure of the database that stores network flows.
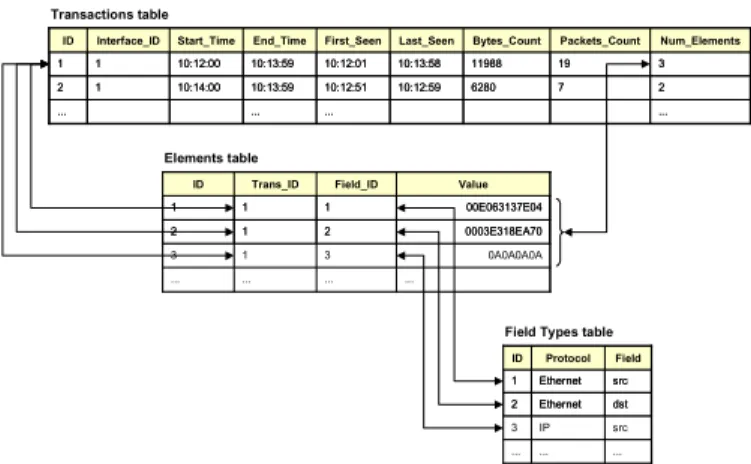
Figure 3 shows a sample table. Although this structure is slightly more complex than the traditional one (one table with a fixed number of fields, and one record per flow), it has proved much more flexible.
src IP 3 ... 2 1 ID ... Ethernet Ethernet Protocol ... dst src Field src IP 3 ... 2 1 ID ... Ethernet Ethernet Protocol ... dst src Field 0A0A0A0A 3 1 3 ... ... ... ... 2 1 Field_ID 2 1 ID 1 1 Trans_ID 0003E318EA70 00E063137E04 Value 0A0A0A0A 3 1 3 ... ... ... ... 2 1 Field_ID 2 1 ID 1 1 Trans_ID 0003E318EA70 00E063137E04 Value 10:12:59 10:13:58 Last_Seen 6280 11988 Bytes_Count 7 19 Packets_Count 1 1 Interface_ID 10:14:00 10:12:00 Start_Time ... ... ... ... 10:12:51 10:12:01 First_Seen 2 1 ID 10:13:59 10:13:59 End_Time 2 3 Num_Elements 10:12:59 10:13:58 Last_Seen 6280 11988 Bytes_Count 7 19 Packets_Count 1 1 Interface_ID 10:14:00 10:12:00 Start_Time ... ... ... ... 10:12:51 10:12:01 First_Seen 2 1 ID 10:13:59 10:13:59 End_Time 2 3 Num_Elements Transactions table Elements table
Field Types table
Figure 3. Snapshot of records stored in the database.
SQLite was selected as a database engine since, as shown by Table 2, it provides very fast access and its overhead is only 5 times the time required to store data on a flat file (see Table 3). Since this engine cannot be configured as a standalone database server, scalability might become a problem because of the impossibility to split the load between the network probe and the database server. In order to optimize record insertion time, the flow export process dumps data on disk in a flat file and subsequently data are imported in the database through a bulk insertion. This also offers the flexibility to use a different database engine if needed, at the expense of disk space and speed.
Database Type Record/sec written on disk
Access 2002 344 MySQL 3.23.53 1023 SQLite 2.8.0 11565 Text File 69657
Table 2. Number of records per seconds written on disk, using different archive formats on a dualXeon 2. GHz,120GB HD .
As shown in Table 3, the NetLogger module at the default flushing interval of 2 minutes features a 20 to 1 reduction in the disk space requirement when compared to saving each
packet, unless indexes are created in order to speed up queries. The resulting disk files can be further compressed by means of general-purpose compression utilities, such as gzip, thus obtaining disk-saving factors of more than 80:1. Obviously, as shown in Table 3, increasing the duration of the flushing interval, further increases (even though mildly) the disk-saving factor. However, according to the figures shown in Table 3, a flushing interval larger than two minutes is not advisable since the database reduction is not significant while a longer sampling period makes computing traffic statistics harder.
Flushing Interval
Database Type 2 min 3 min 4 min
Access 2002 17:1 18:1 19:1 SQLite 2.8.0 19:1 20:1 20:1 SQLite 2.8.0 with indexes 10:1 10:1 11:1
Text file 29:1 31:1 32:1
Table 3. Disk space saving with different archive formats and sampling intervals.
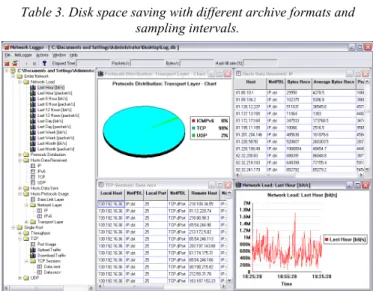
Figure 4. Extracting traffic statistics from the NetLogger database.
The Netlogger module includes a graphical interface (shown in Figure 4) that allows extracting traffic statistics out of the flow database through specific SQL queries. Extracted information includes both general statistics (protocol distribution, generated traffic ordered by source, and more) and field-specific information (e.g. traffic sent by host X). In order to allow users to get results in a couple of clicks and without any knowledge of the SQL language, a list of predefined queries is provided. Being such list specified in a configuration XML file (read by the user interface), it can be customized. Although the speed in executing the query depends on the complexity of the query itself, most commonly used information can be obtained in a couple of seconds on a regular PC (e.g. Pentium IV 2.4 MHz). The system cannot provide real-time network data (e.g., statistics) because samples corresponding to the current flushing interval (default two minutes) are not in the database — the captured flows have still to be exported by the probe. However, this is not an
issue for many monitoring and analysis applications. IV. MINING RELEVANT INFORMATION A set of standard statistics (e.g. the protocol distribution, the amount of traffic sent by every host, etc.) can be easily obtained from the data stored as described above. However, even though the proposed approach results in significantly less information than a raw packet dump would produce, locating added-value information (e.g., locating an ongoing security attack) might be extremely cumbersome, if at all possible, for the network administrator.
We have been experimenting the application of data mining techniques to large databases structured as described in the previous section, wherein each sample of a flow is represented by a record. In particular, our prototypal NetMiner module, integrated in Analyzer, implements data mining techniques for the extraction of Frequent Itemsets and Association Rules [13].
An Itemset is a set of elements – (record field, value) pairs
in the database – characterized by a given value in one or more fields (e.g., IP source address and TCP source port). An Itemset is considered Frequent if its cardinality exceeds a given threshold with respect to the total number of samples. For example, the set {host_dest=X, port_dest=Y} is a
Frequent Itemset if there are more than Z% (e.g. 5%) samples in the database containing the set.
Association Rules are extracted from frequent itemsets and
show correlations among (contained) itemsets. For instance, if a host S is active mostly as a web server, the association rule:
IP dest_address = S → TCP dest_port = 80
shows that there is a high probability that the flows destined to the server (characterized by the value S in the IP destination address field) contain 80 (the default TCP port for a web server) in the TCP destination port field.
Data mining techniques are not widely used for network operation and management. Most research is related to intrusion detection systems (IDS). Lee, in [14] proposes an IDS built combining various data mining techniques, thus reducing the need to manually analyze and encode intrusion patterns. Portnoy, in [15], proposed a method to build an IDS based on clustering and anomaly detection. This method aims at dividing network traffic into clusters and then separate clusters containing normal traffic from clusters that represents intrusions, without requiring a “normal data set” to train the system. However, the assumptions on which the method is based are not realistic, thus making it of limited use in practice. The most important problem of IDS based on data-mining techniques is the false positive rate, which may well be around 1%. For instance, a false positive rate of 1% with the assumption of 1 intrusion every 10,000 normal transactions, results in a false alarm ratio above 99%, which makes these methods unusable without additional techniques for false
alarm reduction.
We believe that data mining techniques can be deployed much more effectively in other fields where the false positives are not an issue. In the work presented in this paper the output of the data mining process is used to create a snapshot of the network: which hosts act as servers, which ones are clients, which ones are routers, and so on. The network administrator can use the snapshot produced by the NetMiner module to check if hosts behave as expected; in addition, NetMiner can highlight changes in the network by comparing in snapshots taken at different times.
V. CONCLUDING REMARKS
While the data collection and storage approach proposed in Section III and its implementation in the NetLogger module can be considered stable, the data mining approach and its support by the NetMiner module still need a more detailed evaluation and field trial. Even though tests conducted with the tool on the campus network of our University (encompassing about 6,000 end-systems) provided some insight in the benefits and shortcomings of the proposed approach, much more can be learned through a more extensive deployment in various environments and by various users.
Among the results of the preliminary tests is the ability to effectively locate peer-to-peer applications. It is important for network administrators to be able to locate and monitor the traffic generated by these applications that are usually installed and controlled directly by network users. However, this is not easy with traditional traffic monitoring and analysis methods for two reasons. First, often peer-to-peer applications are not among the top network speakers (i.e., they do not generate much traffic), thus they cannot be identified by looking for large amount of data being transferred. Second, they use random ports, therefore they cannot be located by looking for traffic originated from or destined to specific ports. Conversely, the proposed data mining based approach easily locates them by singling out association rules between hosts and the ports they use.
On the down side, our experience with the approach shows that the interpretation of results of the data mining process is far from being straightforward. This is mainly due to the large amount of information returned by data mining techniques that the network administrator is required to go through. For example, it is not uncommon that hundreds of thousands association rules be identified on a traffic trace. The problem of sifting through them is emphasized by the fact that the network administrator is not — and should not become — a data mining expert. Thus, our work on the NetMiner module has focused on providing a user interface that, being designed specifically for network analysis applications, facilitates the network administrator in browsing through the results
provided by the data mining process. More work is being done to improve this aspect of the tool.
More investigation and new results are expected on an important by-product of the proposed approach: using the outcome of the data mining process as an extremely compact representation of captured network traffic. In fact, the size of the output of the proposed data mining techniques can be more than 50 times smaller than the database on which they are applied (described in Section III). Consequently, it would be interesting to demonstrate that most of the relevant information that can be inferred from the original traffic dump (realized as described in Section III) can also be inferred from the output of the data mining process. In this case, the former could be discarded and only the latter archived for later reference, thus dramatically reducing the resource requirement for keeping historical traces of network traffic.
ACKNOWLEDGMENTS
The authors wish to thank Pierluigi Giverso for his valuable work on the implementation of the NetMiner module.
REFERENCES
[1] Endace Measurement Systems, web site at http://www.endace.com. [2] The NetGroup at Politecnico di Torino, Analyzer 3.0 alpha. Analyzer
web site, http://analyzer.polito.it/30alpha/.
[3] K. C. Claffy, G. C. Polyzos, H. W. Braun, Application of Sampling Methodologies to Network Traffic Characterization, Proceedings of SIGCOMM 1993, pages 194-203.
[4] Cisco Systems, Cisco IOS Netflow. Technical documentation available at http://www.cisco.com/warp/public/732/Tech/nmp/netflow/. [5] Internet Engineering Task Force, IP Flow Information Export (IPFIX)
Working Group; home page at http://www.ietf.org/html.charters/ipfix-charter.html.
[6] Internet Engineering Task Force, Realtime Traffic Flow Measurement
(RTFM) Working Group; home page at
http://www.ietf.org/html.charters/rtfm-charter.html.
[7] N. Brownlee, C. Mills, G. Ruth, Traffic Flow Measurement: Architecture, RFC 2722, IETF Network Working Group, October 1999.
[8] N. Brownlee, SRL: A Language for Describing Traffic Flows and Specifying Actions for Flow Groups, RFC 2723, IETF Network Working Group, October 1999.
[9] N. Brownlee, Using NeTraMet for Production Traffic Measurement, Proceedings of the 2001 IEEE/IFIP International Symposium on Integrated Network Management, May 2001, Pages 213-226.
[10] C. Estan, K. Keys, D. Moore, G. Varghese, Building a Better NetFlow, Proceedings of SIGCOMM 2004, August 2004.
[11] P. Phaal, S. Panchen, N. McKee, InMon Corporation's sFlow: A Method for Monitoring Traffic in Switched and Routed Networks, RFC 3176, IETF Network Working Group, September 2001.
[12] L. Deri, S. Suin, Effective Traffic Measurement using ntop, IEEE Communications Magazine, 38(5), pp 138-145, May 2000.
[13] J. Han, M. Kamber, Data mining: concepts and techniques, Morgan Kaufmann, 2001.
[14] W. Lee, S. Stolfo, A Framework for Constructing Features and Models for Intrusion Detection Systems, ACM Transactions on Information and System Security, Volume 3, Number 4, November 2000, pg 227-261.
[15] L. Portnoy, E. Eskin, S. Stolfo, Intrusion detection with unlabeled data using clustering, Proceedings of the ACM Workshop on Data Mining Applied to Security (DMSA 2001).