Open Access
Research
COPD phenotype description using principal components analysis
Kay Roy*, Jacky Smith, Umme Kolsum, Zöe Borrill, Jørgen Vestbo and
Dave Singh
Address: University of Manchester, North West Lung Research Centre, University Hospital of South Manchester Foundation Trust, Wythenshawe, Manchester, M33 9LT, UK
Email: Kay Roy* - [email protected]; Jacky Smith - [email protected]; Umme Kolsum - [email protected]; Zöe Borrill - [email protected]; Jørgen Vestbo - [email protected]; Dave Singh - [email protected]
* Corresponding author
Abstract
Background: Airway inflammation in COPD can be measured using biomarkers such as induced sputum and FeNO. This study set out to explore the heterogeneity of COPD using biomarkers of airway and systemic inflammation and pulmonary function by principal components analysis (PCA).
Subjects and Methods: In 127 COPD patients (mean FEV1 61%), pulmonary function, FeNO, plasma CRP and TNF-α, sputum differential cell counts and sputum IL8 (pg/ml) were measured. Principal components analysis as well as multivariate analysis was performed.
Results: PCA identified four main components (% variance): (1) sputum neutrophil cell count and supernatant IL8 and plasma TNF-α (20.2%), (2) Sputum eosinophils % and FeNO (18.2%), (3) Bronchodilator reversibility, FEV1 and IC (15.1%) and (4) CRP (11.4%). These results were
confirmed by linear regression multivariate analyses which showed strong associations between the variables within components 1 and 2.
Conclusion: COPD is a multi dimensional disease. Unrelated components of disease were identified, including neutrophilic airway inflammation which was associated with systemic inflammation, and sputum eosinophils which were related to increased FeNO. We confirm dissociation between airway inflammation and lung function in this cohort of patients.
Background
Chronic obstructive pulmonary disease (COPD) is an inflammatory airway disease characterised by poorly reversible airway obstruction. In fact, COPD can be viewed as an umbrella term that encompasses a range of pulmonary and systemic manifestations. COPD severity is graded by forced expiratory volume in 1 second (FEV1) [1], but this grading does not recognise the range of pathophysiological abnormalities that may be present in this heterogeneous condition. There is currently much interest in improving the phenotypic description of
COPD by the use of biomarkers that allow distinct sub-groups of patients with different prognosis or response to therapy to be identified [2].
Induced sputum is a safe and non-invasive method for studying biomarkers of airway inflammation in COPD patients, neutrophil [3] and eosinophil [4] numbers being the most valuable measures at present. An alternative biomarker is nitric oxide (NO), which is synthesized from L-arginine by nitric oxide synthase (NOS) enzymes and can be measured in exhaled breath (FeNO). FeNO
(frac-Published: 29 May 2009
Respiratory Research 2009, 10:41 doi:10.1186/1465-9921-10-41
Received: 1 September 2008 Accepted: 29 May 2009
This article is available from: http://respiratory-research.com/content/10/1/41 © 2009 Roy et al; licensee BioMed Central Ltd.
tional exhaled nitric oxide) has not become widely used as a biomarker in COPD patients as it is reduced by current cigarette smoking [5] and can therefore mainly be used in ex-smokers [6,7] and subjects with unstable disease [8].
Biomarkers of airway inflammation, such as induced spu-tum and FeNO, clearly have the potential to define
sub-groups of COPD patients with different characteristics. In order to use these biomarkers to enhance phenotype description, it would be important to know other clinical characteristics associated with these biomarkers. For example, patients with COPD have increased levels of sys-temic inflammation [9,10], with CRP levels being associ-ated with increased mortality [11], possibly through cardiovascular disease [10]. Such associations between airway and systemic inflammation may point towards specific pathophysiological mechanisms that contribute to disease characteristics.
Multivariate modelling overcomes has been used to test pre-determined hypotheses concerning the relationships between biomarkers and other measurements in COPD [12,13]. An alternative strategy is to use methods that gen-erate hypotheses rather than test pre-determined hypoth-eses. Exploratory factor analysis [14,15] is a hypothesis generating method that identifies groups of associated parameters into factors that are responsible for disease heterogeneity. This approach has previously been used in COPD to demonstrate dissociation between airway inflammation and pulmonary function [16]. Principal components analysis (PCA) is the commonest form of factor analysis and reduces a large number of variables to a much smaller number of components, explaining the variability within the data set. These components repre-sent latent processes which cannot be directly measured. In the context of COPD, components may represent the pathophysiological processes responsible for disease het-erogeneity.
We report the use of PCA to explore the heterogeneity in markers of airway and systemic inflammation and pulmo-nary function in a cohort of subjects with COPD. The pri-mary aim of this study was to identify components representative of the different pathophysiological proc-esses and hence generate hypothesis concerning COPD phenotype description. We also used traditional multivar-iate modelling to test the predetermined hypothesis that the non-invasive airway biomarkers studied were associ-ated with other disease parameters.
Methods
Subjects
127 COPD patients (44 smokers and 83 ex-smokers) diag-nosed according to current guidelines [1] with a signifi-cant smoking history (> 10 pack years), and spirometric
measurements of post bronchodilator forced expiratory volume in 1 second (FEV1) < 80% and FEV1/forced vital capacity (FVC) < 0.7 were recruited. Patients were recruited from primary care by media advertising. Only subjects who had negative skin prick tests to three aller-gens (house dust mite, grass pollen and cat hair; ALK Abello; Denmark) were included and patients with a clin-ical history of asthma or atopy were excluded. Additional exclusion criteria were a respiratory tract infection or exac-erbation of COPD in the preceding six weeks. The demog-raphy of all participants is shown in Table 1. Written and informed consent was obtained and the local ethics com-mittee approved the study.
Study design
The following procedures were performed on a single study visit in order: measurement of FeNO, spirometry, plethysmography, sputum induction and peripheral blood sampling. Inhaled corticosteroids were withheld for 12 hours prior to the study visit.
FeNO
Subjects were asked to abstain from food and caffeine for two hours, nitrate enriched foods for 24 hours, smoking for six hours, and alcohol for twelve hours prior to the measurement of FeNO using a Niox chemiluminescence on-line analyser (Aerocrine, Solna, Sweden). The smoking history was checked by questioning before FeNO
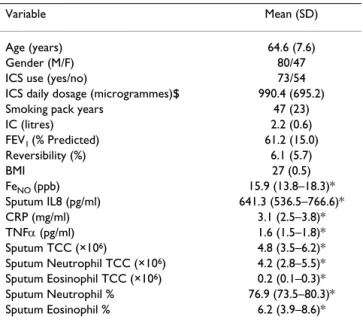
measure-Table 1: Subject demography and descriptive data of variables
Variable Mean (SD)
Age (years) 64.6 (7.6)
Gender (M/F) 80/47
ICS use (yes/no) 73/54
ICS daily dosage (microgrammes)$ 990.4 (695.2)
Smoking pack years 47 (23)
IC (litres) 2.2 (0.6)
FEV1 (% Predicted) 61.2 (15.0)
Reversibility (%) 6.1 (5.7)
BMI 27 (0.5)
FeNO (ppb) 15.9 (13.8–18.3)*
Sputum IL8 (pg/ml) 641.3 (536.5–766.6)*
CRP (mg/ml) 3.1 (2.5–3.8)*
TNFα (pg/ml) 1.6 (1.5–1.8)*
Sputum TCC (×106) 4.8 (3.5–6.2)*
Sputum Neutrophil TCC (×106) 4.2 (2.8–5.5)*
Sputum Eosinophil TCC (×106) 0.2 (0.1–0.3)*
Sputum Neutrophil % 76.9 (73.5–80.3)*
Sputum Eosinophil % 6.2 (3.9–8.6)*
*Geometric mean (95% confidence interval presented for variables that were log transformed.
ICS; inhaled corticosteroid, IC; inspiratory capacity, FEV1; forced expiratory volume in 1 second, BMI; body mass index, FeNO; fractional exhaled nitric oxide, CRP; C-Reactive Protein, TNFα tumour necrosis factor-alpha, TCC; total cell count.
ments were commenced. After inhaling NO free air to total lung capacity, subjects exhaled at a constant flow rate against a resistor to collect the plateau NO concentration at flow rate 50 ml/s (ATS guidelines). Three acceptable readings were recorded according to the American Tho-racic Society guidelines [17].
Pulmonary function
Maximum expiratory flow volume measurements were performed in triplicate using the spirometry system on the Masterscreen; we recorded the highest FEV1 and FVC. Readings were repeated 15 minutes after 200 mcg Salbuta-mol via spacer. Inspiratory capacity (IC) was measured in a constant volume plethysmograph (Sensormedics Vmax 6200).
Induced sputum
Sputum was induced using 3%, 4% and 5% saline, inhaled in sequence for 5 min via an ultrasonic nebuliser (Ultraneb 2000, Medix, Harlow, UK). Sputum was selected from the saliva, and processed with DTT as previ-ously described [18]. Cytospin preparations were air dried, fixed with methanol and stained with Rapi-diff (Tri-angle, Skelmersdale, UK). Four hundred leukocytes were counted and the results expressed as a percentage of the total leucocyte count, and a total cell count (TCC).
Sputum supernatant cytokine analysis
Interleukin 8 (IL-8) was measured by enzyme linked sand-wich immunoassay (ELISA) (R&D Systems Europe, Oxon, UK) with a lower limit of detection of 15.625 pg/ml.
Plasma assays
Plasma was obtained from peripheral blood samples by centrifugation at 2500 rpm and 4°C for 15 minutes. Plasma was stored at -80°C until analysis. Tumour Necro-sis Factor-alpha (TNF-α) was measured by high sensitivity ELISA (Quantikine, R&D Systems Europe, Oxon, UK) with a lower limit of detection of 0.5 pg/ml. C-reactive protein (CRP) was measured by high sensitivity particle enhanced immunonephelometry (Cardiophase; BN sys-tems, Dade Behring, Newark, USA) with a lower limit of detection of 0.175 mg/L.
Statistical analysis
All statistical analyses were performed using SPSS 13.0 (SPSS Inc, Chicago, Ill). The Kolmogorov Smirnov test determined normality of data. Non-parametric data were natural log transformed and presented as geometric means and 95% confidence intervals. Statistical signifi-cance was considered at p ≥ 0.05. PCA analysis was per-formed as follows:
1. Variable selection
The following variables were included: FEV1 (%
pre-dicted), IC (L), reversibility (% prepre-dicted), FeNO (ppb),
CRP (mg/L), TNF-α (pg/ml), sputum TCC (×106), sputum
neutrophil TCC (×106) and eosinophil % and sputum IL8
(pg/ml). The PCA was not run with sputum neutrophil % and eosinophil % as they are mathematically related. Instead, neutrophil TCC was included as this reflects the neutrophil load in the airways.
2. Component extraction
We interpreted only the loadings with an absolute value greater than 0.4 (which explains around 16% of the vari-ance by the variable) [15]. Missing data cases were excluded pair wise rather than list wise to maintain suffi-cient numbers for the analysis.
3. Rotation
An oblique rotation was chosen based on the implausibil-ity of independent components assumed by orthogonal rotations. However, both oblique promax and orthogonal varimax rotations were examined and produced extremely similar components demonstrating stability of the com-ponents.
4. Component Validity
Component scores for each patient were calculated using the regression method. To validate the components, a MANOVA (multivariate analysis of variance) was run with the PCA scores as outcome variables and the demographic details (age, gender, smoking status, smoking pack years, BMI and inhaled steroid usage) as the predictors. If the predictor terms were significantly related to the PCA com-ponents according to Pillai's test then individual associa-tions between predictors and components were examined using specific post hoc tests.
Multivariate analysis
Univariate analysis was initially performed between all variables. Those variables that were associated with more than one other variable (P < 0.2) were entered into multi-variate regression models. This allowed variables that were independent predictors of the variables after adjust-ing for potential confoundadjust-ing variables to be determined. Measurements of airway inflammation (induced sputum measurements including cell counts and percentages and FeNO) were the dependent variables. Linear regression was
used for continuous variables. Where 2 or more inde-pendent predictors were found, analysis of the interaction between these predictors was performed.
Results
patients having a complete dataset with all variables. The post bronchodilator FEV1 range for these COPD patients
was 17.9 to 79.6%. 98 of the 127 patients had moderate COPD (GOLD stage II), while 22 had severe disease (GOLD stage III) and 4 very severe disease (GOLD stage IV).
Component generation
9 variables were included in the PCA (Kaiser-Meyer-Olkin measure of sampling adequacy 0.5, Bartlett's Test of sphericity < 0.0001). 4 components with eigenvalues > 1 were identified with a subsequent break in the scree plot (Figure 2). These 4 components explained 64.9 % of the variance between patients. The variables loading > 0.5 are shown in Table 2, along with the proportion of variance explained by each component.
Component (1) consisted of measurements corresponding to neutrophilic airway inflammation (sputum neutrophil cell count and sputum supernatant IL8) and systemic inflammation (plasma TNF-α) explaining the most varia-bility in the data (20.2%). This was followed by sputum eosinophils and FeNO which contributed to a similar
pro-portion of the variance (18%), component (2). A compo-nent was also formed of bronchodilator reversibility, FEV1 and IC measurements (15% of variance), component (3). CRP levels contributed 11% of the variability, solely rep-resenting component (4). The components remained unal-tered when varimax rotation was applied instead of promax and even when the solution was unrotated
Correlations between components
The correlations between the 4 components from the pro-max solution were weak (Table 3) showing that all the components were distinct from one another.
MANOVA; Relationships between components and clinical data
Table 4 summarises the significant predictors of the com-ponents in the MANOVA. The variables in component 2 were associated with age, current smoking status and gen-der. Component 4 (CRP level) was associated with inhaled corticosteroid use and pack year history.
Multivariate analysis
Different multivariate models were used to determine independent predictors of the following airway inflam-mation measurements; sputum total cell count, sputum neutrophil and eosinophil cell count and percentage dif-ferential and supernatant IL-8 levels (Table 5). Plasma TNF-α levels were significantly associated with sputum neutrophil cell count and supernatant IL-8 levels, and there were significant associations between sputum neu-trophils and supernatant IL-8 levels. There were strong and highly significant associations (p < 0.0001) between FeNO and sputum eosinophils, regardless of whether the
data was expressed as percentage differential or cell count. Reversibility was associated with eosinophil percentage. Smoking and gender were independent predictors of FeNO
levels, with lower levels seen in COPD smokers and women. Neutrophil percentage was negatively correlated with FeNO levels and reversibility.
Discussion
The primary aim of this study was to generate hypotheses about COPD phenotype description and disease mecha-nisms by exploring the variability in markers of inflam-mation and lung function using PCA. This analysis suggests that COPD is a truly multi-dimensional disease. PCA identified four main components, each explaining similar amounts of the variance (between 10 and 20%). The first two components represented neutrophilic and eosinophilic inflammation, explaining 20.2% and 18.2% of the variance respectively. Lung function parameters formed a separate component, comprising measures of airflow obstruction and reversibility. CRP also formed a separate component. Some hypotheses about disease mechanisms can be generated from this analysis; compo-nent 1 suggests that the profile of neutrophilic airway inflammation is associated with systemic inflammation, and component 2 suggests that patients with sputum eosi-nophilia, which is associated with increased corticoster-oid responsiveness [4] also have increased FeNO levels.
Importantly, PCA indicates that these are distinct compo-nents of disease that could be used for patient phenotyp-ing [19]. Correlations between the components were weak despite the use of a Promax rotation. To validate the PCA components, we performed multivariate modelling, which confirmed our PCA findings.
The main limitation of any PCA is the selection of varia-bles included. This analysis has focused on a selection of
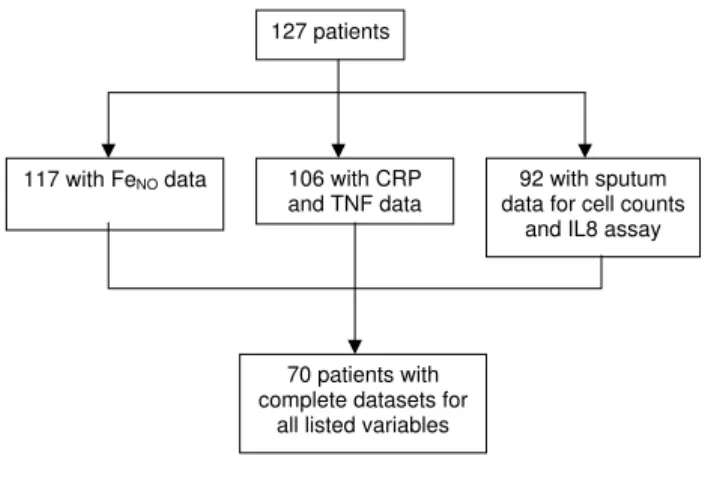
Flow chart showing the total number of patients who were able to perform all measurements and those who were una-ble to complete certain measurements
Figure 1
Flow chart showing the total number of patients who were able to perform all measurements and those who were unable to complete certain measure-ments.
127 patients
117 with FeNO data 106 with CRP
and TNF data
92 with sputum data for cell counts
and IL8 assay
70 patients with complete datasets for
well studied markers of airway [3,4] and systemic inflam-mation [13,20,21] as well as pulmonary function, by which COPD is classically defined [1]. Other important biomarkers of COPD pathophysiology, explaining further disease heterogeneity may not have been included. Never-theless, our study shows the potential utility of PCA, and further studies using other biomarkers of inflammation or clinical measurements would be of interest.
The results of PCA are critically dependent on the selec-tion of subjects. If particular subgroups of patients are included or excluded from the study, the sources of varia-tion in the dataset will be affected. A common issue in studies of airway sampling in COPD patients, either by induced sputum or FeNO, is that not all patients can com-plete each measurement [16]. We used a well validated approach to this issue, excluding cases pairwise where data was missing [14], so that all of the 92 patients with induced sputum data and 117 patients with FeNO data could be analysed where possible e.g. all of these data could be analysed against pulmonary function. We did not exclude patients who could not perform certain anal-ysis, as this may have introduced a bias into the dataset; e.g. certain patient phenotypes may produce less sputum than others, and by excluding such patients any such a phenotype would be poorly represented in the data set.
Factor analysis/PCA has been rarely used in COPD [16,22-25]. The sample for the currents study compares very favourably with these studies, which have often enrolled less than 100 subjects [22-25]. Indeed, even if we accounted for the incomplete measurements in the cur-rent study, the sample size of patients with a "complete dataset" (n = 70), is still larger than the enrolled sample size of some of these studies [16,22-25].
Recently, factor analysis has been used by Lapperre et al [16] in 114 COPD patients to generate hypothesis about disease description using many of the same parameters as the current study, but importantly systemic inflammation biomarkers were not investigated. A four factor solution was reported, with the character of the components being somewhat different to our findings. Firstly, a factor repre-senting asthma like parameters (i.e. reversibility, bron-chial hyper-reactivity and atopy) was identified. This may be due to some extent to differences in subject selection, as in our cohort subjects with asthma may have been more rigorously excluded, as atopic subjects were not recruited. Secondly, Lapperre et al reported a component including sputum percentage neutrophils and eosi-nophils, and that FeNO was not in the same component as
sputum eosinophils, which differs from our results. Important methodological issues should be considered; (a) Lappere et al used 2 different FeNO analysers, but it is known that data from different analysers generates signif-icantly different NO levels [26]. This could explain why FeNO was in a distinct component, as associations with other parameters were not possible as the absolute FeNO values were actually mostly dependent on the type of ana-lyser used rather than any patient characteristics (b) Laperre et al included both sputum eosinophil and neu-trophil % in the factor analysis, which together were found to form a distinct component. However, there is a mathematical relationship between these parameters (as one increases, the other decreases). The impact on PCA analysis is that the mathematical relationship between sputum percentages will cause these parameters to be associated within the same component, and may cause associations with other parameters, such as FeNO, to be overlooked. We used sputum total neutrophil cell count and sputum eosinophil percentage in the PCA to avoid this issue. Reassuringly, our PCA findings concerning FeNO and eosinophils were confirmed by multivariate modelling showing a significant association between these parameters.
The positive relationship between FeNO and sputum eosi-nophils has been observed in a smaller COPD group [27] but not by Siva et al [28] in 83 COPD patients. Again, measurement methodology may give an explanation for the lack of positive findings, as Siva et al used a flow rate of 250 ml/s, which is well known to give very low FeNO readings, particularly in COPD patients, and so may not be able to discriminate between patients.
Component 1 suggests that sputum neutrophils and the neutrophil chemoattractant IL-8 describe a distinct com-ponent of disease that is associated with systemic inflam-mation, measured by plasma TNFα levels. It is perhaps surprising that the other systemic inflammation biomar-ker that we measured, CRP, was not associated with air-way neutrophils. CRP is a known marker of cardiovascular
Scree plot showing Eigenvalues for components with a refer-ence line at Eigenvalue of 1
Figure 2
Scree plot showing Eigenvalues for components with a reference line at Eigenvalue of 1.
9 8 7 6 5 4 3 2 1
ComponentNumber
2.0
1.5
1.0
0.5 Eigenvalue
disease risk [29] and levels in COPD are associated with mortality [11], leading to the hypothesis that CRP levels are indicative of cardiovascular disease risk in COPD patients. A possible explanation for our findings is that neutrophilic airway inflammation is associated with some systemic inflammation pathways, such as TNFα which is known to be involved in muscle inflammation [20], but not CRP which is an indicator of cardiovascular disease.
Inhaled corticosteroid use was associated with CRP levels; this may be due to more severe patients with higher CRP levels being prescribed inhaled corticosteroids. Inhaled corticosteroid use was not associated with pulmonary function (component 3); this may be viewed as a surpris-ing findsurpris-ing as corticosteroids are used for patients with lower FEV1 values who have exacerbations. The reason for the lack of an association in the current study was proba-bly that the range of FEV1 values was relatively narrow, as
most patients had moderate COPD (GOLD stage 2), and that the inclusion of greater numbers of severe/very severe
patients would be needed to assess this relationship fur-ther.
It has been reported that sputum neutrophil counts [30] and IL-8 [31] levels are related to severity of airflow obstruction and subsequent decline in FEV1 in COPD.
Air-way tissue immunohistochemistry studies clearly show that mucosal inflammation is associated with lower FEV1 [32]. However, in agreement with the previous study by Laperre et al we found dissociation between airway inflammation and pulmonary function. This suggests that luminal inflammation, sampled by induced sputum, is not associated with FEV1. A strength of the current study in coming to this conclusion is the sample size used, and 2 independent statistical analysis techniques. However, it is possible that other population groups including more patients with very severe COPD may generate different results.
Our study population was composed of mainly GOLD stage 2 "moderate" COPD patients, although 26 severe/ very severe patients were also recruited. This mix of patients reflects our strategy of recruiting from primary care. It would be of interest to repeat the current study using more severe patients, perhaps recruited from hospi-tal clinics, to observe whether the same or different results are obtained.
We found that females with COPD had lower levels of FeNO than males, which has been shown to be true in
healthy controls [33]. Similarly, the associations of FeNO with age and with smoking that we observed have also previously been reported [34].
In summary, this study provides insights into the dimen-sions of COPD that can be described using non-invasive biomarkers of airway inflammation and pulmonary func-tion. Independent components representing different types of airway inflammation, lung function and systemic inflammation have been identified providing novel con-cepts with regards to COPD pathophysiology. We hope
Table 2: Pattern Matrix: Variable loadings for four component solution
COMPONENTS (% variance) Variables
Component Loadings
1 2 3 4
(1) Component 1(20.2%)
Sputum IL8 0.79
Sputum neutrophil TCC 0.72
Plasma TNFα 0.76
(2) Component 2 (18.2%)
Sputum eosinophil % 0.86
FeNO 0.85
(3) Component 3 (15.1%)
FEV1 0.78
Bronchodilator Reversibility 0.71
IC 0.50
(4) Component 4 (11.4%)
CRP 0.86
All variables shown load over 0.50 onto a single PCA component. IC; inspiratory capacity, FEV1; forced expiratory volume in 1 second, BMI; body mass index, FeNO; fractional exhaled nitric oxide, CRP; C-Reactive Protein, TNFα tumour necrosis factor-alpha, TCC; total cell count.
Table 3: Component Correlation Matrix
Component 1 2 3 4
1 1.000 .
2 .001 1.000
3 .029 .112 1.000
4 .246 -.078 -.020 1.000
Table 4: Summary of MANOVA showing significant predictors of the components; predictor variables included in the analysis were age, gender, ICS use, smoking status, smoking pack years and BMI
Component Independent Predictor P value
1 Nil
-2 Gender 0.04
Smoking status 0.001
Age 0.01
3 Nil
-4 ICS 0.03
that our results will provide an impetus to further explore the usefulness of these components in guiding clinical practice by assessing their ability to predict important fea-tures of COPD such as prognosis, systemic manifestations and treatment responses.
Competing interests
The authors declare that they have no competing interests.
Authors' contributions
KR conceived, designed and coordinated the study as well as performing a lot of the measurements in exhaled NO, spirometry, plethysmography, sputum induction and processing, peripheral blood sampling and statistical analysis. DS and JV helped to conceive the study and par-ticipated in its design. JS parpar-ticipated in the statistical analysis. UK performed sputum induction, sputum super-natant cytokine analysis and assays for CRP and TNF-alpha. ZB performed measurements in spirometry, plethysmography and peripheral blood sampling.
All authors read and approved the final manuscript.
References
1. Global Initiative for Chronic Obstructive Lung Disease (GOLD) 2008 [http://www.goldcopd.com].
2. Kharitonov SA, Barnes PJ: Exhaled biomarkers. Chest 2006, 130(5):1541-6.
3. Parr DG, White AJ, Bayley DL, Guest PJ, Stockley RA: Inflammation in sputum relates to progression of disease in subjects with COPD: a prospective descriptive study. Respir Res 2006, 7:136.
4. Brightling CE, Monteiro W, Ward R, Parker D, Morgan MD, Wardlaw AJ, Pavord ID: Sputum eosinophilia and short-term response to prednisolone in chronic obstructive pulmonary disease: a randomised controlled trial. Lancet 2000, 356(9240):1480-5. 5. Kharitonov SA, Robbins RA, Yates D, Keatings V, Barnes PJ: Acute
and chronic effects of cigarette smoking on exhaled nitric oxide. Am J Respir Crit Care Med 1995, 152(2):609-12.
6. Corradi M, Majori M, Cacciani GC, Consigli GF, de'Munari E, Pesci A: Increased exhaled nitric oxide in patients with stable chronic obstructive pulmonary disease. Thorax 1999, 54(7):572-5. 7. Papi A, Romagnoli M, Baraldo S, Braccioni F, Guzzinati I, Saetta M,
Ciaccia A, Fabbri LM: Partial reversibility of airflow limitation and increased exhaled NO and sputum eosinophilia in chronic obstructive pulmonary disease. Am J Respir Crit Care Med 2000, 162(5):1773-7.
8. Maziak W, Loukides S, Culpitt S, Sullivan P, Kharitonov SA, Barnes PJ: Exhaled nitric oxide in chronic obstructive pulmonary dis-ease. Am J Respir Crit Care Med 1998, 157(3 Pt 1):998-1002. 9. Gan WQ, Man SF, Senthilselvan A, Sin DD: Association between
chronic obstructive pulmonary disease and systemic inflam-mation: a systematic review and a meta-analysis. Thorax 2004, 59(7):574-80.
10. Sin DD, Man SF: Why are patients with chronic obstructive pulmonary disease at increased risk of cardiovascular dis-eases? The potential role of systemic inflammation in chronic obstructive pulmonary disease. Circulation 2003, 107(11):1514-9.
11. Man SF, Connett JE, Anthonisen NR, Wise RA, Tashkin DP, Sin DD: C-reactive protein and mortality in mild to moderate chronic obstructive pulmonary disease. Thorax 2006, 61(10):849-53.
12. Walter RE, Wilk JB, Larson MG, Vasan RS, Keaney JF Jr, Lipinska I, O' Connor GT, Benjamin EJ: Systemic inflammation and COPD: the Framingham Heart Study. Chest 2008, 133(1):19-25. 13. Broekhuizen R, Wouters EF, Creutzberg EC, Schols AM: Raised
CRP levels mark metabolic and functional impairment in advanced COPD. Thorax 2006, 61(1):17-22.
14. Tabachnick BG, Fidell LS: Using multivariate statistics. 4th edi-tion. Boston, USA. Allyn and Bacon; 2001.
15. Stevens JP: Applied multivariate statistics for the social sci-ences. 2nd edition. Hillsdale, New Jersey, USA. Erlbaum; 1992. Table 5: Table of results of the multivariate analyses performed to determine the independent associations between the variables
Independent Predictor
Dependent Variable
FeNO Sputum TCC Sputum
Neutrophil TCC
Sputum Neutrophil %
Sputum Eosinophil
TCC
Sputum Eosinophil
%
Sputum IL8
FeNO N/A NS NS P < 0.0001
R = -0.6
P < 0.0001 R = 0.7
P < 0.0001 R = 0.62
NS
Sputum IL8 NS NS P = 0.002
R = 0.57
P < 0.0001 R = -0.6
NS NS N/A
Plasma TNFα
NS NS P < 0.0001
R = 0.57
NS NS NS P = 0.01
R = 0.44
Smoking P < 0.0001
R = 0.72
(lower in smokers)
NS NS NS NS NS NS
Reversibility NS NS NS P = 0.01
R = -0.6
P = 0.02 R = 0.7
NS NS
Gender P = 0.04
R = 0.7 (lower in females)
NS NS NS NS NS NS
FEV1, IC, BMI, Bronchodilator reversibility, plasma CRP, ICS usage and smoking pack years did not predict any of the variables marking airway inflammation.
P and R values were determined by linear regression multivariate analysis. NS : No significant association.
Publish with BioMed Central and every scientist can read your work free of charge "BioMed Central will be the most significant development for disseminating the results of biomedical researc h in our lifetime."
Sir Paul Nurse, Cancer Research UK
Your research papers will be:
available free of charge to the entire biomedical community
peer reviewed and published immediately upon acceptance
cited in PubMed and archived on PubMed Central
yours — you keep the copyright
Submit your manuscript here:
http://www.biomedcentral.com/info/publishing_adv.asp
BioMedcentral
16. Lapperre TS, Snoeck-Stroband JB, Gosman MM, Stolk J, Sont JK, Jansen DF, Kerstjens HA, Postma DS, Sterk PJ: Dissociation of lung function and airway inflammation in chronic obstructive pul-monary disease. Am J Respir Crit Care Med 2004, 170(5):499-504. 17. Silkoff PE, Erzurum SC, Lundberg JO, George SC, Marczin N, Hunt JF,
Effros R, Horvath I: ATS workshop proceedings: exhaled nitric oxide and nitric oxide oxidative metabolism in exhaled breath condensate. Proc Am Thorac Soc 2006, 3(2):131-45. 18. Pizzichini E, Pizzichini MM, Efthimiadis A, Evans S, Morris MM,
Squil-lace D, Gleich GJ, Dolovich J, Hargreave FE: Indices of airway inflammation in induced sputum: reproducibility and validity of cell and fluid-phase measurements. Am J Respir Crit Care Med
1996, 154(2 Pt 1):308-17.
19. Wardlaw AJ, Silverman M, Siva R, Pavord ID, Green R: Multi-dimen-sional phenotyping: towards a new taxonomy for airway dis-ease. Clin Exp Allergy 2005, 35(10):1254-62.
20. Reid MB, Li YP: Tumor necrosis factor-alpha and muscle wast-ing: a cellular perspective. Respir Res 2001, 2(5):269-72. 21. Vestbo J, Prescott E, Almdal T, Dahl M, Nordestgaard BG, Andersen
T, Sorensen TI, Lange P: Body mass, fat-free body mass, and prognosis in patients with chronic obstructive pulmonary disease from a random population sample: findings from the Copenhagen City Heart Study. Am J Respir Crit Care Med 2006, 173(1):79-83.
22. Taube C, Lehnigk B, Paasch K, Kirsten DK, Jorres RA, Magnussen H: Factor analysis of changes in dyspnea and lung function parameters after bronchodilation in chronic obstructive pul-monary disease. Am J Respir Crit Care Med 2000, 162(1):216-20. 23. Wegner RE, Jorres RA, Kirsten DK, Magnussen H: Factor analysis
of exercise capacity, dyspnoea ratings and lung function in patients with severe COPD. Eur Respir J 1994, 7(4):725-9. 24. Nguyen HQ, Altinger J, Carrieri-Kohlman V, Gormley JM, Stulbarg
MS: Factor analysis of laboratory and clinical measurements of dyspnea in patients with chronic obstructive pulmonary disease. J Pain Symptom Manage 2003, 25(2):118-127.
25. Mahler DA, Harver A: A factor analysis of dyspnea ratings, res-piratory muscle strength, and lung function in patients with chronic obstructive pulmonary disease. Am Rev Respir Dis 1992, 145(2):467-470.
26. Borrill Z, Clough D, Truman N, Morris J, Langley S, Singh D: A com-parison of exhaled nitric oxide measurements performed using three different analysers. Respir Med 2006, 100(8):1392-6. 27. Rutgers SR, Mark TW van der, Coers W, Moshage H, Timens W, Kauffman HF, Koeter GH, Postma DS: Markers of nitric oxide metabolism in sputum and exhaled air are not increased in chronic obstructive pulmonary disease. Thorax 1999, 54(7):576-80.
28. Siva R, Green RH, Brightling CE, Shelley M, Hargadon B, McKenna S, Monteiro W, Berry M, Parker D, Wardlaw AJ, Pavord ID: Eosi-nophilic airway inflammation and exacerbations of COPD: a randomised controlled trial. Eur Respir J 2007, 29(5):906-13. 29. Ridker PM, Rifai N, Rose L, Buring JE, Cook NR: Comparison of
C-reactive protein and low-density lipoprotein cholesterol lev-els in the prediction of first cardiovascular events. N Engl J Med 2002, 347(20):1557-65.
30. Stanescu D, Sanna A, Veriter C, Kostianev S, Calcagni PG, Fabbri LM, Maestrelli P: Airways obstruction, chronic expectoration, and rapid decline of FEV1 in smokers are associated with increased levels of sputum neutrophils. Thorax 1996, 51(3):267-71.
31. Wilkinson TM, Patel IS, Wilks M, Donaldson GC, Wedzicha JA: Air-way bacterial load and FEV1 decline in patients with chronic obstructive pulmonary disease. Am J Respir Crit Care Med 2003, 167(8):1090-5.
32. Hogg JC: Pathophysiology of airflow limitation in chronic obstructive pulmonary disease. Lancet 2004, 364(9435):709-21. 33. Olivieri M, Corradi M, Malerba M: Gender and exhaled nitric
oxide. Chest 2007, 132(4):1410.