MATERNAL ADHERENCE TO A MEDITERRANEAN DIET DURING PREGNANCY, INFANT DNA METHYLATION AT BIRTH AND WEIGHT GAIN IN INFANCY
Sarah Gonzalez-Nahm
A dissertation submitted to the faculty at the University of North Carolina at Chapel Hill in partial fulfillment of the requirements for the degree of Doctor of Philosophy in the Department of
Maternal and Child Health in the Gillings School of Global Public Health.
Chapel Hill 2016
© 2016
ABSTRACT
Sarah Gonzalez-Nahm:Maternal Adherence to a Mediterranean Diet During Pregnancy, Infant DNA Methylation at Birth and Weight Gain in Infancy
(Under the direction of Diane Rowley)
The purpose of this dissertation is to examine the association between maternal adherence to a Mediterranean diet during pregnancy, infant DNA methylation at birth at 5 differentially methylation regions (DMRs) of imprinted genes, and weight gain in the first year of life. The first paper of this dissertation uses multinomial logistic regression models to determine the association between maternal adherence to a Mediterranean diet in early pregnancy and infant DNA methylation at birth. Results suggested an association between a lower level of methylation at the MEG3 IG DMR and lower adherence to a Mediterranean diet. This
association was only evident in girls. The second paper focused on the association between infant DNA methylation at birth and weight gain between birth and age 1, as measured by change in weight-for-length Z scores. Results of linear regressions showed that a higher methylation level at the MEG3 DMR was associated with a lower weight gain in the first year of life. This association was evident in boys and in infants with lower than the median birth weight for the study sample. In the third aim, the potential mediation by DNA methylation in the
TABLE OF CONTENTS
LIST OF TABLES ... vii
LIST OF ABBREVIATIONS ... viii
CHAPTER 1- INTRODUCTION ... 1
Childhood Obesity ... 1
Epigenetics ... 2
Obesity and Assessment of Infant Weight Gain ... 4
Maternal Diet ... 4
Maternal Diet and Epigenetics ... 5
Mediterranean Diet... 6
Study Overview ... 7
Differentially Methylation Regions ... 7
CHAPTER 2- AIM1: MATERNAL ADHERENCE TO A MEDITERRANEAN DIET IS ASSOCIATED WITH INFANT SEX-SPECIFIC DNA METHYLATION AT INTERGENIC DIFFERENTIALLY METHYLATED REGION REGULATING THE DLK1/MEG3 IMPRINTED DOMAIN ... 9
Introduction ... 9
Methods ...11
Study Sample and Data Collection ...11
DNA Methylation ...13
Diet Assessment ...14
Statistical Analysis ...16
Results ...17
CHAPTER 3- AIM 2: INFANT DNA METHYLATION AT BIRTH AND WEIGHT
GAIN IN THE FIRST YEAR OF LIFE ...28
Introduction ...28
Methods ...29
Study Sample and Data Collection ...29
Infant Anthropometric Data ...31
DNA Methylation ...31
Statistical Analysis ...32
Results ...34
Change in WLZ Scores Between Birth and Age 1 ...34
Change in LAZ Scores Between Birth and Age 1 ...35
Discussion ...36
CHAPTER 4- AIM 3: MATERNAL ADHERENCE TO A MEDITERRANEAN DIET PATTERN, INFANT DNA METHYLATION AT BIRTH, AND WEIGHT GAIN IN THE FIRST YEAR OF LIFE: A SIMPLE MEDIATION ANALYSIS ...45
Introduction ...45
Methods And Discussion ...46
Study Sample ...47
Mediation ...48
CHAPTER 5- CONCLUSIONS ...50
Overview of Findings ...50
Limitations ...51
Selection Bias and Generalizability ...52
Recall and Information Bias ...53
Implications ...53
APPENDIX 2. CHARACTERISTICS OF POSSIBLE OVER/UNDER-REPORTERS OF ENERGY INTAKE, NEWBORN EPIGENETIC STUDY ...57 APPENDIX 3. UNADJUSTED AND ADJUSTED1 MULTINOMIAL LOGISTIC
REGRESSION OF THE ASSOCIATION BETWEEN MATERNAL ADHERENCE TO A MEDITERRANEAN DIET DURING PREGNANCY AND INFANT DNA METHYLATION AT BIRTH – ANALYSIS EXCLUDING DAIRY FROM MDS SCORING, NEWBORN EPIGENETIC STUDY. ...58 APPENDIX 4. CHARACTERISTICS OF STUDY SAMPLE BY DAIRY INTAKE, NEWBORN EPIGENETIC STUDY ...59 APPENDIX 5. CONDENSED RESULTS OF SIMULATIONS ADDING
BREASTFEEDING TO REGRESSION OF THE ASSOCIATION BETWEEN INFANT MEG3 METHYLATION AT BIRTH AND RELATIVE WEIGHT GAIN IN INFANCY, NEWBORN EPIGENETIC STUDY ...60 APPENDIX 6. TABLE OF UNADJUSTED AND ADJUSTED RESULTS OF LINEAR
LIST OF TABLES
Table 1. Characteristics of mothers and infants in the NEST cohort by
LIST OF ABBREVIATIONS
BMI body mass index
CDC Centers for Disease Control and Prevention CI confidence interval
CpG cytosine-phosphate-guanine DAG directed acyclic graph DLK1 Delta-like homolog 1
DMR differentially methylated region DNA Deoxyribonucleic acid
EER estimated energy requirement EMM effect measure modification FFQ food frequency questionnaire IGF2 Insulin growth factor 2
KCAL kilocalorie
KG kilogram
LAZ length-for-age
MDS Mediterranean diet score MEG3 Maternally expressed gene 3
MEG3 IG Maternally expressed gene 3 intergenic MUFA monounsaturated fatty acid
NEST Newborn Epigenetic Study
OR odds ratio
PLAGL1 Pleiomorphic adenoma gene-like 1 SD standard deviation
SRS Silver Russell Syndrome WLZ weight-for-length
CHAPTER 1- INTRODUCTION
Childhood Obesity
Childhood obesity is a major public health concern in the United States and around the world. Obesity in childhood is a risk factor for obesity later in life1–3, and is associated with a number of chronic diseases in both childhood4,5 and adulthood6. In the United States, approximately 17% of children and adolescents ages 2-19 years are obese7. While overall childhood obesity rates have not changed much in recent years, the disparity in obesity rates between African Americans and Latinos, and non-Hispanic whites has continued. An alarming 24.3% of Black children and 21.2% of Hispanic children are obese, while only 14% of non-Hispanic White children are obese7.
Obesity is a multifactorial condition, with environmental and biological risk factors and mechanisms. Environmental factors, such as diet and feeding practices8,9, physical activity8, the built environment10, and social factors, such as race7,11,12 and socioeconomic status11,12 have been associated with the development and incidence of obesity in young children. Identification of early obesity predictors may help prevent the onset of obesity later in life. Weight gain in infancy has been shown to be a predictor of obesity later in life13–15. Research has shown that rapid weight gain in infancy increases obesity risk as early as 2-4 years of age13,16,17, but also in adolescence2,18 and adulthood14,15.
“high risk” individuals. This could allow for better targeting of public health interventions for obesity prevention and health over the life course.
Dutch famine studies have demonstrated that there are critical or sensitive periods, during which environmental factors or metabolic insults may have a greater influence on
health23,24. The in-utero period is a critical time window, during which a growing embryo or fetus may be negatively affected by maternal exposures. These effects may present themselves early in life and last throughout the life course4, or may manifest themselves later in life20,21.
Mechanisms for the in utero origins of obesity have yet to be established, however there is a growing literature suggesting potential epigenetic processes25–27.
Epigenetics
Epigenetics is the study of changes to gene expression caused by mechanisms other than the underlying DNA sequence28,29. DNA methylation is the most commonly studied epigenetic mechanism in epidemiological models due to its stability and the ease with which it can be measured30. DNA methylation occurs at cytosines that are followed by guanines i.e. CpG dinucleotides, which exist within differentially methylated regions (DMRs)28,31. Changes in DNA methylation as a result of early exposures can be measured at specific sites32,33, genome-wide34,35, or globally36,37. DNA methylation can be measured in many cell types, including leukocytes from umbilical cord blood, as well as a variety of tissues. In human studies, tissue-specific DNA methylation is not readily obtainable due to ethical issues, therefore cord blood or peripheral blood are typically used. There is evidence suggesting that there are no significant differences between DNA methylation at DMRs regulating imprinted genes from conceptal tissues and cord blood38.
As in-utero exposures are of interest, it is important to consider imprinted genes.
regulatory sequences of imprinted genes is established during gametogenesis and is stably maintained throughout somatic division40,41. Parental origin-specific methylation profiles are spatially and temporally stable, such that methylation changes at imprinted gene DMRs resulting from in utero exposures can been seen later in life. For example, exposure to famine conditions in-utero has been detected decades post-exposure23,24.
Epigenetic modifications can occur as a result of a variety of exposures. Thus far, animal models and epidemiological studies have shown that nutritional manipulations, such as the addition of methyl donors or the restriction of protein, can alter DNA methylation42–44.
Environmental toxicants, such as cigarette smoke45, cadmium46, and lead47,48 have also been found to affect the human epigenome. However, the phenotypes associated with these epigenetic changes are not well-known.
There is still insufficient and inconsistent evidence linking epigenetic mechanisms to obesity and weight gain in humans. Studies vary by DNA locus chosen, epigenetic mechanism examined, and timing of the outcome or exposure. Many studies looking at the epigenetic changes associated with obesity have not focused on the in-utero period49, or have focused on non-imprinted genes50. To date, the insulin growth factor 2 (IGF2)/H19 domain has been associated with fetal growth51,52, child/adolescent weight and adiposity53,54, and adult obesity and chronic disease23,33,55. Other imprinted genes that have been found in association with growth and/or obesity include maternally expressed gene 3 (MEG3)55 and pleiomorphic adenoma gene-like 1 (PLAGL1)55,56. Methylation in non-imprinted genes, such as peroxisome proliferator-activated receptor (PPAR)57, matrix metallopeptidase 9 (MMP9)58, and retinoid x receptor alpha (RXRA)50 has also been found in association with obesity. However, the heritability, malleability and significance of the epigenetic changes in non-imprinted genes is unknown. More research is needed to understand the role of and key players in DNA
Obesity and Assessment of Infant Weight Gain
Obesity in children ages 2-19 years is defined as a body mass index (BMI) greater than or equal to the 95th percentile for age and sex. There is currently no formal definition for obesity in children younger than two years of age7. However, a variety of measurements are regularly used to assess body weight59, depending on the availability of information. Weight-for-length Z scores, weight-for-age Z scores, and BMI are often used to measure body mass and fatness in infants, as they are easily and inexpensively obtained. BMI, calculated as an individual’s weight divided by their height squared, can be useful if comparing infant weight to weight later in childhood, when BMI is regularly used and accepted as a measure of obesity. However, it is not generally recommended to use BMI as an obesity measure, as there is insufficient research on the meaning of BMI calculated from recumbent length vs height and how that relates to obesity. Weight-for-length Z (WLZ) scores and Weight-for-age Z (WAZ) scores have also been used as ways to measure obesity. However, WLZ scores are generally regarded as a better measure of body fatness in infancy than WAZ scores, as they measure relative weight. There is also evidence showing an association between WLZ scores and obesity. According to World Health Organization (WHO) standards, obesity is classified as a WLZ score greater than 3 and
overweight is classified as a WLZ score greater than 260. Weight gain in infancy, as measured by change in WLZ scores has also been associated with weight and obesity later in life13. Weight gain can be measured continuously, or as a binary variable, in which rapid weight gain has been previously defined as a change in anthropometric Z scores of +0.67 SD61 from the mean.
Maternal Diet
Maternal diet and nutritional status during pregnancy can influence the fetal
under67 nutrition can affect offspring health in similar ways. Studies conducted on survivors of the Dutch famine of 1944-45 found that individuals affected by famine in-utero had a higher incidence of a number of chronic diseases, including type 2 diabetes23. In addition, a study of mothers in India found that consuming micronutrient-rich foods during pregnancy was
associated with fetal size at birth68. Animal models have shown that protein restriction during pregnancy in rats can result in hypertension69, increased fat deposition67, altered feeding behavior and preferences70, and other cardio-metabolic outcomes in offspring71. Conversely, a diet that is excessive in certain macronutrients, such as fat, can also have an effect on fetal biomarkers, and can have lifelong consequences. Murabayashi, et al66. found that rat fetuses of mothers fed a high fat diet during gestation, had higher levels of plasma glucose and insulin, and inflammatory change in adipose tissue compared to those whose mothers were fed a normal fat diet. Another study found that children whose mothers consumed a diet high in sugar during pregnancy had an increased odds of obesity at age 5 compared to children whose mothers did not have a high sugar intake during pregnancy72.
Maternal Diet and Epigenetics
DNA methylation and may even be protect offspring from becoming obese later in life, despite a genetic predisposition to become obese32. Waterland and colleagues76 also found that the addition of methyl donors to the diet of pregnant obese agouti mice can prevent the amplification of obesity in future generations, suggesting that epigenetic mechanisms are affected by this dietary change. There is also evidence to suggest that a maternal high fat diet can result in global hypomethylation, which may be reversed or improved with the addition of methyl donor nutrients to the diet77.
Mediterranean Diet
The consumption patterns of individuals living in the Mediterranean have been studied extensively. The literature suggests that a high adherence to a Mediterranean diet is generally characterized by a high intake of vegetables, legumes, fruits and nuts, fish, grains, a high monounsaturated fat (MUFA) to saturated fat (SFA) ratio, moderate alcohol consumption, and low consumption of other meats and dairy products78,79. Many variations exist in terms of actual foods consumed as part of a Mediterranean diet based on geographical region80,81. Despite this, several indexes and scores have been created to measure adherence to a Mediterranean diet pattern, including the Mediterranean diet score (MDS), a median-based score developed by Trichopoulou, et al78,79, the Mediterranean Adequacy Index82 (MAI), and the Mediterranean Diet Quality Index83 (DQI). The MDS has been showed to reliably capture what is commonly
understood as a Mediterranean diet pattern84, and is widely used in research.
epigenetic effects of overall maternal adherence to a Mediterranean diet pattern have not been studied.
Study Overview
To address the gaps in the literature, this study aims to
Aim 1: Estimate the relationship between maternal Mediterranean diet adherence and infant DNA methylation at birth
Aim 2:Determine the association between infant DNA methylation at birth and infant weight gain between birth and age one
Aim 3: Assess the relationship between maternal Mediterranean diet adherence, infant DNA methylation at birth, and infant weight gain between birth and age one
Differentially Methylation Regions
In this study, we focus on the following five DMRs of imprinted genes due to their role in growth52,56, weight53,56, chronic disease90 and parental obesity33,55:
1) MEG3 and 2) MEG3 intergenic (IG): Location: chromosome 14q32.238.
Both the MEG3 IG and MEG3 DMRs are thought to regulate the MEG3/Delta-like 1 homolog (DLK1) region, however, it is thought that the MEG3 IG DMR may function
hierarchically as an upstream regulator in the methylation patterns of the MEG3 DMR91. MEG3 is found on the MEG3 promoter, and MEG3 IG is located between the MEG3 and DLK1
long non-coding RNAs has been associated with insulin resistance and type 2 diabetes90. More drastic changes to MEG3 and MEG3 IG, such as loss of imprinting and microdeletions have resulted in paternal/maternal uniparental disomy 1491.
3) PLAGL1 (also known as ZAC1): Location: chromosome 6q24.255.
PLAGL1 is a tumor suppressor gene, and is thought to be part of a network of co-regulated genes believed to play an important role embryonic and postnatal growth56. In addition, PLAGL1 has been shown to be hypermethylated in infants at birth in association with maternal obesity55. Also, loss of imprinting at PLAGL1 is associated with transient neonatal diabetes mellitus syndrome (TNDM) in infants96.
4) IGF2: Location: chromosome 11p15.538.
IGF2 is located upstream of the imprinted promoters of IGF238. Changes in IGF2 methylation have been associated with fetal growth51,52, maternal sociodemographic factors97, lead exposure47,48, in-utero cigarette smoke exposure45, paternal obesity33, renal cancer, and Wilm’s tumors39.
5) H19: Location: chromosome 11p15.538.
CHAPTER 2- AIM1: MATERNAL ADHERENCE TO A MEDITERRANEAN DIET IS ASSOCIATED WITH INFANT SEX-SPECIFIC DNA METHYLATION AT INTERGENIC DIFFERENTIALLY METHYLATED REGION REGULATING THE DLK1/MEG3 IMPRINTED
DOMAIN
Introduction
The developmental origins of health and disease hypothesis (DOHaD) posits that in utero exposures play a critical role in the risk of adult disease100. Maternal diet during pregnancy is an important exposure that is part of the in utero environment. Although mechanisms are still poorly understood, a growing consensus suggests that these exposures may act, at least in part, through epigenetic mechanisms25,31,21, i.e., changes in gene expression caused by
mechanisms other than the underlying DNA sequence28,29. DNA methylation is the most studied mechanism in epidemiologic studies, in part due to the stability of the DNA molecule and
covalent bonding.
Maternal intake of methyl donor nutrients during the prenatal period has been shown to affect DNA methylation in offspring73,103,32,104, suggesting that maternal factors, such as diet, can stably alter the in utero environment and health outcomes over the lifecourse42,57,105,106. Both maternal over- and under-nutrition can influence the offspring in utero environment and lead to fetal programming21-25. However, the majority of such studies have examined single nutrients, or have been conducted using animal models in well-controlled environments. Studies looking at overall diet patterns allow for the exploration of food interactions and synergy that cannot be studied when evaluating nutrients in isolation, or studying animal diets with a prescribed
distribution of macro and micronutrients. Foods have a variety of components and effects on the body, and some may act in synergy with or may interfere with the absorption of other diet
components107. Epidemiological studies exploring overall diet patterns in relation to epigenetic outcomes are needed to gain a better understanding of the influence of diet on DNA
methylation.
methylation at LINE-1 among healthy non-pregnant women116. No studies have looked at the potential epigenetic mechanisms of the in utero effects of the Mediterranean diet pattern.
In this study we assessed the associations between maternal adherence to a
Mediterranean diet pattern during early pregnancy and infant DNA methylation at birth in an ethnically diverse cohort. DNA methylation at birth was studied at five DMRs of imprinted genes. These regions were selected for their involvement in growth117, obesity33,55, and common
chronic disease90. The selected regions include the MEG3 IG DMR and the MEG3 DMR, which are involved in regulating the delta-like 1 homolog/maternally expressed gene 3 (DLK1/MEG3) imprinted domain on chromosome 14q32.2; the IGF2 DMR and the H19 DMR , which are involved in imprinting of the insulin growth factor 2/H19 (IGF2/H19) domain on chromosome 11p15.5, which are located upstream of the imprinted promoters of IGF2 and at the imprinting control region for the IGF2/H19 imprinted domain near the H19 promoter, respectively; and the PLAGL1 DMR, which resides at the pleiomorphic adenoma gene-like 1 (PLAGL1) locus on chromosome 6q24.2. We expect that a low adherence to a Mediterranean diet pattern will result in aberrant DNA methylation at these five DMRs.
Methods
Study Sample and Data Collection
the following three years. Of 2548 women who met the eligibility criteria, 1700 (67%) were consented and enrolled. Upon enrollment, mothers completed questionnaires providing information on socio-demographic factors and lifestyle characteristics. At delivery, birth outcomes were abstracted from medical records and infant cord blood specimens were
obtained to assess offspring methylation. Medical records were abstracted to verify gestational diabetes diagnosis and other medical conditions, birth weight and the newborn’s sex.
Of 1700 who enrolled, 396 women were excluded for a variety of reasons, including infant death during or soon after birth, being illiterate, underage, refusing further participation, or who could no longer be found. Given the malleability of DNA methylation patterns in early gestation, we are only including women who completed FFQs relating to preconception or the first trimester (N= 870). Mothers who responded to the FFQ were significantly different than mothers who did not complete and FFQ with respect to race, education, age, BMI, and smoking status (data not shown). Women with extreme implausible energy intakes, defined in our study as an intake of less than 500 kcal/day or greater than 7000 kcal/day, were excluded from our study (N=36). The ratio of estimated energy requirement (EER) to reported energy intake was calculated to assess possible over and under-reporting (defined as EER:kcal greater or less than ± 2 SD118). Rather than exclude the possible over/under reporters, a sensitivity analysis was conducted to assess the influence of possible over and under reporting of energy intake on our results. DNA methylation was analyzed from cord blood for the first 550 study infants after exclusions for infant death, illiteracy, being underage, refusal of further participation, and
(FFQ), who did not have extreme high or low reported caloric intakes, and whose infants had DNA methylation data available from cord blood analysis.
Dietary data were collected through a Block FFQ119 that had been modified to represent diet patterns in North Carolina. Diet data collection was attempted at enrollment, and at least once during each trimester. The FFQ collected data on intake frequencies of over 150 food items and supplements, and was administered to reflect intake during three periods: 1) the peri-conception period, 2) the first trimester, and 3) the second and third trimesters. For this study, only peri-conceptional and first trimester FFQs will be used, as methylation markers of imprinted genes are malleable in the first days of pregnancy. FFQ responses were analyzed by
NutritionQuest (www.nutritionquest.com). Reported intake portions and frequencies were assessed and converted to grams for statistical analysis.
DNA Methylation
Infant cord blood specimens were collected at birth. Samples were collected in EDTA-containing vacutainer tubes and centrifuged using standard protocols to allow for collection of plasma and buffy coat, with buffy coat used for DNA extraction (Qiagen; Valencia, CA).
Specimens were stored at -80°C until the time of analysis. DNA was extracted using Puregene reagents according to the manufacturer’s protocol (Qiagen), and quantity and quality were assessed using a Nanodrop 1000 Spectrophotometer (Thermo Scientific; Wilmington, DE). Infant genomic DNA (800 ng) was modified by treatment with sodium bisulfite using the EZ DNA Methylation kit (Zymo Research; Irvine, CA). Bisulfite treatment of denatured DNA converts all unmethylated cytosines to uracils, leaving methylated cytosines unchanged, allowing for
quantitative measurement of cytosine methylation status. Pyrosequencing was performed using a PyroMark Q96 MD pyrosequencer (Qiagen). Pyrosequencing assay design, genomic
amplification product. Defined mixtures of fully methylated and unmethylated control DNAs were used to show a linear increase in detection of methylation values as the level of input DNA methylation increased (Pearson r is 0.99 for all DMRs). Once optimal conditions were defined, each DMR was analyzed using the same amount of input DNA from each specimen (40 ng, assuming complete recovery following bisulfite modification of 800 ng DNA). Percentage of methylation for each CpG cytosine was determined using Pyro Q-CpG software (Qiagen). Pyrosequencing assays were performed in duplicate for all specimens whose values fell more than two standard deviations above or below the means in which case the average of the two runs was used. The values obtained represent the mean methylation for the CpG sites contained within the sequence being analyzed.
Diet Assessment
Given the malleability of methylation markers of imprinted genes in the early stages of gestation, mothers’ Mediterranean diet adherence was assessed using data from preconception and first trimester FFQs. Intakes were converted to grams/1000 kcals to account for differences in caloric intake, and scored with a modified version of Trichopolou’s Mediterranean Diet Score (MDS)78. Briefly, the MDS assigns values of zero or one to each of nine indicated components, using the population medians of each component among the participants as cut-points. People whose consumption of presumed beneficial components (vegetables, legumes, fruits/nuts, cereals, fish) was at or above the median consumption were assigned a value of one, and a value of zero otherwise. People whose consumption of presumed detrimental components (meat and dairy products) was below the median consumption were assigned a value of one, and zero otherwise. A value of one was given to those consuming a moderate level of alcohol, and a value of one was assigned to those whose ratio of monounsaturated fatty acid to
For this study, the MDS was modified as follows: 1) Fruits and nuts were separated into 2 groups
2) The grains category was refined refinement to reflect only whole grain intake 3) The alcohol group was removed, as reported alcohol intake for mothers during
pregnancy in this study was extremely low and alcohol consumption during pregnancy is not advised
4) Dairy was assessed as a “beneficial” food group rather than a “detrimental” food group, as intake of calcium is important during pregnancy.
The diet components for this study were as follows:
1) Fruit (including fresh, dried, and frozen fruit, but excluding fruit juice) 2) Vegetables (excluding vegetable juice and white potatoes)
3) Nuts and seeds (including nut butters) 4) Beans and legumes (including soy beans) 5) Whole grains and whole grain products
6) Dairy (including full fat dairy, but excluding dairy desserts) 7) Fish
8) The ratio of mono-unsaturated fat to saturated fat intake
9) Meats (including red meat, pork, poultry, game, excluding processed meats)
Statistical Analysis
Chi-square and Kruskal-Wallis tests were conducted to assess associations between potential covariates and Mediterranean diet adherence. Multinomial logistic regression models were used to estimate the associations between maternal adherence to a Mediterranean diet and infant DNA methylation at birth. Continuous modified Mediterranean diet scores (MMDS) were categorized to reflect 3 groups of roughly the same size, with scores between 0-3 being considered “low adherence”, scores of 4-5 being considered “medium adherence”, and scores of 6-9 being considered “high adherence”. “High adherence” was used as the reference category. Mean DNA methylation values were used in this analysis, as previously reported Cronbach’s alpha for correlations among methylation values from all CpGs measured at each DMR was >0.8994. Normality of the percent methylation of each DMR was assessed using the Kolmogorov-Smirnov test. As 4 of the 5 DMRs tested in this sample were not normally
distributed (data not shown), DNA methylation was then assessed in tertiles
(“hypo-methylation”, “moderate (“hypo-methylation”, and “hyper-methylation”). Given the theoretical 50% expected methylation of imprinted genes, the “mid-level” category of DNA methylation was used as the referent. Likelihood ratio tests (LRT) were performed to test for the interaction of
association between an infant’s sex and maternal diet on infant DNA methylation at birth (α=0.20). The addition of an interaction term for infant’s sex In 3 of the 5 DMRs assessed (MEG3, MEG3 IG, H19) was significant, therefore sex-specific adjusted models are presented in addition to overall models.
activity), maternal methyl donor intake (sum of total folate from diet and supplements, total choline from diet), processed meats, total energy intake, % total fat in the diet, plate. Covariates of interest were added one by one into the original, unadjusted model. Those that changed the estimates by more than 10% or that were deemed important from the literature were included into the final model. Final adjusted models included the following covariates: maternal pre-pregnancy BMI, maternal age, maternal smoking during pre-pregnancy, maternal education. As the role of dairy in the Mediterranean diet is controversial, we also conducted a sensitivity analysis, in which we removed dairy from the diet score. All statistical analyses were conducted using SAS 9.4 (SAS Institute, Inc).
Results
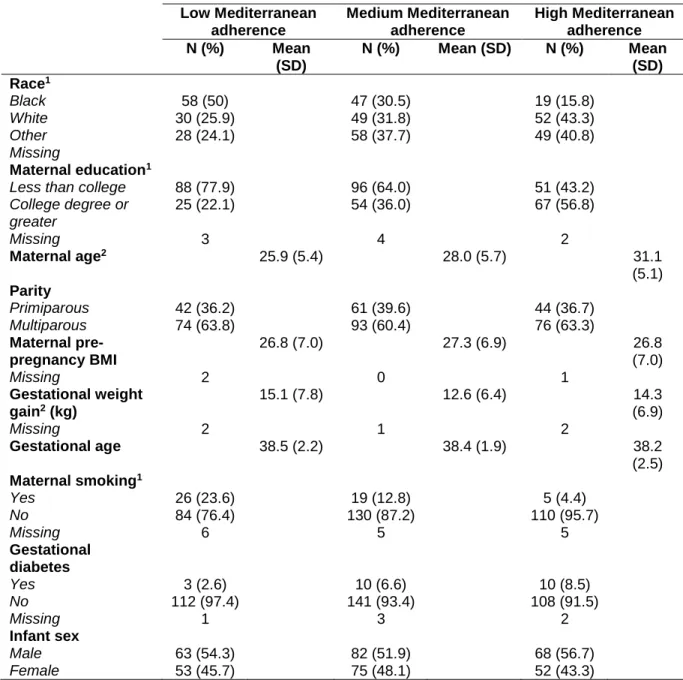
The characteristics of the study population by Mediterranean diet adherence level are displayed in table 1. Women with the highest adherence to a Mediterranean diet pattern were more likely to be White, have completed a college degree or more, were on average older (mean: 31.1 years), had lower gestational weight gain (mean: 14.3 kg), and were less likely to be smokers (4.4%). Women with the lowest adherence to a Mediterranean diet pattern were more likely to be Black, have earned less than a college degree, were on average younger (mean: 25.9 years), had greater gestational weight gain (mean: 15.0 kg), and were more likely to be smokers (23.4%). No statistically significant differences were found between diet
over-reporters of energy intake were on average younger (mean age=25.2) and had a significantly greater reported intake of vegetables, non-processed meats, and dessert foods compared to possible “moderate” energy reporters.
Maternal diet characteristics by Mediterranean diet adherence category are shown in Appendix 1. Women’s total caloric intake, % calories from protein, % calories from saturated fat, % calories from omega-3 fatty acids, fruit, vegetables, legumes, nuts, whole grains, dairy, fish, non-processed meats, and MUFA:SFA were significantly different by Mediterranean diet adherence category, with women in the highest diet adherence group ingesting the fewest calories, having greater protein, omega-3, fruit, vegetable, nut, legume, fish, dairy, whole grain intake, greater MUFA:SFA, and lower saturated fat and non-processed meat intake than those in lower adherence categories.
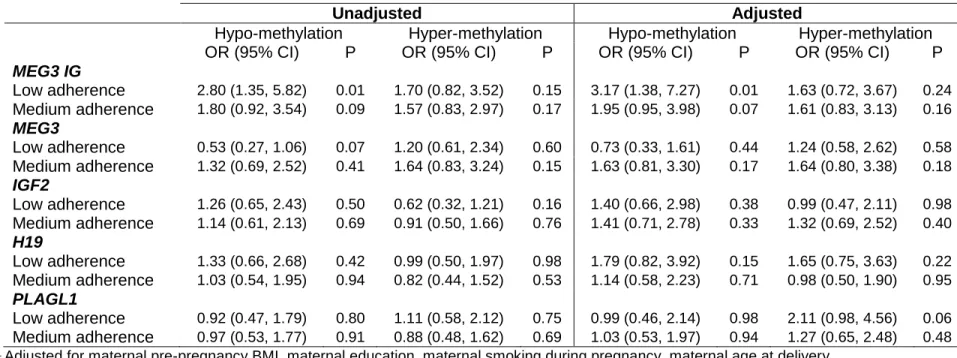
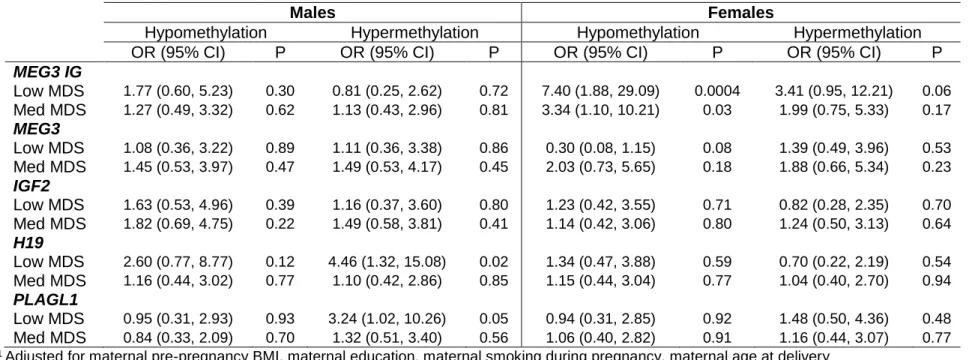
Results from the total unadjusted models (table 2) show that a low adherence to a Mediterranean diet pattern during pregnancy is associated with a higher odds of infant lower methylation at the MEG3 IG region (OR=2.80; 95% CI=1.35-5.82). This association is strongest and statistically significant only in girls (OR=5.35, 95% CI=1.56-18.36 – unadjusted data not shown). At the MEG3 region, low Mediterranean diet adherence was associated with a lower odds of lower methylation (OR=0.51; 95% CI=0.26-1.03). This relationship was also statistically significant in girls only (OR=0.24, 95% CI=0.07-0.77). In general, sex-specific models showed a difference in magnitude, and in some cases, direction of association in one sex compared to the other (see table 3 for sex-specific adjusted estimates).
After adjustment, the associations at the MEG3 IG DMR persisted (OR=3.17; 95% CI= 1.38-7.27), even after the stringent Bonferroni correction (0.05/5=0.01). In girls this association was further strengthened (OR=7.40, 95% CI= 1.88-29.09), however confidence intervals became wider. Notably, after adjustment the strength of association between medium
a Mediterranean diet pattern increased and became statistically significant. However the confidence intervals became wider, and the results were no longer statistically significant after Bonferroni correction (MEG3 IG: OR= 3.34, 95% CI= 1.10-10.21; H19: OR= 4.46, 5% CI= 1.32-15.08; PLAGL1: OR= 3.24, 95% CI= 1.02-10.26).
The results of the sensitivity analysis, in which we removed dairy from the diet score are available in the appendix (Appendix 3). In this alternate model we observed an attenuation and loss of statistical significance of our results (Adjusted OR= 1.31; 95% CI= 0.56-3.06). Adding dairy as a covariate did not substantially change our results, but adding calcium did (Adjusted OR= 1.8; 95% CI= 0.90-3.62). Women who had at or above the median consumption of dairy had a significantly greater calcium intake, but not significantly different saturated fat or total fat than women who reported below the median consumption of diary (Appendix 4). And women who had at or above the median dairy intake were also more likely to be White, have a higher level of education, and were on average older than women who reported below the median intake of dairy. Women who had a higher intake of dairy were more likely to be high adherers to a Mediterranean diet when the score incorporated dairy than when it did not (results not shown).
Discussion
We observed a decreased level of methylation at the MEG3 IG DMR among girls in response to low and medium maternal adherence to a Mediterranean diet pattern after adjusting for maternal age, maternal education, maternal pre-pregnancy BMI, and maternal smoking. Deregulation of the MEG3 IG DMR has been found in cancer tissues120, and it is believed that the MEG3 IG region may be an upstream regulator of the MEG3 DMR91, which has been associated with type 2 diabetes90. As the Mediterranean diet has been associated with
lower levels of methylation at MEG3 IG are not yet known. Our study’s small sample size did not allow for mediation analysis to study child outcomes, therefore future studies will need to
investigate the phenotypes associated with maternal diet and methylation at the MEG3 IG DMR to better understand the implications of these results.
This is one of a few studies that has looked at and reported sex-specific differences in DNA methylation of imprinted genes45,122. Tobi, et al observed sex-specific associations between prenatal famine exposure and methylation at the LEP, INSIGF, and GNAS DMRs. Murphy, et al found an increase in IGF2 methylation in association with prenatal smoking that was most prominent in boys. Thus far no other published studies have reported sex-specific associations at the MEG3 IG DMR. Our findings support the idea that DNA methylation may occur in a sex-specific manner, and contribute to the growing literature on sex-specific DNA methylation.
Surprisingly, no statistically significant associations were observed at the IGF2 DMR in this study. Previous studies looking at maternal nutrition during pregnancy have found
associations between supplementation with B vitamins and increases in IGF2 methylation43,75. Others have found decreased IGF2 methylation in response to famine or undernutrition23. Perhaps this is because the Mediterranean diet represents a more subtle or even different diet exposure than the dietary factors included in these studies. For example, while a Mediterranean diet pattern has been associated with a higher folate consumption and blood folate
A strength of this study is its use of a measure of overall diet rather than nutrients in isolation. Thus far, the study of nutrition in relation to DNA methylation has largely focused on the intake of individual nutrients, with many studies conducted using animal models. In general, nutrients are not consumed in isolation in the human diet, and in some cases, nutrients and food components can interact with one another, enhance or weaken the effect of others, or affect biological processes in the body107. This has been seen in the case of plant phenols124 and measurement of starches with regard to the glycemic index125. Investigating the potential effects of foods and overall diet is important and will have more applicable public health implications. To our knowledge this is the first study to assess the effects of overall maternal diet pattern on infant DNA methylation. Therefore this study presents an important contribution to this emerging literature.
We found that 12.9% of our sample possibly under-reported their energy intake and 9.7% possibly over-reported energy intake, which is within the range of values seen in previous literature assessing energy reporting bias among pregnant and non-pregnant women126–128. We did see differences in reported intake of specific food groups by energy reporting category, however our sensitivity analysis showed that the possibility of over and under-reporting had little effect on our findings, as adjusting for the possible over- and under- reporters did not
substantially change the results of our study.
studied. Another possible reason for this is that sociodemographic factors may be underlying the association between dairy intake and MEG3 IG methylation, as women with above the median diary intake were more likely to be White, have a higher education level, and were on average older than those with below the median dairy consumption. Currently there is no consensus on how to asses dairy intake when assessing Mediterranean diet adherence during pregnancy. Dairy has been assessed as both “beneficial”80,131, “detrimental”87,132. We decided to present our main findings including dairy as a beneficial component, as we believe dairy to be an important component of a balanced diet, and dairy intake was not associated with a greater saturated fat intake compared to those who consumed a lower level of dairy. In addition, there is literature supporting the importance of dairy as a daily component of a Mediterranean diet pattern133,134. However, it is important to note that the removal of dairy from the Mediterranean diet assessment may alter findings.
The Mediterranean diet score, from which the score in this study was based, has been shown to be a reliable indicator of adherence to a Mediterranean diet pattern84. However, assessing diet with a Mediterranean diet score in non-Mediterranean populations may present a problem. The specific foods consumed in non-Mediterranean regions may be different from those consumed in Mediterranean regions, as food preferences, access, and availability are dictated by the environment, and may differ135. It is important to acknowledge this, as the components of the diet pattern may provide different health benefits. For example, olive oil makes up a large part of the monounsaturated fatty acids consumed in Mediterranean
populations. However, in other populations, for example the United States, a large proportion of monounsaturated fat consumption comes from animal fats136, which do not confer the same health benefits linked to olive oil.
even after the stringent Bonferroni correction. In addition, the generalizability of our results to prior NEST findings is limited, as women-infant pairs in our reduced sample were significantly different from those in the larger NEST cohort. As the first study to report on overall maternal diet pattern and infant DNA methylation of imprinted genes, this study provides important preliminary data, however larger studies, using a more representative sample will be needed to gain a better idea of the magnitude of the associations reported here. Another limitation was the possibility of residual confounding for our adjusted estimates. Because lifestyle and
resources are highly associated with sociodemographic factors such as maternal education, and age, it is possible that other unmeasured factors associated with methylation also influenced our results.
In conclusion, our study suggests that low and medium adherence to a Mediterranean diet pattern in early pregnancy alters DNA methylation at the MEG3 IG DMR in a sex-specific manner. Associations between maternal diet in early pregnancy and methylation changes at the MEG3, H19, and PLAGL1 regions may also exist, however a larger study may be needed to uncover these associations. While our study was small, as the first study of its kind, it provides important preliminary data, and suggests that sex-specific analyses may be important in studies relating diet to DNA methylation of imprinted genes. Studies have shown an association
between DNA methylation and weight56, adiposity54, and chronic disease23,90 at the sites
included in this study. However, the significance of our results is still unclear, as child outcomes resulting from the altered DNA methylation profiles observed in this study are still unknown. Future studies should focus on child health outcomes associated with DNA methylation changes seen as a result of maternal diet during pregnancy. In addition, these results should be
Table 1. Characteristics of mothers and infants in the NEST cohort by Mediterranean diet adherence category Low Mediterranean adherence Medium Mediterranean adherence High Mediterranean adherence N (%) Mean
(SD)
N (%) Mean (SD) N (%) Mean (SD) Race1
Black 58 (50) 47 (30.5) 19 (15.8)
White 30 (25.9) 49 (31.8) 52 (43.3)
Other 28 (24.1) 58 (37.7) 49 (40.8)
Missing
Maternaleducation1
Less than college 88 (77.9) 96 (64.0) 51 (43.2)
College degree or greater
25 (22.1) 54 (36.0) 67 (56.8)
Missing 3 4 2
Maternal age2 25.9 (5.4) 28.0 (5.7) 31.1
(5.1) Parity
Primiparous 42 (36.2) 61 (39.6) 44 (36.7)
Multiparous 74 (63.8) 93 (60.4) 76 (63.3)
Maternal pre-pregnancy BMI
26.8 (7.0) 27.3 (6.9) 26.8
(7.0)
Missing 2 0 1
Gestational weight gain2 (kg)
15.1 (7.8) 12.6 (6.4) 14.3
(6.9)
Missing 2 1 2
Gestational age 38.5 (2.2) 38.4 (1.9) 38.2
(2.5) Maternal smoking1
Yes 26 (23.6) 19 (12.8) 5 (4.4)
No 84 (76.4) 130 (87.2) 110 (95.7)
Missing 6 5 5
Gestational diabetes
Yes 3 (2.6) 10 (6.6) 10 (8.5)
No 112 (97.4) 141 (93.4) 108 (91.5)
Missing 1 3 2
Infant sex
Male 63 (54.3) 82 (51.9) 68 (56.7)
Female 53 (45.7) 75 (48.1) 52 (43.3)
1 Results of chi-square test for differences between groups of diet adherence were statistically significant (P <0.01).
2 Results of Kruskal-Wallis test for differences between groups of diet adherence were statistically significant (P <
26
Table 2. Unadjusted and Adjusted1 total estimates for the association between adherence to a Mediterranean diet pattern during pregnancy (low and medium adherence, compared to high adherence) and infant DNA methylation (hypo- and hyper-methylation compared to moderate methylation).
Unadjusted Adjusted
Hypo-methylation Hyper-methylation Hypo-methylation Hyper-methylation
OR (95% CI) P OR (95% CI) P OR (95% CI) P OR (95% CI) P
MEG3 IG
Low adherence 2.80 (1.35, 5.82) 0.01 1.70 (0.82, 3.52) 0.15 3.17 (1.38, 7.27) 0.01 1.63 (0.72, 3.67) 0.24 Medium adherence 1.80 (0.92, 3.54) 0.09 1.57 (0.83, 2.97) 0.17 1.95 (0.95, 3.98) 0.07 1.61 (0.83, 3.13) 0.16
MEG3
Low adherence 0.53 (0.27, 1.06) 0.07 1.20 (0.61, 2.34) 0.60 0.73 (0.33, 1.61) 0.44 1.24 (0.58, 2.62) 0.58 Medium adherence 1.32 (0.69, 2.52) 0.41 1.64 (0.83, 3.24) 0.15 1.63 (0.81, 3.30) 0.17 1.64 (0.80, 3.38) 0.18
IGF2
Low adherence 1.26 (0.65, 2.43) 0.50 0.62 (0.32, 1.21) 0.16 1.40 (0.66, 2.98) 0.38 0.99 (0.47, 2.11) 0.98 Medium adherence 1.14 (0.61, 2.13) 0.69 0.91 (0.50, 1.66) 0.76 1.41 (0.71, 2.78) 0.33 1.32 (0.69, 2.52) 0.40
H19
Low adherence 1.33 (0.66, 2.68) 0.42 0.99 (0.50, 1.97) 0.98 1.79 (0.82, 3.92) 0.15 1.65 (0.75, 3.63) 0.22 Medium adherence 1.03 (0.54, 1.95) 0.94 0.82 (0.44, 1.52) 0.53 1.14 (0.58, 2.23) 0.71 0.98 (0.50, 1.90) 0.95
PLAGL1
Low adherence 0.92 (0.47, 1.79) 0.80 1.11 (0.58, 2.12) 0.75 0.99 (0.46, 2.14) 0.98 2.11 (0.98, 4.56) 0.06 Medium adherence 0.97 (0.53, 1.77) 0.91 0.88 (0.48, 1.62) 0.69 1.03 (0.53, 1.97) 0.94 1.27 (0.65, 2.48) 0.48
27
Table 3. Sex-specific adjusted1 estimates of the association between maternal adherence to a Mediterranean diet pattern during pregnancy (low and medium adherence compared to high adherence) and infant DNA methylation at birth (hypo- and hyper-methylation compared to moderate hyper-methylation).
Males Females
Hypomethylation Hypermethylation Hypomethylation Hypermethylation
OR (95% CI) P OR (95% CI) P OR (95% CI) P OR (95% CI) P
MEG3 IG
Low MDS 1.77 (0.60, 5.23) 0.30 0.81 (0.25, 2.62) 0.72 7.40 (1.88, 29.09) 0.0004 3.41 (0.95, 12.21) 0.06 Med MDS 1.27 (0.49, 3.32) 0.62 1.13 (0.43, 2.96) 0.81 3.34 (1.10, 10.21) 0.03 1.99 (0.75, 5.33) 0.17
MEG3
Low MDS 1.08 (0.36, 3.22) 0.89 1.11 (0.36, 3.38) 0.86 0.30 (0.08, 1.15) 0.08 1.39 (0.49, 3.96) 0.53 Med MDS 1.45 (0.53, 3.97) 0.47 1.49 (0.53, 4.17) 0.45 2.03 (0.73, 5.65) 0.18 1.88 (0.66, 5.34) 0.23
IGF2
Low MDS 1.63 (0.53, 4.96) 0.39 1.16 (0.37, 3.60) 0.80 1.23 (0.42, 3.55) 0.71 0.82 (0.28, 2.35) 0.70 Med MDS 1.82 (0.69, 4.75) 0.22 1.49 (0.58, 3.81) 0.41 1.14 (0.42, 3.06) 0.80 1.24 (0.50, 3.13) 0.64
H19
Low MDS 2.60 (0.77, 8.77) 0.12 4.46 (1.32, 15.08) 0.02 1.34 (0.47, 3.88) 0.59 0.70 (0.22, 2.19) 0.54 Med MDS 1.16 (0.44, 3.02) 0.77 1.10 (0.42, 2.86) 0.85 1.15 (0.44, 3.04) 0.77 1.04 (0.40, 2.70) 0.94
PLAGL1
Low MDS 0.95 (0.31, 2.93) 0.93 3.24 (1.02, 10.26) 0.05 0.94 (0.31, 2.85) 0.92 1.48 (0.50, 4.36) 0.48 Med MDS 0.84 (0.33, 2.09) 0.70 1.32 (0.51, 3.40) 0.56 1.06 (0.40, 2.82) 0.91 1.16 (0.44, 3.07) 0.77
CHAPTER 3- AIM 2: INFANT DNA METHYLATION AT BIRTH AND WEIGHT GAIN IN THE FIRST YEAR OF LIFE
Introduction
Understanding what factors influence a child’s risk of obesity is crucial to the
development of new strategies for obesity prevention. Obesity in early childhood is a risk factor for obesity later in life2,3,5 and for a number of chronic diseases in both childhood4 and
adulthood137. Early identification of obesity or its risk factors may help prevent the progression of obesity and its consequences later in life6. Rapid weight gain in infancy has been associated with obesity and overweight later in childhood13,15, and adulthood15. The causes of this rapid weight gain are not well understood.
In accordance with the developmental origins of disease hypothesis, the intrauterine environment is hypothesized to influence an individual’s later susceptibility for chronic
diseases19, including obesity21,22. Epigenetic modifications have been proposed as a mechanism for the in utero origin of later obesity, and a growing literature has found supporting
evidence32,50,138. Epigenetic modifications are changes to gene expression caused by
mechanisms other than the underlying DNA sequence. DNA methylation is the most studied epigenetic mechanism in humans, due in part, to its stability. DNA methylation that controls the monoallelic expression of imprinted genes is established during gametogenesis and is stably maintained throughout somatic division29,40,41,101,139, and may therefore provide a register of in utero exposures. A study of famine survivors found that adults who experienced famine in utero had hypo-methylation of the imprinted IGF2 gene compared to their siblings who had not
While interest in epigenetic research has increased, there is still insufficient and inconsistent evidence linking epigenetic mechanisms to obesity and weight gain in humans. Studies vary by DNA locus chosen, epigenetic mechanism examined, and timing of the outcome or exposure. The most consistent association between imprinted genes and obesity has been seen with the IGF2 locus. Studies have found a relationship between the IGF2 domain and fetal
growth51,52,141,142, and body composition or weight in children52–54. More research is needed to uncover consistent associations between additional differentially methylated regions (DMRs) and weight gain, and better understand the role of DNA methylation as a potential intermediate marker in the relationship between maternal and infant exposures and weight gain in childhood.
This study aims to assess the association between DNA methylation at 5 imprinted genes and weight gain between birth and age 1. In this analysis we include two differentially methylated regions (DMRs) involved in regulating the delta-like 1 homolog/maternally expressed gene 3 (DLK1/MEG3) imprinted domain on chromosome 14q32.2 (the MEG3 IG DMR and the MEG3 DMR), two that are involved in imprinting of the insulin growth factor 2/H19 (IGF2/H19) domain on chromosome 11p15.5 (the IGF2 DMR and the H19 DMR) which are located upstream of the imprinted promoters of IGF2 and at the imprinting control region for the IGF2/H19 imprinted domain near the H19 promoter, respectively, and one at the pleiomorphic adenoma gene-like 1 (PLAGL1) locus at 6q24.2. These regions were selected for their
association with growth51,52,56, chronic disease23,90, and parental obesity55.
Methods
Study Sample and Data Collection
use one of the qualifying obstetric facilities for delivery. Women were excluded if they were HIV positive, planned to relinquish custody of the child, or planned to move away from the area in the following three years. Upon enrollment, mothers completed questionnaires providing information on socio-demographic factors, lifestyle characteristics, and anthropometrics (the mother’s and the father’s height, highest and lowest weight ever, and current and usual weight). At delivery, birth outcomes were abstracted from medical records and infant cord blood
specimens were obtained to assess offspring methylation, and at one year, data was collected on child anthropometrics, feeding, and lifestyle.
1700 pregnant women consented and were enrolled in the NEST cohort. Of those, 396 women were excluded for miscarriage (N=109) or infant death during or soon after birth (N=4), being illiterate (N=1), underage (N=1), refusing further participation (N=146), moving away from the area (N=21), or delivering at a hospital not included in the study (N=114). DNA methylation data was analyzed for the first 550 infants in the study. Infants with analyzed DNA methylation were not significantly different than infants whose DNA methylation had been analyzed with respect to race, maternal education, maternal smoking status, maternal pre-pregnancy BMI, maternal age, or weight at age 1 (data not shown). Weight and length measurements at birth and one year were available for 322 infants who had analyzed DNA methylation data. Infant birth weight and length were abstracted from medical records by study personnel. Infant weight and length at age 1 were reported by parents at 1-year follow-up through secure mail-in
DNA methylation data on at least one the 5 DMRs of interest, and who had plausible length and weight measurements at birth and age 1. Infants included in this study had on average greater birth weight and gestational age compared to infants not included in the study (data not shown).
Infant Anthropometric Data
Lengths and weights were used to calculate weight-for-length and length-for-age Z scores at birth and age 1 using reference data from the CDC143. Change in Z scores was calculated by subtracting the Z score at birth from the Z score at age 1 (WLZ age 1-WLZ birth). Two outcomes were assessed as a way to capture child relative weight gain and gain in length: change in weight-for-length Z scores (WLZ) between birth and age one, and change in length-for-age Z scores (LAZ) between birth and age 1. Child relative weight gain and gain in length were modeled as a continuous variable, using linear regression. In addition, WLZ was
dichotomized, and rapid weight gain at age 1 was defined as a change in weight-for-length Z score between birth and age 1 of 0.67 SD or greater61.
DNA Methylation
Specimen collection and DNA methylation methods have been described in detail elsewhere38. Briefly, infant cord blood specimens were collected at birth. Samples were
collected in EDTA-containing vacutainer tubes and centrifuged using standard protocols to allow for collection of plasma and buffy coat, with buffy coat used for DNA extraction (Qiagen;
Valencia, CA). Specimens were stored at -80°C until the time of analysis. DNA was extracted using Puregene reagents according to the manufacturer’s protocol (Qiagen), and quantity and quality were assessed using a Nanodrop 1000 Spectrophotometer (Thermo Scientific;
Wilmington, DE).
performed using a PyroMark Q96 MD pyrosequencer (Qiagen). Pyrosequencing assay design, genomic coordinates, assay conditions, and assay validation are described in detail
elsewhere33. Briefly, assays were designed to query established imprinted gene DMRs using the PyroMark Assay Design Software (Qiagen). PCR conditions were optimized to produce a single, robust amplification product. Defined mixtures of fully methylated and unmethylated control DNAs were used to show a linear increase in detection of methylation values as the level of input DNA methylation increased (Pearson r is 0.99 for all DMRs). Once optimal conditions were defined, each DMR was analyzed using the same amount of input DNA from each specimen (40 ng, assuming complete recovery following bisulfite modification of 800 ng DNA). Percentage of methylation for each CpG cytosine was determined using Pyro Q-CpG software (Qiagen). Pyrosequencing assays were performed in duplicate for all specimens whose values fell more than two standard deviations above or below the means in which case the average of the two runs was used. The values obtained represent the mean methylation for the CpG sites contained within the sequence being analyzed.
Statistical Analysis
Frequencies and means of sociodemographic variables were calculated, and chi square and T tests were conducted to determine if there were significant difference in
sociodemographic variables by level of change in WLZ score. All potential covariates were regressed on the exposure (DNA methylation) and the main outcome (change in weight-for-length Z scores) to test preliminary associations. Linear and logistic regressions were conducted to test the association between DNA methylation and early weight gain and growth outcomes.
sample median. Interaction terms were tested via likelihood ratio test (α=0.15). As birth weight has been associated with methylation of PLAGL156,93,94 and IGF2 at birth, and with infant weight gain, it is thought that birth weight may be on the causal path between infant DNA methylation at birth and infant weight gain. Given the possibility for birth weight to be either a mediator or modifier in the relationship between infant DNA methylation and weight gain in infancy, it was not included as a potential confounder in our main models. However, we did conduct a sensitivity analysis to determine effects of including it as a confounder in our models. The following covariates were tested as potential confounders: maternal education (less than a college degree/college degree or greater), maternal gestational diabetes (yes/no), maternal pre-pregnancy BMI, maternal smoking at any time during pre-pregnancy (yes/no), gestational weight gain, parity (primiparous, multiparous), maternal age at delivery, self-report status of
anthropometric measurements, and date of length and weight measurements relative to infant’s first birthday. Covariates were tested in the model one at a time, and were kept in the model if they changed the estimate by more than 10%. Final models included maternal education, maternal pre-pregnancy BMI, maternal smoking, maternal age, birth weight, self-report status, and date of weight and length measurements. The interaction terms for sex and birth weight were significant, therefore sex-specific and birth-weight category specific WLZ score models will be presented in addition to total models.
Despite breastfeeding being a potentially important covariate, it was excluded from all models due to excessive missingness (~40%). As breastfeeding was likely missing not at random, with non-breastfeeding women being more likely to have missing data on
breastfeeding, we conducted a sensitivity analysis using simulations to add breastfeeding to our models to determine the potential impact of its exclusion. Breastfeeding defined as
values. Breastfeeding was not included in models, as the simulation results showed that it did not change our estimate by more than 10% (condensed table available in appendix 6).
Mean DNA methylation values for each DMR were used in regression models, as previously reported Cronbach’s alpha for correlations among methylation values from all CpGs measured at each DMR was >0.8935. DNA methylation was assessed in tertiles
(“hypo-methylation”, “moderate (“hypo-methylation”, and “hyper-methylation”), as percent methylation values were generally not normally distributed at the DMRs of interest, and both hypo- and hyper-methylation have been associated with health outcomes, depending on the DMR55,94. Given the theoretical 50% expected methylation of imprinted genes, the “moderate” category of DNA methylation was used as the referent. All statistical analysis was completed using SAS 9.4.
Results
Study population characteristics are presented in table 4. The racial/ethnic breakdown of the women in the study is as follows: 38.3% African American, 29.7% White/Caucasian, and 32.0% other races/ethnicities including Hispanic, Asian/Pacific Islander. The majority of women in the study completed less than a college degree (68%) and reported not smoking at any point during pregnancy (87%). The mean maternal age for women in this study was 28.0 years (±5.7). The mean maternal pre-pregnancy BMI for women in the study was 27.4 (±7.2), and the mean birthweight of infants born to mothers in this study was 3385 grams (±496). There were no significant differences in sociodemographic variables between infants above and below 0.67 SD of change in WLZ between birth and age 1.
Change in WLZ Scores Between Birth and Age 1
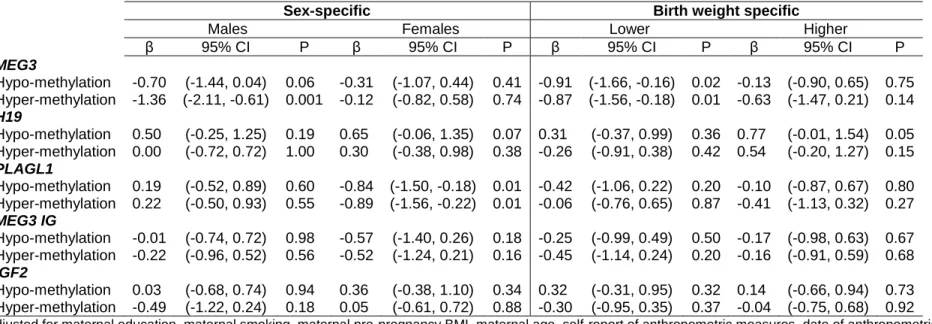
Unadjusted linear regression estimates (see table 5) show that infants with a higher level of methylation at the MEG3 DMR at birth have a lower change in WLZ score between birth and age 1 (β=-0.6, 95% CI= -1.1, -0.2) compared to infants with moderate methylation. This
0.6). Sex-specific estimates are available in table 6. Infants with lower methylation at the H19 DMR at birth show a greater change in WLZ score between birth and age 1 compared to those with moderate methylation (β=0.5; 95% CI=0.0, 1.0), however there were no sex-specific differences in estimates at this DMR. Only girls showed statistically significant differences in change in WLZ score estimates between birth and age 1 at the PLAGL1 DMR. Girls with either higher or lower methylation showed a smaller change in WLZ scores between birth and age 1 at the PLAGL1 DMR compared to girls with moderate methylation (hypo: β=0.8; 95% CI=1.5, -0.2; hyper: β= -0.9; 95% CI=-1.6, -0.2). However, no overall association was seen. All
statistically significant associations remained after adjustment. Birth weight-specific results showed that infants with either a lower than the median birth weight had smaller weight gain between birth and age 1 in association with either a higher or lower level of MEG3 methylation (hypo: β=-0.9; 95% CI=-1.7, -0.2; hyper: β=-0.9; 95% CI=-1.6, -0.2). At the H19 DMR, infants with a higher than median birth weight had greater weight gain between birth and age 1 in association with lower methylation (β=0.8; 95% CI=0.0, 1.5). When WLZ between birth and age 1 was dichotomized at +0.67 SD, results similar to those from linear models were seen in association with MEG3 hyper-methylation (Adjusted OR= 0.5; 95% CI= 0.3, 0.9), however stratified estimates were not calculated due to small numbers. Results of our sensitivity analysis showed that inclusion of breastfeeding did not substantially alter results (range of β estimates in relation to hyper-methylation at MEG3: -0.62, -0.63. See Appendix 5). In addition, results of our sensitivity analysis including birth weight as a confounder did not substantially alter our findings (Appendix 6).
Change in LAZ Scores Between Birth and Age 1
Discussion
We observed slower relative weight gain, as measured by changes in WLZ between birth and age 1 among infants who had a higher level of methylation at the MEG3 DMR, and greater weight gain among infants with lower methylation at the H19 DMR. We also observed sex- and birth weight-specific differences in the association between methylation at the MEG3 and PLAGL1 DMRs and weight gain between birth and age 1. We observed a slower weight gain in association with a higher level of MEG 3 methylation only in boys, and slower weight gain in association with both higher and lower levels of PLAGL1 methylation in girls only. In addition, infants with lower than the sample median birth weight, who also had either a higher or lower level of MEG3 methylation had smaller weight gain between birth and age 1 compared to those with moderate methylation. No associations were observed between methylation at the 5 DMRs included in this study and gain in length between birth and age 1. This study adds to a growing body of epidemiologic literature on growth outcomes associated with DNA methylation at birth, and shows that DNA methylation at the MEG3, PLAGL1, and H19 DMRs may be associated with weight gain in infancy.
growth restriction, insulin resistance, among other clinical characteristics. However in our study, lower H19 methylation was associated with greater relative weight gain between birth and age 1. More research is needed to gain a better understanding of the relationship between infant relative weight gain and methylation at these DMRs.
Only one other study has examined the association between methylation at the MEG3 DMR and early relative weight gain in a mediation model of the indirect effect of MEG3 in the association between maternal lead exposure and rapid early weight gain146. No association was found between MEG3 methylation and rapid weight gain, however the study was underpowered, and DNA methylation was assessed linearly. A lower percent methylation at the MEG3 region has previously been associated with maternal obesity prior to pregnancy, with infants of mothers who were obese prior to pregnancy having lower methylation at MEG3 compared to infants of mothers were not obese prior to pregnancy55. Our study results showed that greater methylation at MEG3 was associated with slower weight gain, which is associated with a lower risk of
obesity. Therefore our results mirror those findings, suggesting that perhaps a lower percent methylation may be associated with weight and weight gain in both infants and adults. In addition, prior studies have shown that the MEG3 DMR may play multiple roles in the body. Studies have linked the MEG3 DMR to insulin resistance147 and type 2 diabetes90. In addition, MEG3 may also play a role in the development of cancer, as MEG3 is believed to transcribe a powerful tumor suppressor gene92. The results of this study add to the growing knowledge on the MEG3 DMR. More long-term studies are needed to fully understand the role of these regions in health and weight gain.
Although previous literature supports the role of the IGF2 DMR in weight gain and adiposity, we did not observe an association between the IGF2 DMR and weight gain in the first year of life. However, these results are consistent with a study that found no significant
weight for age above 85th percentile at age 1. In addition, much of the evidence shows an association between the IGF2 DMR and fetal growth51,148. In our study we restricted to term births only, therefore many of the infants with aberrant IGF2 methylation may have been excluded from this study.
In our study, boys with hyper-methylation at the MEG3 DMR and girls with hypo- and hyper-methylation at the PLAGL1 DMR exhibited slower weight gain between birth and age 1 compared to those with moderate methylation. There is more than one plausible explanation for the sex-specific results seen in this study. The first possible explanation is that the weight-for-length Z scores in this study do not follow the CDC WLZ score distribution. Therefore, although Z scores take into account the different growth patterns of boys and girls, there may be
unaccounted for differences in the distribution by sex, which may lead to differences in WLZ scores by sex. However, a comparison of WLZ scores at age 1 and change in WLZ scores between birth and age 1 did not reveal any significant differences by sex, suggesting that our results do follow the sex-specific Z score distributions. A third possibility is that the study WLZ score distribution differs from the CDC distribution in only one sex, which results in sex-specific differences in WLZ scores. However we did not see any consistent differences in
anthropometric variables in one sex over the other, suggesting that this is not the case. A final explanation is that methylation at the highlighted DMRs is different in boys and girls. There is a growing body of literature supporting the idea of sex-specific methylation23,45,149. Sex-specific results have not been consistently seen across the same DMRs in different studies, however more studies are needed to gain a better understanding of this phenomenon.
birth weight generally fell within the normal range of birth weight. These results suggest that infants of average birth weight may be more likely to have either higher or lower MEG3 methylation, and may be at a decreased risk of obesity.
This study benefits from an ethnically diverse cohort, and prospectively collected data. This allows us to gain a better understanding of the timing of methylation with regards to our outcome of interest, weight gain. In addition, the use of length rather than weight-for-age Z scores as our outcome of interest provides a better estimate of adiposity. However it is not without limitations. Our study’s small sample size may have limited our ability to see
significant differences among our population. Multiple testing is also a limitation in this study, as it may increase the possibility that our results are seen by chance. Moreover, we were unable to include breastfeeding as a covariate in our main analysis, due to excessive missing data. Our sensitivity analysis showed that inclusion of breastfeeding through multiple imputation did not alter our findings. However, previous literature has suggested that breastfeeding is associated with obesity and early weight gain151, therefore it is possible that the lack of association in our study is related to measurement error or bias in our breastfeeding variable.
There is evidence to show that rapid weight gain in infancy and early childhood may be a strong predictor of obesity and adiposity later in life14,15,17. However, weight trajectories in mid-childhood are more predictive of adiposity in adult life152,153. It is possible that many who are classified as having rapid weight gain at age 1 will not become obese. Assessing weight status at various time points throughout early and mid-childhood, in addition to adolescence and adulthood, may provide more robust results.
between DNA methylation and early obesity risk is important, as DNA methylation may serve as a biological marker for the assessment of early obesity risk. However, gaining a better