A BEHAVIORAL PERSPECTIVE ON ATTENTION ALLOCATION AMONG MULTIPLE GOALS: AN EXPLORATORY EXAMINATION OF THE AUTOMOTIVE
INDUSTRY
Songcui Hu
A dissertation submitted to the faculty of the University of North Carolina at Chapel Hill in partial fulfillment of the requirement for the degree of Doctor of Philosophy in the Kenan-Flagler Business School.
Chapel Hill 2012
Approved by:
ii
©2012 Songcui Hu
iii
ABSTRACT
SONGCUI HU: A Behavioral Perspective on Attention Allocation Among Multiple Goals: An Exploratory Examination of the Automotive Industry
(Under the direction of Richard Bettis)
Goals (aspirations) and attention allocation are of considerable interest in practice, in strategic theory, and in research on a behavioral theory of the firm. Empirical studies of the allocation of attention to goals have been limited to two or fewer goals where sequential attention to goals is either not an issue or obvious. The exploratory research discussed in this dissertation is concerned with attention allocation when there are more than two goals. Here sequential attention is ambiguous regarding what goal to which attention should be shifted when the current focal goal is satisfied. Relying on the combination of multiple statistical methods including panel vector autoregression, ordinary least squares regression, and hierarchical linear regression, I test the long-run interplay of and attention allocation among three product goals (car fuel efficiency, safety, and reliability) using a large dataset from the US automotive industry from 1980 to 2009. Major results involve the complexity of shifting attention among goals, issues raised by the correlation structure among multiple goals, and the context dependence of attention shifts. These results suggest the necessity of a
iv
ACKNOWLEDGEMENTS `
The dissertation is a result of much help and support from a large group of people. I am indebted to all of them for their generous inputs throughout my journey in the PhD program at Kenan-Flagler Business School. I feel especially lucky to have worked with my committee members, a truly exceptional group of people.
First and foremost, I am grateful to my advisor, Rich Bettis. Rich contributed in many tangible ways to my work. He spent endless hours reading revisions and pouring over
transcripts. He sacrificed many weekends to help further my studies. He is a master mentor and was extremely patient with my shortcomings when I learned to frame research questions, collect and analyze data, and present findings in more meaningful ways. Rich also became a guidepost for my future career as a scholar. His strong commitment to academic work, and genuine interest in a broad set of questions with a solid theoretical outlook, coupled with his endless willingness to help provided me with a role model that I can only aspire to be. Rich is also a good friend. He always treated me with kindness and respect. In short, he is a model of “greatness” that I hope to emulate during my career.
My dissertation committee likewise greatly enriched my experience at UNC. Atul Nerkar has patiently supported me as I searched for my way, and always showed
v
Kuppuswamy, and Larry Chavis for their many helpful suggestions and valuable insights. All these faculty members graciously and frequently offered their time in my behalf and I am thankful for their quiet and powerful examples of what it means to be a great scholar.
I also feel very lucky to be surrounded by a wonderful community of PhD students. I am especially grateful to Jinghan Meng for her support through my lamentation and
complaints. Others, including but not limited to James Berry, Susan Cohen, Nel Dutt, Tim Fenwick, Peter Gallo, Mahua Guha, Olga Hawn, Xia He, Amol Joshi, Virginia Kay, Changhyun Kim, Young Un Kim, Daniel Lin, Kevin Miceli, Aleks Rebeka, Elena Vidal, Guansong Wang, Qi Wang, Han Xia, provided me with intellectual input, challenge, motivation, advice, friendship, and laughter.
I also acknowledge the outstanding financial support I received during my doctoral program. In particular, I appreciate the support from the Department Head Al Segars. The staff at the Strategy and Entrepreneurship also deserves thanks for spending every effort to make life easier. Special thanks to Beverly Howarth and Peggy Pickard, the persons I would always run to with any kind of problem. All these together made my research at UNC both enjoyable and possible.
I am grateful to Benjamin Wang. Ben gave me perspective, instilled confidence in my actions, and inspired me to continually lengthen my stride. He has been my wise and faithful friend during years of school. I consider myself a blessed person to have him at my side.
vi
TABLE OF CONTENTS
TABLE OF CONTENTS ... vi
LIST OF TABLES ... ix
LIST OF FIGURES ... x
ABBREVIATIONS ... xi
Chapter 1 INTRODUCTION ... 1
2 BACKGROUND THEORY ... 7
2.1 Bounded Rationality and Attention Theory ... 7
2.2 Multiple Goals and Sequential Attention ... 12
2.3 Adaptive Aspirations and Performance Feedback ... 18
3 RESEARCH PROPOSITIONS ... 23
3.1 Sequential Attention and Discretionary Attention ... 23
3.2 Interdependencies of Goals ... 26
3.3 Context Dependence of Attention Allocation ... 28
4 METHODS ... 31
4.1 Sample and Data Collection ... 31
4.2 Variables and Measurement ... 34
4.3 Statistical Method ... 37
vii
5.1 Descriptive Statistics ... 45
5.2 Panel Vector Autoregression Analysis... 46
5.3 Ordinary Least Squares Analysis ... 48
5.4 Robustness Analyses ... 53
5.4.1 Alternative measures ... 53
5.4.2 Control variables ... 55
5.4.3 Alternative statistical method – Hierarchical linear model ... 57
6 EXTENSION TEST ... 60
6.1 Propositions ... 60
6.1.1 Size as a moderator ... 60
6.1.2 Age as a moderator ... 62
6.1.3 Geography as a moderator ... 63
6.2 Analysis Results ... 63
6.3 Discussion ... 65
7 DISCUSSION AND CONCLUSION ... 66
7.1 Contributions and Implications ... 67
7.1.1 Contributions to organizational theory on goals ... 67
7.1.2 Contributions to behavioral theory and attention theory ... 69
7.1.3 Methodology contribution ... 74
7.2 Limitations and Opportunities for Future Research ... 75
7.3 Conclusion ... 78
APPENDICES ... 108
viii
Appendix B: Fisher-Type Unit Root Test for Panel Data ... 112
Appendix C: Lag Length Specifications ... 113
ix
LIST OF TABLES
Table
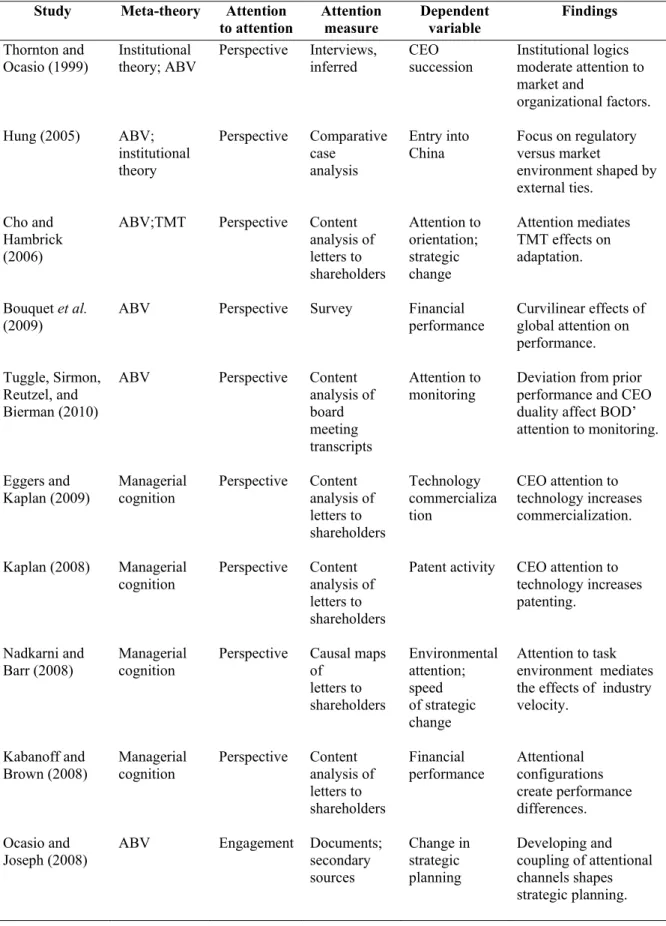
1 Selected Studies on Attention ... 79
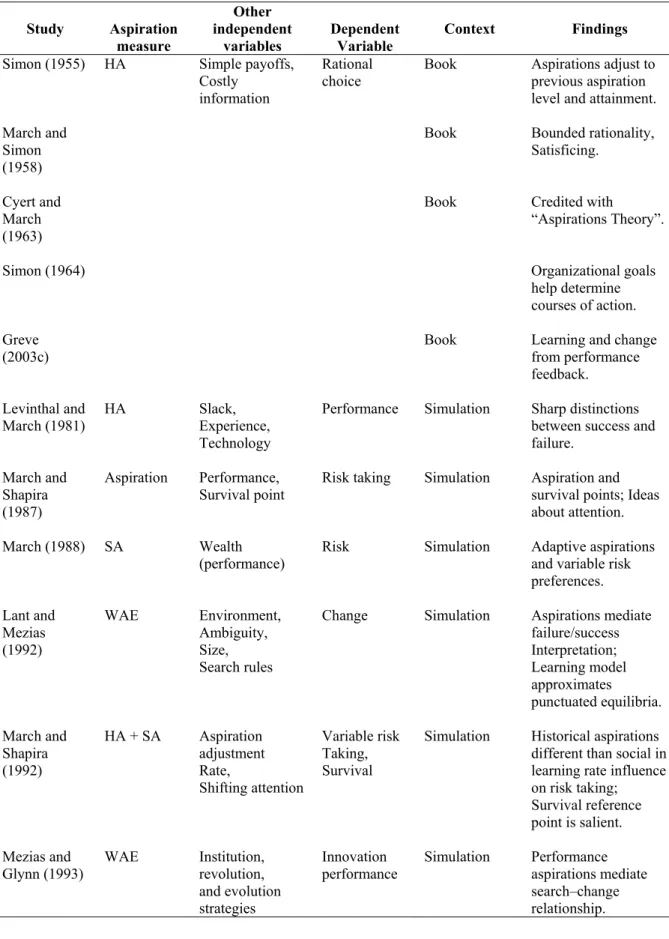
2 Selected Studies on Aspirations (Built on Behavioral Theory and Adaptive Learning) ... 81
3 Variable Description and Measure ... 88
4 Descriptive Statisticsa and Correlationsb between Key Variables ... 90
5 Main Results of the Panel VAR Model ... 92
6 OLS Regressions of Growth of Goal Variablesa ... 93
7 OLS Regressions of Growth of Goal Variables (Full Models)a ... 94
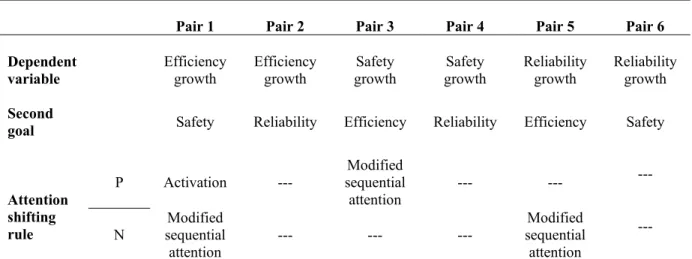
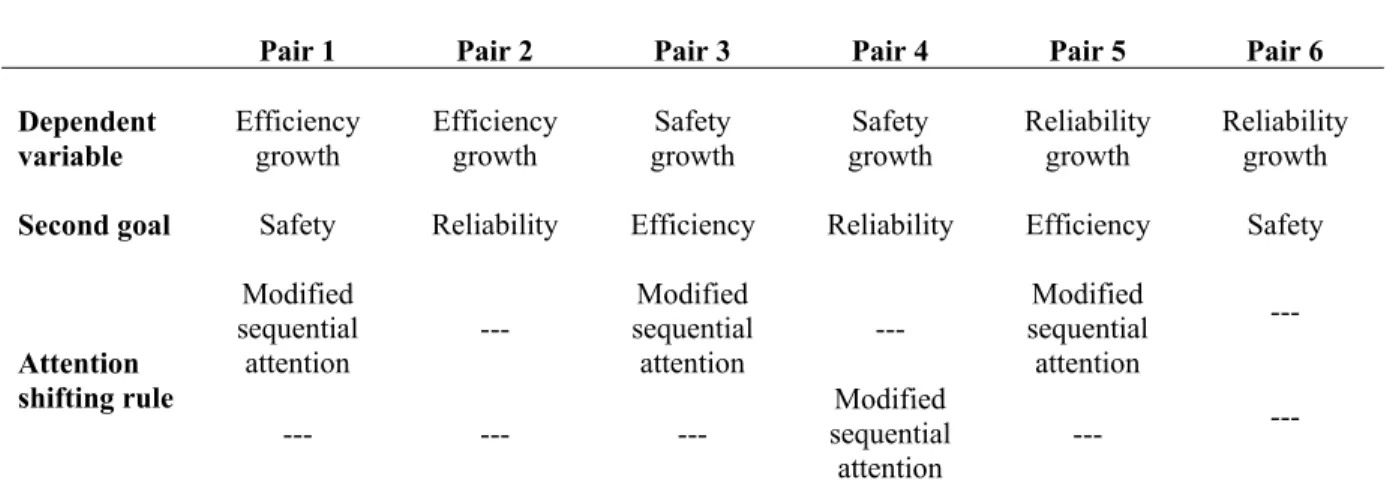
8 Summary of Attention Shifting Rules for Different Pairs of Goals ... 95
9 Model Fixed-Effect Coefficients from OLS Regressionsa ... 96
10 OLS Regressions with the Alternative SA Measurea ... 97
11 Summary of Attention Shifting Rules with the Alternative SA Measure ... 98
12 OLS Regressions with Other Control Variablesa ... 99
13 Hierarchical Linear Regression of Growth of Goal Variablesa ... 101
14 HLM Random-Effect Parameters and Variance Partition ... 103
x
LIST OF FIGURES
Figure
1 Trend in Percent Deviations from Mean Levels of Fuel Economy,
Safety, and Reliability ... 105
2 Impulse-Responses for the PVAR Model ... 106
3 Frequency Distribution of Auto Model Fixed Effect Coefficients
xi
LIST OF ABBREVIATIONS
ABV Attention-based view of the firm
AD Attainment discrepancy
AIC Akaike information criterion BIC Bayesian information criterion
BOD Board of directors
BTOF Behavioral theory of the firm
CAFE Corporate average fuel economy
CEO Chief executive officer
CR Consumer reports
EPA Environmental protection agency
GMM Generalized method of moments
HA Historical aspiration
HLM Hierarchical linear models
IIHS Insurance institute for highway safety
IRF Impulse response function
LR Likelihood ratio
MMC Multimarket contact
MPG Miles per gallon
NHTSA National highway traffic safety administration
OLS Ordinary least squares
PVAR Panel vector autoregression
xii
SA Social aspiration
TMT Top management teams
CHAPTER 1 INTRODUCTION
Organization aspirations, desired performance levels in specific organizational outcomes, are central to strategic decision making. Setting goals and objectives is a long-standing component of strategic planning (e.g., Ansoff, 1984; Chandler, 1962; Hofer & Schendel, 1978). Managers establish organizational goals to communicate strategic direction (Fiegenbaum, Hart, & Schendel, 1996), enhance performance (Carver & Scheier, 1981; Eisenhardt, 1985; Hamel & Prahalad, 2005), and provide measures of success (Kaplan & Norton, 1996, 2001; Meyer, 2002). The literature generally treats aspirations and goals as similar concepts. Therefore, in this dissertation, aspirations and goals are used
interchangeably as both concepts lie under the umbrella term – aspirations.
2
This stream of work has comprehensively characterized both antecedents and
consequence of organization aspirations. Specifically, it is concerned with differences in risk preferences when performance is either above or below a goal. It has mainly focused on a single goal and how the consequences of performance relative to the aspiration level
motivate various organizational actions (Bromiley, 1991; Chen & Miller, 2008; Greve, 1998, 2003; Iyer & Miller, 2008; Miller & Chen, 2004; Shimizu, 2007).
However, much of organization theory explicitly recognizes the reality that
organizations have a wide range of overall and subunit goals such as market share, quality, productivity, and customer satisfaction (Cyert & March, 1963; Scott, 1998). The existence of multiple goals within organizations is tightly tied to the nature of organizations. According to the Carnegie perspective (Cyert & March, 1963; March & Simon, 1958; Simon, 1947), organizations bring together a set of participants with conflicting interests, goals and knowledge to cooperation in collective action. Organizational members agree to participate so long as the perceived value of the inducements they receive from the organization exceeds the perceived opportunity costs of their contribution (Barnard, 1938). However, given
uncertainty and bounded rationality, the implicit contract between the organization and its members is incomplete. With the specialization of decision making and information
processing inherent in organization, conflicts among various groups within organizations are never fully resolved.
3
of conflicting interests and goals depart in fundamental ways from the Carnegie School view (Gavetti, Levinthal, & Ocasio, 2007).
The Carnegie School (Cyert & March, 1963; March & Simon, 1958; Simon, 1947) argues that multiple goals within organizations compete for the limited pool of organizational resources, including energy, time, and attention. For instance, Penrose (1959) argued that rapid firm growth is associated with decreases in production efficiency, because planning for growth takes managerial focus away from keeping production cost down. Multiple-goal pursuit often requires attempting to dynamically balance between opposing demands for the limited resources, to ensure that moving toward one of the goals does not compromise all other goals (Ocasio, 1997). For example, during a conversation with Automotive News on Toyota’s national safety recall, Seigo Kuzumaki, the project general manager for vehicle safety in Toyota, said
"We are trying to find the engineering man-hours for these quality issues. The surging demand for engineers in safety is forcing Toyota to rebalance resources in product development while trying to keep products on schedule. In some cases, that may result in slowed product development, but the company is trying to avoid this… Shifting resources to safety was the right compromise at the right time. Toyota needs to move faster to respond to
customer needs…”(Automotive News, 2010)
Therefore, pursuing multiple goals can create managerial challenges. Specifically, decision makers find it cognitively difficult to manage multiple interdependent goals and ultimately can face confusion and lack of direction (Jensen, 2001), or get caught in a status quo trap (Ethiraj & Levinthal, 2009). This clearly suggests that theoretical and empirical exploration of the boundary conditions of attention allocation is necessary.
4
organizational goal-directed behavior in multiple-goal pursuit. Sequential attention is the major theory on attention allocation among multiple goals (Cyert & March, 1963). It states that organizations only focus on one goal at a time, and shift all attention to the next goal once the current one is satisfied. Much of this literature is theoretical in nature. There has been only one empirical study (i.e., Greve, 2008) which considered two organizational goals and none that considered more than two goals1. Firms and their subunits each can and obviously do have more than two goals. The increasing number of goals reflects the increase of interdependent constraints (Simon, 1955). Multiple constraints further increase the
complexity of decision making, information processing, and attention allocation (Cyert & March, 1963; Simon, 1964; Sullivan, 2010). When the number of goals is two, the switching rule for sequential attention is simply to choose the other goal when the first goal has been met. However, when there are more than two goals the situation is complicated since there is no theoretical rule or empirical research defining how a choice of the next goal for attention is determined. Moreover, organizational goals may be interdependent. Interrelated goals may be congruent and mutually reinforcing or, more commonly, divergent, whereby the
satisfaction of one goal comes at the expense of decreasing performance on one or more other goals. Consequently, the attention allocation becomes much more complicated.
Furthermore, previous empirical studies have assumed that all organizations in the reference group (e.g., industry, industry segment, or strategic group) follow the same rule of attention allocation. However, scholars have suggested that attention allocation is context
1There are some studies in the literature examining different measures of performance. For example, Miller and
5
dependent (Ocasio, 1997), and the order in which goals are attended is not uniform across organizations but depends on the preferences of the “dominant coalition” of each
organization (Cyert & March, 1963).
This dissertation intends to take the first step toward building a nascent theory of attention allocation to multiple goals, especially when the number of goals exceeds two. The literature has examined various processes and mechanisms for minimizing or resolving conflicts among multiple goals within organizations, including hierarchy (Simon, 1947), incentives (Barnard, 1938; Cyert & March, 1963), and organization structures (Burton & Obel, 1988; Lawrence & Lorsch, 1967; Thompson, 1967). In this dissertation, I am interested in one form of goal conflict that is important and realistic, but remains understudied – the attention allocation among more than two goals at a single hierarchical level. I explore attention allocation to multiple goals within and across automotive companies at the level of the individual automobile model. The research is exploratory since empirical studies
involving more than two goals have not previously been conducted, and lack a theoretical basis regarding sequential choice. This exploration is driven by propositions based in what seem to be reasonable modifications and extensions of current theory. The main emphasis of this work is on the recognition of the interdependencies of goals, the contextual dependence of decision making, and the consequent challenges of attention allocation to multiple goals within organizations. It develops and tests a model of how organizations selectively regulate the allocation of attention among multiple goals using the panel data from the US automotive industry.
6
provide important insights and suggest the necessity of a substantial extension and
modification of the theory of attention allocation. Conjectures are discussed regarding some aspects a new theory might include. Subsequent research will be directed at formal testing of these conjectures. Some preliminary rules may be applicable, though at this point the
outlines of a new theory are still vague regarding the static allocations of attention across multiple goals under various conditions and the detailed dynamics regarding what drives reallocation and the resulting new allocation of attention given various drivers of change. In particular it turns out that the rules of switching attention are likely to depend in part on the context and particularly goal correlation structures. This is counter to the usual assumption of homogeneity of switching rules within a particular reference group.
The remainder of this dissertation is organized as follows. First, I start with a brief review of the background theory, including bounded rationality and attention theory, multiple goals and sequential attention, and performance feedback. Next, I develop a set of
propositions in the context of current literature. I then offer a method section that includes a description of the sample, the statistical technique employed, and variables and
CHAPTER 2
BACKGROUND THEORY
The purpose of this dissertation is to investigate how decision makers in the organizations allocate attention to multiple conflicting goals. In this chapter I start with a brief review of the relevant attention theory. I then review the literature on multiple goals within organizations, and discuss how sequential attention can sometimes resolve conflicts among multiple goals. I finally review the literature on adaptive aspirations and performance feedback to summarize the importance of attainment discrepancy on attention allocation to goals.
2.1 Bounded Rationality and Attention Theory
More than half century ago, Herbert Simon (1947) introduced a new perspective on firm behavior, which boldly departed from economists’ theories of perfect rationality and highlighted the bounded rationality of humans in explaining how managers make decisions. For Simon, administrators satisfice – look for a course of action that is satisfactory – rather than optimize over the latent choice set. Bounded rationality results from limited attentional capability of humans. Hence organizations rely on performance feedback relative to goals in allocating attention. This involves issues of how the performance is valued and the scope of alternatives for consideration. Firm behavior is a cognitive and a structural process.
8
The concept of attention has a long history and tradition in organization theory.
“Everyone knows what attention is. It is the taking possession by the mind, in clear and vivid
form,…Focalization, concentration of consciousness are of its essence….”(James, 1890). For
Simon (1947), attention was referred to the set of elements that enter into consciousness at any given time, and was constrained by human limits on memory and computing power. Organizations influence individual decision-making by allocating and distributing the stimuli that channel the attention of administrators in terms of what selected aspects of the situation are to be attended, and what aspects are to be ignored. March and Olsen (1976) argue that there is a set of structural constraints on the allocation of attention, and there is a pattern of individual action within the constraints. The attention structures exist because of the interdependencies among the actions of individuals, the distribution of individual competences, and the distribution of values and resources across individuals.
Early work on attention has emphasized how attention is shaped by routines and bounded rationality (Cyert & March, 1963; March & Simon, 1958), and how attention is loosely coupled through enactment processes (Weick, 1979) and organized anarchy( Cohen, March, & Olsen, 1972). However, different scholars have emphasized different aspects of attention allocation and structuring, but ignored others. The concept of attention has not developed into a unified perspective on firm behavior (Ocasio, 1997).
9
available repertoire of categories for making sense of the environment) and answers (the available repertoire of action alternatives). ABV focuses on how attention in organizations shapes organizational adaptation.
10
Meanwhile, overall attention to attention employing a wide variety of meta-theories has also been flourished (Kaplan, 2008; Nadkarni & Barr, 2008; Weick & Sutcliffe, 2006). For instance, Weick and Sutcliffe (2006) have challenged the Carnegie School assumption that attention is a scarce resource and contended that when the allocation of attention is done with discipline, such as with the mindfulness emphasized in Buddhist psychology and philosophy, attention can be plentiful and sufficient and can be paid to different problems by decision makers.
Despite the increasing attention to attention in the last decade, the research has led not to a cumulative body of work but led to a variety of often disparate findings. The main reason for this is that the research on attention relies on both different meta-theories and different definitions and understanding of the construct of attention itself. In a recent review study, Ocasio (2011) examines attention in light of recent developments in the cognitive
11
Ocasio (2011) further applies this framework to the behavioral theory of the firm. Specifically, within BTOF, “attentional perspective is shaped by organizational experience with existing decision and attentional rules;” “attentional engagement is triggered by failure to meet aspiration levels, leading to local search and organizational learning in decision and attentional rules;” “attentional selectivity is the resulting outcome of sequential attention to alternative aspiration levels, as well as attentional engagement that results in guided search (Greve 2008).”
12
empirical investigation of how contextual factors such as firms’ characteristics including size and age affect the attention allocation patterns.
2.2 Multiple Goals and Sequential Attention
Organizations are thought to have a wide range of goals: profitability such as return on assets ( Audia, Locke, & Smith, 2000; Bromiley, 1991; Greve, 2003a, 2003b, 2003c; Lant, Milliken, & Batra, 1992; Miller & Chen, 2004), productivity and sales (Audia & Sorenson, 2001), market share and status (Baum, Rowley, Shipilov, & Chuang, 2005), and size (Greve, 2008). The availability of multiple and potentially conflicting performance aspirations or goals is a pervasive feature of organizations. These different performance goals are often contradictory since they aim to capture different aspects of performance (Meyer, 2002; Meyer & Gupta, 1994). For example, Business Week ranks companies in the Standard & Poor’s 500 by using eight criteria of success that often diverge considerably (Business Week, 2004). The balanced scorecard approach is directed at fine-grained non financial performance measures such as customer, internal business, and learning and growth. It is designed to serve as a guide to strategy and managerial action (Kaplan & Norton, 2001), though it does little to help our understanding of how organizations deal with multiple performance goals that can be contradictory.
The issue of multiple goals is intimately tied to Simon's (1947) notion of bounded rationality. According to the BTOF (Cyert & March, 1963), organizational goals (e.g. production goals, inventory goals, sales goals, market share goals, and profit goals) are a series of more or less interdependent2 constraints imposed on the organization through a
2The original work uses “more or less independent” instead of “more or less interdependent”. The author
13
process of bargaining among potential coalition members and elaborated over time in response to environmental pressures. Goals arise in such a form because the firm is a coalition of participants with disparate demands, changing foci of attention, and limited ability to attend to all organizational problems simultaneously. More specifically,
organizations factor their decision problems into sub-problems and assign the sub-problems to subunits in the organization. As a result of local rationality, this reduces to solving one problem in terms of only one goal at the subunit level. The sales department mainly focuses on sale goals and sales strategy; the production department is primarily responsible for production goals and procedures; and the pricing department is primarily responsible for price decision and profit goals. Thus, most of organizations most of the time exist and thrive with considerable latent conflict of goals.
For Cyert and March (1963), there are three main mechanisms to resolve inconsistent goals across divergent coalitions. The first is to leverage acceptable-level decision rules, one characteristic of the decision making process. Acceptable-level decision rules facilitate the decision making process by requiring that local decisions satisfy local demands. Such
decisions are made by separate decision centers thus resulting in a joint solution that satisfies all demands. However, different local demand constraints do not uniquely define a solution. And more importantly, acceptable-level decision rules often require excess (slack) resources to absorb potential inconsistencies in the local decisions. Slack can partially resolve the conflict among multiple goals, especially when organizations experience low performance, since slack can provide opportunities for organizational change (Levinthal & March, 1981),
14
and serve as a buffer against low performance. Slack can also be used as a buffer to protect against external shocks and future uncontrollable contingencies (Milliken & Lant, 1991), as well as experimentation with innovation (Bourgeois, 1981; Nohria & Gulati, 1996).
Second, the resolution of inconsistent goals may occur via decentralization of decision making, e.g., the use of organization structures to map decision makers to goals. Burton and Obel's work has examined both single goals (Burton & Obel, 1980) and multiple goals among subunits (Burton & Obel, 1988) by comparing M-form and U-form structures under organizational design framework. Specifically, Burton and Obel (1980) find the M-form yields superior perM-formance in comparison with the U-M-form, especially so in nearly decomposable technological regime. Burton and Obel (1988) further compare the M-form and U-form structures under incentives (corporate and division) framework using a laboratory experiment. Although they do not address the problem of attention allocation among multiple goals under different organizational structures, they provide important implications for future investigation in this research vein.
15
The resulting time under buffer between multiple goals permits organizations to solve one problem at a time, attending to one goal at a time (Cyert & March, 1963). Much of the
literature in this vein is theoretical in nature, though a small empirical literature in accounting has examined this issue as well.
Earlier work has modeled multiple goals using a parsimonious approach. For instance, Miller and Chen (2004) have investigated the effects of multiple measures of profitability on risk taking. This approach treats the goals as alternative measures of the same construct which is appropriate for closely related goals, but not for qualitative goals, such as quality, sales, and productivity. Later work on multiple goals has showed certain reason for the existence of goal interdependencies. Baum et al. (2005) analyzing two different
organizational goals indicate that failure to fulfill one goal was enough to trigger risk taking behavior. Audia and Brion (2007), in an experimental and a field study, examine how decision makers respond to the ambiguity introduced by two diverging performance goals of unequal importance, and find mangers shift their attention from a primary to a secondary performance goal especially when the secondary performance goal was high and the primary performance goal was low, confirming managers’ self-enhancing mechanism.
Among the few studies examining multiple goals and/or how firms shift their focus among multiple goals of different performance dimensions, Greve's (2008) work appears to be the first and the only empirical demonstration of sequential attention to goals in
16
satisfied. More recently, Ethiraj and Levinthal (2009) explore the trade-offs inherent in the pursuit and fulfillment of multiple performance goals in complex organizations using computational methods. They find that the simultaneous pursuit of multiple performance goals leads to a lock-in to the status quo bias, which counterintuitively could be mitigated by goal myopia, spatial differentiation, or temporal differentiation of performance goals. In their working papers, Joseph and his colleagues (Joseph, 2010a, 2010b; Joseph & Gaba, 2010) have extended the research on multiple goals by examining the relationship between goal interdependencies and organizational search, performance feedback of hierarchical goals and innovation, and TMT’s focus on global or local goals and new product introduction.
Moreover, in the psychology literature, a multiple-goal, multilevel model of feedback effects on the regulation of individual and team performance has been proposed (DeShon,
Kozlowski, Schmidt, Milner, & Wiechmann, 2004). Another study specifies that the
individual's proximity to goal attainment and their emotions in completing the task define the model of multiple-goal pursuit (Louro, Pieters, & Zeelenberg, 2007).
The above studies provide important implications for my investigation, however, there are several limitations in the current literature on goals. First, most of current studies have typically focused on a single goal, and thus lacked the investigation of the long-run relationship and competitive interaction among multiple goals within organizations.
Theoretically, the more numerous the goals are, the more likely goals can confuse and dilute the allocation of attention, and the more important the role of goals and goal priority play in directing the attention of decision makers. Second, most of the extant studies have focused on financial performance goals but ignored other important performance goals such as
17
important for explaining organizational behaviors as they are widely considered as ends, it is worthwhile to consider other goals as means by which financial performance goals are achieved. Some recent studies have tried to move toward this direction by examining a broad set of strategic behaviors, including illegal behavior (Mishina, Dykes, Block, & Pollock, 2010), search (Chen & Miller, 2007), and learning (Baum & Dahlin, 2007). Third, “…goals are no more nature-given than aspiration levels are – organizational goals are constructed
by managers and assigned to other managers or workers. They in turn construct their goals
that may differ from the assigned ones” (Greve, 2003c:70). For instance, even if top
18
future work to integrate some aspect(s) from other theoretical views such as the managerial choice of importance or goal priority from Ansoff’s (1979) view.
2.3 Adaptive Aspirations and Performance Feedback
Aspiration levels are “the smallest outcome that would be deemed satisfactory by the
decision maker” (Schneider, 1992: 1053) or “reference point that is psychologically neutral”
(Kameda & Davis, 1990: 56). Adaptive aspirations have long been recognized as significant to understanding subjective utility and choice behavior (Selten, 1998; Siegel, 1957; Simon, 1955, 1956). The decision maker observes feedback from the environment and compares it with a goal or an aspiration level, and searching is started if the aspiration level is not met (Cyert & March, 1963). Thus, the process of performance feedback in the BTOF is portrayed as an organizational decision process (Greve, 2003c).
Built on the BTOF, there are two streams of research on aspiration levels. The first set is the determinants of aspiration levels. Due to the unobserved nature of the aspiration level in most contexts, rarely did research directly study aspiration levels. Exceptions include Lant and Montgomery (1987), Mezias, Chen, and Murphy (2002), and Blettner, He, Hu, and Bettis (2012). Most extant research on aspirations has used some proxies to measure the aspiration level. These have mainly fallen into two mechanisms. The first mechanism
assumes that organizations set their goals based on their historical performance and historical aspirations. March (1988) analyzes a model of risk taking where the aspiration level is built on a certain weight of the past performance and a certain weight of the past goal. The second mechanism assumes that organizations set their goals based on comparable others’
19
the notion of social comparison theory (Festinger, 1954) from individuals to organizations. Furthermore, most current research on adaptive aspirations has examined the effect of both historical and social aspirations (Baum et al., 2005; Bromiley, 1991; Greve, 2003c; Herriott, Levinthal, & March, 1985; Knudsen, 2008; Miller & Chen, 2004).
Most extant literature on social aspirations and reference groups has used the industry average or median as the social aspiration level. There are only a few exceptions. For
example, Bromiley (1991) uses striving aspirations by adding an adjustment factor of 1.05 for firms performing above their aspiration level in his study of corporate risk taking. Massini, Lewin, and Greve (2005) propose that innovating firms are more likely to select other innovating firms as their reference group and imitating firms are more likely to select the average firm in the population, or in the sub-population of non innovators, as their reference group. They also argue that the selection of a reference group is a crucial and neglected source of firm heterogeneity. Greve (2008) uses the firms with the similar size and performance to the focal firm as the reference group. Knudsen (2008) considers the situation in which firms may use the average of another population with higher performance as social reference point if they could afford the switching costs of moving to another population. Indeed, Hu, Blettner, and Bettis (2011) have suggested that firms’ reference group setting strategies are bundled with risk taking, and the effectiveness of heterogeneous strategies for setting reference groups varies under different contexts.
20
their aspiration levels, and risk averse above them, is central to modern theories of individual and organizational choice (Cyert & March, 1963; Kahneman & Tversky, 1979; March, 1988). Attainment discrepancies have been considered as consequential for motivating all types of firm behavior including business-level strategy (Greve, 1998); firm risk taking (Bowman, 1982; Bromiley, 1991; Miller & Bromiley, 1990; Miller & Chen, 2004; Singh, 1986; Wiseman & Bromiley, 1996; Wiseman & Gomez-Mejia, 1998), organizational learning ( Greve, 2003c); innovation (Greve, 2003a; 2003b), decisions on R&D search (Chen, 2008; Chen & Miller, 2007), new product launches (Greve, 2007); corporate acquisition strategy (Iyer & Miller, 2008); and divestiture (Shimizu, 2007).
Recent studies on aspirations have extended the single reference point theory and proposed two other references points, survival and slack. Specifically, empirical
investigations of choice by organizations indicate that organizational risk-taking behavior changes significantly at the extremes of performance. Some research suggests that when decision makers are at a certain distance below their normal reference point, they shift their attention to the survival point (Lopes, 1987; March & Shapira, 1987, 1992) and become risk averse (Staw, Sandelands, & Dutton, 1981), e.g., they may be less likely to initiate
acquisitions (Iyer & Miller, 2008) and more likely to engage in divestitures (Shimizu, 2007). There are some voices of opposition (Audia & Greve, 2006). A few studies suggest that increasing threats to survival stimulates greater and greater risk taking, presumably as an attempt to escape the threats (Bowman, 1982; Gooding, Goel, & Wiseman, 1996; Miller & Chen, 2004).
21
increased risk taking has been established (Singh, 1986). Some early studies (e.g. Mansfield, 1961) have associated high levels of slack with high levels of innovation. The BTOF (Cyert & March, 1963) suggests that the presence of slack resources enables firms to increase slack search through activities such as innovation (Nohria & Gulati, 1996), organizational change (Kraatz & Zajac, 2001), and expansion through acquisition (Iyer & Miller, 2008). However, there are also some contradictory findings. Miller and Chen (2004) find no support for the positive relationship between slack and risk taking in spite of using multiple measures for key variables. Based on computational modeling, Hu, Blettner, and Bettis (2011) introduce into the previous models of adaptive aspirations a new risk preference function that
incorporates changes in risk preference at extremes of performance, and find important differences in outcomes from earlier studies which invite further studies on managerial goal setting. Though the determination on reference point number and managers’ risk preference function is not the focus of the current study, this extension of studies beyond the scope of the BTOF has wide implications to organizational performance.
22
CHAPTER 3
RESEARCH PROPOSITIONS
Built on the theoretical foundations, this chapter develops three exploratory propositions.
3.1 Sequential Attention and Discretionary Attention
Organizations are characterized by the availability and presence of multiple and potentially inconsistent goals. According to the BTOF (Cyert & March, 1963),
organizational goals are a series of more or less interdependent3 constraints imposed on the organization through a process of bargaining among potential coalition members and elaborated over time in response to environmental pressures. The Carnegie School
perspective suggests that decision makers have limited attention capacity, and multiple goals compete for limited organizational attention (Cyert & March, 1963; March & Simon, 1958; Simon, 1947). The gain of attention by one goal is accompanied by the loss of attention by other goals. Furthermore, the BTOF suggests that organizations sequentially attend to
multiple goals. Sequential attention is a form of quasi-resolution of conflict that lets decision makers treat different goals as constraints to be satisfied in some order of priority rather than as trade-offs that have to be weighed against each other (Cyert & March, 1963; Greve, 2008). Organizations distribute their attention to multiple goals in a “fire station” manner. The resulting time buffer between multiple goals permits organizations to attend to one goal at a
3Empirical research has ignored this interdependency. Interdependency does not arise in studies of a single goal,
24
time and move on to the next goal when the focal goal is satisfied (Cyert & March, 1963: 117-119).
Sullivan (2010) finds attention is guided by “urgency” induced by the aggregate flow of new problems, which is also partially consistent with the sequential attention rule. As the only empirical demonstration of attention allocation to multiple organization-wide goals, Greve's work (2008) proposes that managers form an aspiration level for size through social comparison and they attend to financial performance prior to the size goal. This greatly enhances our understanding of attention allocation between two goals at the firm level. However, firms and their subunits each can and obviously do have more than two goals. The increasing number of goals reflects the increase of interdependent constraints (Simon, 1955). Multiple constraints further increase the complexity of decision making, information
processing, and attention allocation (Cyert & March, 1963; Simon, 1964; Sullivan, 2010). Specifically, when firms or subunits encounter two goals, there are two alternatives of attention allocation. The first is to attend to two goals, perhaps with unequal attention, at a time. The second is to attend to only one goal at a time, which is consistent with the behavioral theory of the firm. With switching, there is no decision since there is only one other goal. When the number of goals is greater than two, the theoretical issue of which goal to attend to sequentially becomes more realistic, more complex, and more interesting
25
goals are attended is not uniform across organizations but depends on the preferences of the “dominant coalition” of each organization (Cyert & March, 1963: 26-32).
Moreover, the sequential attention rule focuses on a strict sequence in which one goal has to be satisfied prior to other goals. However, observations in organizations suggest the situation is more complex. Organizations might primarily focus on one goal at a time, but they are not likely to completely shift their attention away from one goal to another at any time. Put differently, it is almost impossible for organizations to focus all attention on a single goal and switch all attention to another when the current one is satisfied. Competence building in any goal variable or performance dimension needs investment over time. It is difficult for firms to gain competitive advantage from time compression diseconomies when they allocate discontinuous attention to goals (Dierickx & Cool, 1989). Specifically, for automotive makers, they have to maintain some minimum amount of attention/effort in safety and efficiency dimensions because of government mandates. More importantly, the resources used to achieve these goals, for example, specialized engineering expertise, are sometimes not fungible. Furthermore, different goals in organizations represent different interests of coalitions within organizations (Cyert & March, 1963), so it is generally impossible for the interest of any coalition to be ignored. Thus, attention allocation to multiple goals is not a strict sequence in which one goal has to be addressed prior to other goals, but instead it takes the form of varying the distribution of attention across multiple goals over time. Hence, each goal within an organization draws some minimum level of attention (referred to as nondiscretionary attention) to keep the organization functioning. Organizations also have discretionary attention4, which is regulated by managers’ own
4The distinction between discretionary and nondiscretionary attention is similar to the notion of unabsorbed and
26
discretion or judgment and available for use as needed or desired. The total attention in an organization is the sum of discretionary and nondiscretionary attention. Therefore, the key question of attention allocation is how to distribute the discretionary attention to multiple goals over time.
Overall, as a third goal increases the complexity of attention allocation, more concepts besides sequential attention must be incorporated into the theory of attention allocation among multiple goals. Building on the current literature, I therefore propose the following to guide the empirical exploration:
Exploratory proposition 1: Attention allocation is not a question of all or nothing.
Attention is composed of discretionary and nondiscretionary components. Organizations shift
discretionary attention among goals across time.
3.2 Interdependencies of Goals
Firms are frequently characterized by interacting organizational components (Rivkin, 2000; Siggelkow, 2001), including organizational goals (Ethiraj & Levinthal, 2009).
According to Thompson (1967), there are three types of interdependence in an organizational structure. Pooled interdependence is considered as the loosest form of the interdependence. It occurs when each organizational department or business unit performs completely separate functions. As departments may not directly interact and do not directly depend on each other in decision making, there is an almost blind, indirect dependence on the performance or goals of others. Sequential interdependence occurs when one unit in the overall process produces an output necessary for the performance by the next unit. The demand for coordination to prevent slowdown is greater than for pooled interdependence. Reciprocal interdependence is
27
similar to sequential interdependence in that the output of one department becomes the input of another, with the addition of being cyclical. Reciprocal models are the most complex and difficult to manage, as they require the highest intensity of interaction.
Similarly, as multiple organizational goals impose a series of more or less interdependent constraints on the organization (Cyert & March, 1963), they can have
different levels of interdependence. Goals can be independent or interdependent. Independent goals are those which are weakly correlated or uncorrelated to one another. Interdependent goals include congruent and divergent goals. Congruent goals are those which are positively correlated whereby the satisfaction of one will lead to the satisfaction of another. Divergent goals are those which are negatively correlated and for which the satisfaction of one may come at the expense of declining performance on another. Divergent goals may not only introduce coordination problems and inhibit the search for information in attention allocation (Beyer, 1981; Mitroff & Emshoff, 1979), but also create latent or overt conflict within the organization (Cosier & Rose, 1977; March & Simon, 1958; Pondy, 1967).
Thompson (1967) further suggests that organizations manage each of the three types of interdependence with different coordination methods. Similarly, goal interdependencies have several implications for attention allocation to multiple goals. First, the interdependency of goals may directly impact the complexity of decision making and affect the information processing capacity of the firm (Simon, 1955). Consequently, the effectiveness of
28
reflect normative environments and the degree to which cooperation exists and ideas are shared. Shared goals typically increase knowledge sharing within the firm (Birkinshaw, 1997; Tsai & Ghoshal, 1998), though pressure for joint decision-making may also supply one of the necessary conditions for internal comparison and conflict (March & Simon, 1958: 124). Thus, the effectiveness of search or attention allocation processes may be conceived as an outcome determined by the ease of coordination driven by goal congruence and the consequences of conflict driven by goal divergence. A complete theory of attention allocation among goals must include the impact of goal interdependence or correlation structures.
Based on the discussion above, I therefore propose
Exploratory proposition 2: Goals within organizations have complex correlation
structures, and these matter to decision making in attention allocation.
3.3 Context Dependence of Attention Allocation
Researchers have generally assumed that problemistic search changes as a continuous function of the performance level (Bromiley, 1991; Lant et al., 1992) and that the strength of the reaction varies depending on whether performance is above or below the aspiration level (Greve, 1998). Consistent with literature (Lant, 1992; Lewin et al., 1944), attainment
discrepancy is defined as the difference between performance and the aspiration level.
29
2003a; Lant et al., 1992). Similarly, higher growth in any performance dimension can be a result of risk taking due to low performance in that dimension. This is because problemistic search may lead to discovery of actions that increase growth, and these actions may increase risk since change is always risky. The effect of any goal variable with positive attainment discrepancy should be considered separately. Managers in a gain situation will be motivated to lock in the high performance of goal variables and less willing to take risk (Kahaneman & Tversky, 1979). Thus, the goal is less likely to be active in firms with the performance of that goal variable above the aspiration level, so the relation between a goal variable and its
growth becomes weaker.
30
with other goal variables. Therefore, I would expect the effects of goal variables’ attainment discrepancies on their growth not to be homogeneous. This also implies that the correlation structure of goals could be some form of context dependence of attention allocation (Ocasio, 1997).
Moreover, Ansoff (1984) identifies multiple goals across various categories: society, community, shareholder, lender, customers, managers, and employees. He argues that goals have a priority in a hierarchy, and there is the potential for a specific goal to interact with, or moderate the influence of, another (Shinkle, 2012). Scholars have suggested that the order in which goals are attended ( the priority of goals) is not uniform across organizations but depends on the preferences of the “dominant coalition” of each organization (Cyert & March, 1963). Managers may allocate their attention following various rules (March & Shapira, 1992; Ocasio, 1997). Therefore, the firm level in addition to the subunit level could be another form of context dependence of attention allocation (Ocasio, 1997).
These arguments lead to the third proposition
CHAPTER 4 METHODS
4.1 Sample and Data Collection
32
mandates various requirements that represent external shocks and translate into goals for fuel efficiency and safety. Hence, the automotive industry provides a good opportunity to
thoroughly examine how organizations allocate attention across multiple product goals over time.
33
Noteworthily, each automobile company can have multiple nameplates, and each nameplate can have multiple automobile models. For instance, Toyota Motor Corp has three different nameplates: Toyota, Lexus, and Scion. Under Toyota nameplate, there are different auto models including Accord, Civic, and Odyssey. The data of goal variable measures were collected and analyzed at the auto model level.
I used three primary sources of data. The data for performance measures, car category, price, and other rating information were manually collected primarily from Consumer
Reports (CR). As the most important, independent, and reliable source of auto information,
this magazine provides scientific test results and ratings of hundreds of car products every year through frequent car road tests and wide customer surveys. The vehicle models assigned with low ratings by CR may suffer from decreasing demand or even be terminated by the auto makers. For example, Acura SLX was rated as “not acceptable” in 1997 and it was discontinued by Acura in 2000. I also validated and supplemented these data with the data from the Insurance Institute for Highway Safety (IIHS), the National Highway Traffic Safety Administration (NHTSA), and the US Environmental Protection Agency (EPA). The sales data and market share data were manually collected from Automotive News, a weekly automotive industry magazine. For in-depth coverage of automotive industry with special features, industry dynamics, and technology breakthroughs, I referred to automobile magazines including Motor Trend, Car and Driver, and Wards Auto Year Book. I retrieved data on firm level financial and operational data from the COMPUSTAT dataset of Global Annual and North America Annual.
34
different auto companies. These interview data further grounded my thinking about the industry. In particular, they strengthened my understanding of the causal mechanisms underlying attention allocation pattern(s) and helped me choose more accurate measures. They also helped in interpreting the results.
4.2 Variables and Measurement
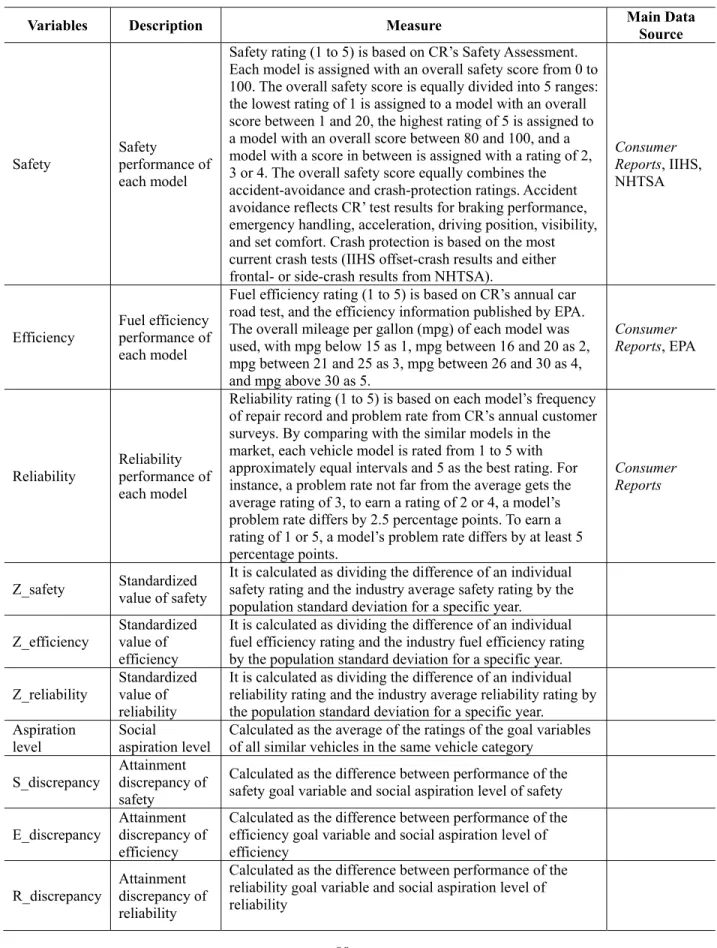
Automakers have goals on safety, fuel efficiency and reliability, and measure performance relative to those goals. Reliability, also referred to as durability, is widely considered as one of the most important car performance measures. It is calculated based on frequency of repair records including body exterior, interior, engine mechanical, engine electrical, and so forth. Though different consumers have diverging perspective when buying a new or used car, no purchaser wants a vehicle that breaks down often and requires serious repairs throughout its life. Thus, car reliability is a key performance dimension. The
“predicted reliability” measure from CR is used as the indicator of car reliability. It is based on auto engineers’ expert knowledge of new models and CR’s unique Frequency-of-Repair data for past models. Any predictions on new models are based on a model’s history because new models are mechanically similar or identical to earlier models. Reliability shows the average problem rate from all models in the survey year by year5.By comparing with the similar models in the market, each auto model is rated from 1 to 5 with approximately equal intervals and 5 as the best rating. Specifically, a problem rate not far from the average (7-9.2%)6 gets the average rating of 3, to earn a rating of 2 or 4, a model’s problem rate differs
5CR surveys hundreds of thousands of its subscribers or readers to collect the data of the problem rate of each
35
by 2.5 percentage points. To earn a rating of 1 or 5, a model’s problem rate differs by at least 5 percentage points.
Safety is another extremely important car performance indicator and must meet
requirements externally imposed by government. For instance, NHTSA and IIHS
scientifically test new vehicle models and publish the crash test results each year. The safety rating from CR is collected as the indicator of car safety. CR has developed a Safety
Assessment System, in which each model is assigned with an overall safety score from 0 to 100. The overall safety score is equally divided into 5 ranges: the lowest rating of 1 is assigned to a model with an overall score between 1 and 20, the highest rating of 5 is assigned to a model with an overall score between 80 and 100, and models with a score between 21-40, 41-60, or 61-80 are assigned with a rating of 2, 3 or 4, respectively. Specifically, the overall safety score equally combines the accident-avoidance and crash-protection ratings. Accident avoidance reflects CR’s test results for braking performance, emergency handling, acceleration, driving position, visibility, and seat comfort. Crash protection is based on the most current crash tests (IIHS offset-crash results and either frontal- or side-crash results from NHTSA), which are weighted according to experts’ judgment of their importance and the percentage of the time a particular seat is likely to be occupied.
The third performance measure is fuel efficiency, which is important to consumers and the goal is also imposed by government. EPA measures the fuel efficiency of auto models before they are released to the market. I coded the fuel efficiency for each model from 1 to 5 using the rating from CR and EPA. The overall mileage per gallon (MPG) of
6The conversation with the director of the auto test center in Consumer Union suggests that the average problem
36
each model was used, with MPG below 15 as 1, MPG between 16 and 20 as 2, MPG between 21 and 25 as 3, MPG between 26 and 30 as 4, and MPG above 30 as 5. The test equipment and test procedure were not changed significantly until 2010 when the electric car was introduced. For instance, Nissan Leaf, an electrical car going on sale in Dec 2010, is estimated in kilowatts per hour, but its economy is displayed as 99 MPG by EPA, even though the car uses no “gallons” and, indeed, no fuel in the traditional sense.
Conversation with experts at Consumer Union further confirmed that the ratings are reported as linear data after transforming from raw data for the ease of understanding. It also suggested that the intervals between different ratings are approximately equal, and the
difference between them is interpretable. Moreover, the rating systems of three goal variables have been very consistent during the observation periods. This supports the validity of fitting continuous statistical models to the data7.
Prior research has suggested that organizational decision makers construct aspiration levels from organizational reference groups using multiple criteria (Fiegenbaum & Thomas, 1995; Porac & Thomas, 1990; Reger & Huff, 1993) and that market participation is
particularly important for choosing reference groups (Clark & Montgomery, 1999). Despite these findings, studies on social aspiration levels have typically used the mean or median performance, which implies that all organizations in the reference group are equally influential on a focal organization (e.g. Audia, Locke, & Smith, 2000b; Fiegenbaum &
7Traditionally, transforming continuous raw data to ordinal categorical data will lose some information of raw
37
Thomas, 1988; Greve, 1998). A few exceptions (e.g. Baum et al., 2005; Greve, 2008) show that aspiration levels weighting firms by similarity gave stronger findings than those using the unweighted mean. Moreover, in the empirical setting of the automotive industry, automakers form different reference groups for each niche market/category such as small cars or SUVs. Consequently, it is unreasonable to compare a small car’s safety with that of an SUV or a truck, or set a truck’s fuel efficiency goal based on the small car’s fuel
efficiency performance. Therefore, I categorized the auto models into 15 niche markets8 based on the information from car purchase guidance providers including Consumer Reports,
Edmunds, JD Power, and etc. Social aspiration level of each goal variable for a model in a
specific year is calculated as that goal variable’s average performance of all auto models in the same category as the focal model. Attainment discrepancy is calculated as the difference between each goal variable’s performance and the corresponding social aspiration level.
Change of performance / performance growth is calculated as the first difference of the
ratings for each performance dimension.
I also controlled model size, calculated as the logarithm of revenues of models, and model age, calculated as the logarithm of age. Table 3 summarizes all variables and their measures used in the dissertation.
4.3 Statistical Method
Proposition 1 states that attention allocation is not a question of all or nothing and attention includes both discretionary and nondiscretionary components. Proposition 2 states that goals within organizations have complex correlation structures. To explore those two propositions, I need to examine the relationships among fuel efficiency, safety, and reliability
8Niche markets refer to as small cars, compact cars, family sedans, large cars, sporty cars, upscale sedans,
38
over time. Estimating the relationship among the three goals across time is difficult because the three are determined endogenously. The literature (e.g. Holtz-Eakin, Newey, & Rosen, 1988) suggests that the interplay of three performance dimensions as a dynamic coevolving system of interdependent variables is best described in the context of a Vector
Autoregression (VAR) model. Because data are collected on numerous auto models at a yearly frequency, I am able to employ a Panel Vector Autoregression (PVAR) model. The PVAR combines the traditional VAR approach which captures co-evolution and
interdependencies between multiple time series and treats all the variables in the system as endogenous, with the panel data approach which corrects for unobserved individual
heterogeneity. Because of the complicated dynamics in the VAR, impulse responses are often more informative in understanding the evolution of interdependent variables over time than the raw estimated VAR regression coefficient, and they are reported as a standard practice in the VAR analysis (Stock & Watson, 2001). Simulation of each of the three estimated
equations from the VAR analysis is usually used to examine the temporal response of each variable to the shock of each other variable. These simulations are called impulse response functions (IRFs) and can yield important insights. Specifically, IRFs show the response of one variable of interest (e.g. safety) to a shock in another variable of interest (e.g. fuel efficiency), while holding other shocks constant. Plotting IRFs graphs is a practical way to visually represent the behavior of the variable series in response to the various shocks (Enders, 2010). A discussion of the standard VAR model is presented in Appendix A.
The PVAR methodology has several econometric advantages. It does not impose any
a priori causal structure on the relationship between the variables in the model. Instead, all
39
of the past values of each other. This enables us to estimate, for example, the total reduced-form effect that a past increase in fuel efficiency had on each of the other dependent variables and how those changes move over time. I specify a first-order three-variable VAR model as follows:
Xit = A0 + A1Xit-1 + fi + et (1)
where Xit is the three-variable vector: {z_safety, z_efficiency, z_reliability}; z_safety is the
standard score of safety, z_efficiency is the standard score of efficiency, and z_reliability is the standard score of reliability.
In applying the VAR procedure to panel data, we need to impose the restriction that the underlying structure is the same for each cross-sectional unit. One way to overcome the restriction on parameters is to allow for “individual heterogeneity” in the levels of variables by introducing fixed effects of the model, denoted by fi in the model. Since the fixed effects
are correlated with the regressors due to lags of dependent variables, the mean-differencing procedure commonly used to eliminate fixed effects will create biased coefficients9. I use forward mean-differencing, also referred to as the Helmert procedure (Arellano & Bover, 1995; Eakin, Newey, & Rosen, 1988), to avoid this problem. This procedure removes only the forward mean, i.e., the mean of all the future observations available for each model year. This transformation preserves the orthogonality between transformed variables and lagged regressors, I use lagged regressors as instruments and estimate the coefficients by system generalized method of moments (GMM).
9The inclusion of lagged dependent variables can be a source of bias for fixed-effect estimation of dynamic
40
I focus my analysis on the IRFs, which describe the reaction of one variable in the systems to the innovations in another variable in the system, while holding all other shocks at zero. However, since the actual variance/covariance matrix of errors is not sufficient to identify the primitive system, and unlikely to be diagonal, additional restriction on the three-variable VAR system must be imposed in order to identify the impulse response. The usual convention is to adopt a particular ordering using the Choleski decomposition such that
z_safety does not have a contemporaneous effect on z_reliability10. The identifying assumption is that the variables that come earlier in the ordering affect the following variables contemporaneously, as well as with lags, while the variables that come later only affect the previous variables with lags. In other words, the decomposition forces a potentially important asymmetry on the system, and the variables that appear earlier in the system are more exogenous and the ones that appear later are more endogenous. Since, in this study, there is no theoretical reason to suppose that one variable has no contemporaneous effect on the other, the usual practical procedure is to obtain the impulse response function using a particular ordering. Compare the results to the impulse function obtained by reversing the ordering11. If the implications are quite different, additional investigation into the relationship between the variables is necessary (Enders, 2010: 311). To analyze the IRFs I need some estimate of their confidence intervals. Following Love and Zicchino (2006), I report standard errors of the IRFs by using Monte Carlos simulation to generate the confidence intervals.
10Choleski decomposition of variance/covariance matrix of residuals procedure is equivalent to transforming the
system in a “recursive” VAR for identification purposes. See Appendix A for the derivations and further discussion of impulse-response functions.
11The main results from PVAR model reported in this study are based on the model with the ordering of safety,
41
The dataset needs to meet two major requirements for the PVAR methodology: comparability and stationarity. In order to make the three performance dimensions
comparable with each other, the original goal variables were time-demeaned. In other words, each model-year observation for three indicators was standardized using that year’s mean and standard deviation, respectively. Moreover, each of three variables was also found to be stationary using a Fisher-type unit root test for panel data12 (further results in Appendix B). To ensure the consistency of the reduced-form VAR coefficient estimates, the appropriate lag structure needs to be determined. I selected the lag length that minimizes goodness-of-fit statistics, specially the Akaike information criterion (AIC) and the Bayesian information criterion (BIC). I settled on a lag length of one (further results refer to Appendix C).
Proposition 1, stating that attention allocation is not a question of strictly all or nothing, was explored by the significance level of the estimated coefficients. If sequential attention is a strict sequence one goal has to be addressed prior to other goals. Hence, the coefficients between one goal’s performance and other goals’ past performance will not be significantly different from zero. The reason is that if organizations allocate all of their attention to one goal at a time, the focal goal variable’s performance will be positive, while other goal variables’ performance will drop to zero statistically13 if goals are independent. Proposition 2, stating that goals have complex correlation structures, is explored by a combination of estimated coefficients and IRF graphs. The estimated coefficients show the correlation coefficients of goals, and the IRF graphs visibly show the interdependencies of
12Fisher-type test for unit root does not require strongly balanced data, and the individual series can have gaps
(Maddala & Wu, 1999).
13An intuitive example would be that, assume an organization has a constant amount of 100 engineering
42
goals and how one goal variable’s increase will affect other goals’ performance in the following period(s).
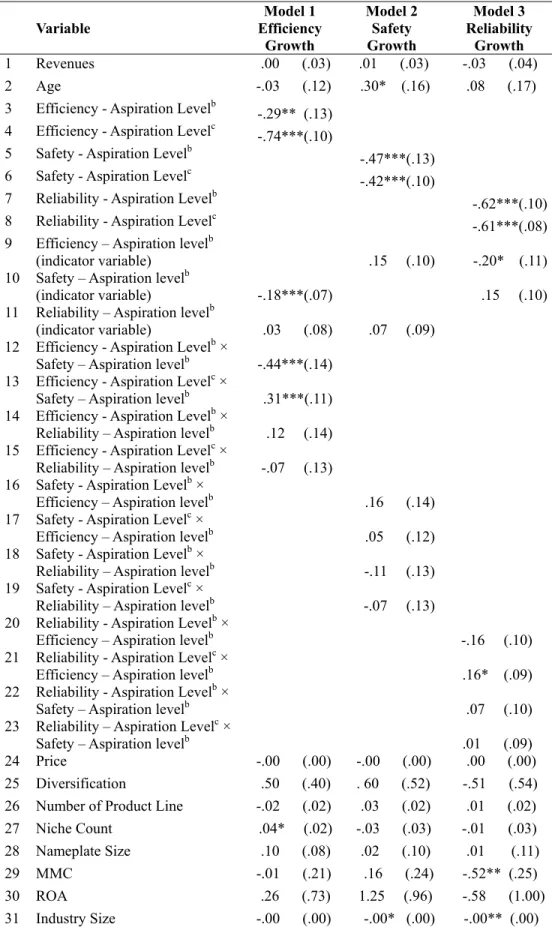
To explore Proposition 3 I would like to estimate the growth of each goal variable as a function of all goals’ past growth and their attainment discrepancies, with auto model fixed effects and size and age effects controlled. This will allow me to observe auto model fixed effects and the effect of different goal correlation structures on attention allocation with endogeneity of goals controlled. However, current statistical technology does not support running VAR model in panel data with control /exogenous variables included. Although the VAR test for each auto model (time series data) is allowed to include control variables, there is a problem with the length of the time periods. There are only a few auto models with enough observations. The VAR test results from those auto models demonstrate the difference at the auto model level. Hence, I resort to the next best method as a first order approximation, where I could pool data together and run separate regressions of each goal variable’s growth on their own attainment discrepancy, the interaction of attainment
discrepancy with a second goal variable’s status (below/above the aspiration level), and the auto model fixed effects. This is consistent with the method in Greve’s (2008) study, where he develops the method of interacting each of two goal variables with a dummy variable indicating whether the second goal variable has been satisfied specifically to test the sequential attention hypothesis. The innovation in this paper is to explore potentially different attention allocation patterns for goals with different correlation structures14 and possible heterogeneous model level fixed effects. While this method does not solve all the
14I only focus on interaction of attention allocation of any two of the three goals in this study, as the dissertation