Molecular Stratification and Characterization of
Clear Cell Renal Cell Carcinoma
Angela Rose Brannon
A dissertation submitted to the faculty of the University of North Carolina at
Chapel Hill in partial fulfillment of the requirements for the degree of Doctor of
Philosophy in the Curriculum in Genetics and Molecular Biology.
Chapel Hill
2010
Approved by:
W. Kimryn Rathmell, MD, PhD
Adrienne Cox, PhD
©2010
ABSTRACT
ANGELA ROSE BRANNON: Molecular Stratification and Characterization of
Clear Cell Renal Cell Carcinoma
(Under the direction of W. Kimryn Rathmell, MD, PhD)
It is estimated that there will be 58,240 new diagnoses of kidney cancer in 2010.
Most cases will be clear cell renal cell carcinoma (ccRCC) and have little information as
to how their disease will progress. This diversity of disease natural history is especially
noteworthy in a disease so well characterized by the inactivation of the von Hippel
Lindau (VHL) tumor suppressor and resulting stabilization of Hypoxia Inducible Factors
(HIF). Previous studies had suggested the presence of two or more clusters in ccRCC.
Based on the nonuniformity within the disease’s natural progression and previous
research, we hypothesized that distinct inherent molecular subclasses of ccRCC must
exist and, therefore, sought to define and characterize them. In fact, two robust
subtypes of ccRCC were identified, designated ccA and ccB. These subtypes are
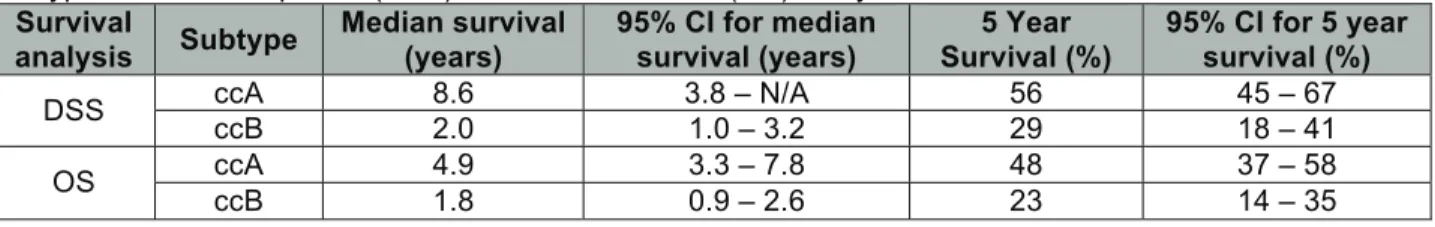
associated with survival by multivariate analysis, conferring a median survival of 8.6
years versus 2 years, respectively.
We postulated that the underlying molecular pathways within the data would
explain the survival difference. ccA tumors overexpress angiogenesis, hypoxia, and
metabolism pathways, common pathways characterizing ccRCC tumors. In contrast,
ccB tumors overexpress more aggressive genes related to epithelial to mesenchymal
transition, cell cycle, and Wnt targets. VHL analysis and HIF immunohistochemistry
To understand what is causing the differences, underlying genetic changes were
analyzed. Both subtypes show deletion of chromosome 3p, location of VHL, in greater
than 75% of tumors, corresponding with previous research and suggesting a common
initiating tumorigenic event. Overall, copy number patterns look very similar between the
subtypes; however, more ccB tumors show deletion of chromosomes 9 and 14, which
previous studies have shown to correlate with decreased survival. Additionally, ccA
tumors have mutations in a number of histone modification genes, suggesting that
epigenetic modification may play a role in subtype differences.
Finally, a biomarker panel of 120 probes was defined to distinguish ccA and ccB
tumors. This panel is the basis of an assay using FFPE tissue for clinical use. This
assay will classify tumors into the inherent subtypes identified by this study, with
Acknowledgements
Thank you to the very many people that helped me to complete this dissertation
project. I couldn’t have done it without you.
Special notes of thanks go out to:
My advisor – Dr. W. Kimryn Rathmell, who encouraged, pushed, and shook her
head, at me over the years. She also tried to teach me tact, which only partially took.
Plus, she brought us cake.
My committee – Drs. Adrienne Cox, William Kim, Charles Perou, and Kristy
Richards, who have given me guidance and hard questions over the years.
My coworkers, past and present - Alex Arreola, Dr. Shufen Chen, Dr. Lance
Cowey, Michelle DeSimone, Kate Hacker, Leslie Kennedy, Dr. Caroline Martz Lee,
Courtney McGuire, Neal Rasmussen, Dr. Christie Sanford, and Dr. Tricia Wright. These
people provided scientific commentary and, more importantly, laughter over the years.
Collaborators, especially those at Rutgers - Dr. Gyan Bhanot, Dr. Anupama
Reddy, Michael Seiler, and Erhan Bilal. Without these people, this dissertation would
have taken far longer. Anupama, in particular, was a great pleasure to work with and
helped me better understand how to use a variety of different computer programs.
People at UNC who directly helped me in my projects – Dr. Yan Shi in the
Genomics and Bioinformatics core, Dr. Dominic Moore in Biostatistics, Dr. Mei Huang in
the Tissue Procurement Facility, Dr. Katie Hoadley for teaching me microarray basics,
Grace Silva for helping with copy number analysis, Jeremy Simon for helping with
Department, faculty and staff – IBMS was my first home here on campus.
Thanks to Dr. Sharon Milgram for bringing me in and continuing to guide me since then.
GMB then became my official curriculum. While TIBBS is not a department, they met a
lot of my needs. Dr. Pat Phelps guided me to grow professionally and personally, and
she made me laugh on countless occasions. Drs. Christy Ahn and Patrick Brandt were
also helpful in a variety of situations. The Diversity Education Team, especially Drs.
Cookie Newsom, Donna Bickford and Terri Phoenix, provided an outlet for my desire to
grow in understanding diversity and sharing that with the campus. Finally, universities
cannot run without administrative assistants. Special thanks to Kathy Allen, Becky
Muller, Sausyty Hermreck, Pat White, and Dean Staley.
Friends and mentors at the NIH and in Bethesda – Thank you to Dr. Alison
McBride for taking me into her lab while I was still extremely green and continuing to be
supportive as I progress further up the ladder. Thank you also to Kerri Penrose, who
taught me some tricks to finding balance and helped me remember that laughter is very
important in science – important tips that have continued to serve me.
Friends – I don’t even know who to begin with, especially as many have already
been listed above. Dr. Tamara Moyo, who I knew before I even came here and was my
first graduate mentor, also helped me through a lot of sticky situations and is an amazing
cook. My IBMS class, especially Pamela Hesker, who made graduate school a
supported place. My friends at home, many of whom didn’t understand, but were
supportive anyway. Rachel Faber Machacha, who could not provide indoor picnics or
cheese trays, but did fly down more than once when I needed her support. My church
families, both at Newman and Jubilee, and my Bible study group who provided support
in my faith and cheering in my studies.
Family – I would not be here (on this planet or at UNC) without my parents, Phil
and Rose Brannon. Thank you for your support over all of these years. Honey and
Dziadzia, my mom’s parents, also deserve credit for helping to raise me and instilling a
determination to succeed. My aunt, Terry Zajda, and my cousin, Barry Wolcyk, round
out my immediate family and took me out to shoot clay pigeons when I was home to
blow off some of that excess stress that comes from research.
While I am sure that I am forgetting to list someone here, please know that you
helped me through my time here at UNC, and I greatly appreciate it.
Table of Contents
List of Tables ... xiv
List of Figures ... xv
List of Abbreviations ...xviii
Chapter One : Introduction ...1
Renal Cell Carcinoma...2
Biomarkers ...5
Prognostic Nomograms ...6
The pVHL/HIF axis ...7
Other means of regulating HIF ...11
Cytogenetic Studies...13
Gene Expression Studies ...16
Comparisons to normal tissue ...19
Comparisons to other histologies ...19
Analyses focused on clinical outcomes ...20
Biologically driven analyses...21
Other Technologies ...23
Updating Nomograms...25
Summary ...27
How this body of work builds on previous findings ...28
Abstract ...31
Introduction...32
Results...34
Identification of ccRCC subtypes...34
Delineation of a gene set to stratify ccRCC into ccA and ccB. ...37
Validation of ccRCC subtypes. ...40
Assignment of individual tumors. ...41
ccA and ccB have different survival outcomes. ...41
ccA/ccB subtype associates with clinical variables...43
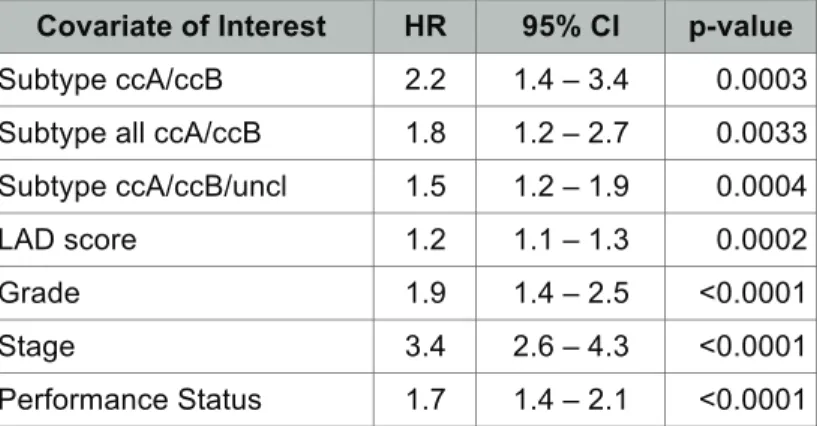
Molecular classification is independently associated with survival. ...43
Discussion ...45
Materials and Methods ...47
Samples...47
Gene Expression Analysis...48
Data Normalization ...49
Principal Component Analysis (PCA) ...50
Unsupervised Consensus Ensemble Clustering...51
Logical Analysis of Data (LAD) ...53
Leave-One-Out Analysis (LOO)...54
Semi-quantitative Reverse Transcription PCR ...55
Statistical Methods...55
Chapter Three : Molecular pathways of ccRCC subtypes identify an
angiogenic/hypoxic vs. a proliferative/aggressive stratification ...58
Abstract ...59
Introduction...60
Analysis of pathway differences between two core clusters...63
Confirmation of pathway analysis results on a validation set. ...65
Characterization of subtypes compared to normal tissue...65
VHL pathway analysis. ...67
HIF1 protein is overexpressed in both subtypes...68
Discussion ...70
Methods...74
Gene expression data...74
Pathway Analysis...74
VHL Sequence and Methylation Analysis...74
Immunohistochemistry...74
Chapter Four : Characterization of clear cell renal cell carcinoma
subtypes reveals underlying genetic differences...76
Abstract ...77
Introduction...78
Results...81
Analysis of chromosomal changes based on expression. ...81
Computational karyotyping of training set data...82
Assigning subtypes in a validation dataset. ...84
Computational karyotyping of Futreal data. ...85
Deciphering chromosomal changes with SNP data...87
Mutation analysis suggests epigenetic differences between subtypes. ...88
Discussion ...90
Materials and Methods ...94
Gene Expression Data...94
Pathway and Positional Analysis ...95
Distance Weighted Discrimination (DWD) of Futreal and UNC Data. ...95
SNP analysis ...96
Chapter Five : Development of an FFPE-based biomarker to classify
clear cell renal cell carcinoma ...98
Abstract ...99
Introduction...101
Results...105
Confirmation of extraction technique. ...105
Identification of housekeepers. ...106
Finalization of NanoString gene list. ...107
Quality control for the custom CodeSet. ...109
Discussion ...111
Materials and Methods ...115
FFPE lysate extraction...115
NanoString hybridization and data collection...115
NanoString data analysis...115
Housekeeping gene calculations ...116
Semi-quantitative real time PCR...117
Chapter Six : Conclusions and Discussions...118
Overall summary ...119
Comparison to previous work ...121
HIF expression versus ccA/ccB?...126
Third HIF’s the charm? ...128
The Ror2 of the wild ccB ...130
Only on the surface ...133
The problem in the pathways ...134
That’s a nice assay...136
Progressive, bifocal, or an entire second set...136
Two for one deal...137
In conclusion…. ...138
List of Tables
Table 1.1 Gene expression studies in RCC ...17
Table 1.2 Clinical features from RCC nomograms predictive for recurrence
or survival ...26
Table 2.1 LAD Probe Set. ...38
Table 2.2 Survival Times with 95% Confidence Intervals. ...42
Table 2.3 Univariable Cox regression analysis for Disease Specific Survival...44
Table 2.4 Tumor characteristics for 51 clear cell samples. ...47
Table 3.1 Classification of HIF annotated Gordan et al.
39tumors ...68
Table 3.2 Similar percents of HIF1/HIF2 tumors were found in each subtype. ...69
Table 4.1 Regional expression changes of training set data by
computational karyotyping and SAM-GSA ...84
Table 4.2 Mutated genes in each subtype ...89
List of Figures
Figure 1.1 Worldwide incidence of kidney cancer in 2008. ... 2
Figure 1.2 VHL/HIF Pathway... 9
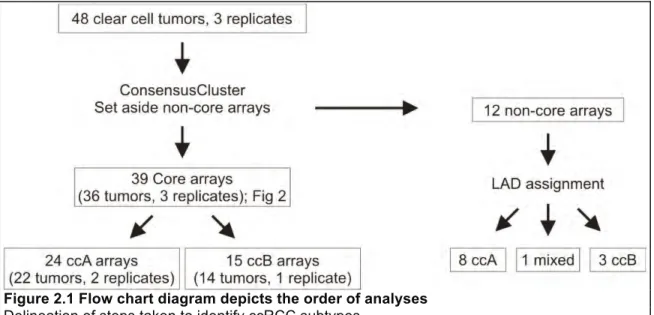
Figure 2.1 Flow chart diagram depicts the order of analyses... 34
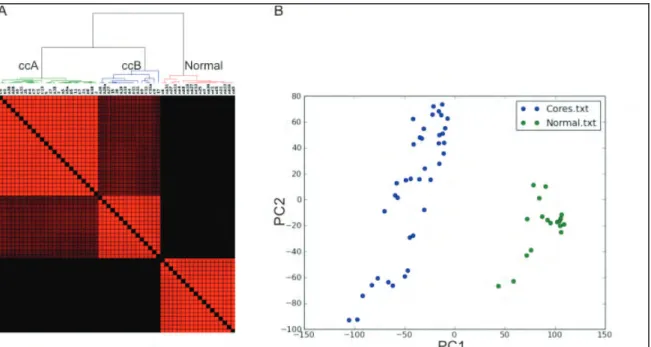
Figure 2.2 Consensus matrixes demonstrate the presence of only two core
clusters of intermediate grade ccRCC... 36
Figure 2.3 Two ccRCC subtypes are distinct from normal kidney tissue. ... 37
Figure 2.4 LAD probes separate ccA and ccB tumor clusters... 39
Figure 2.5 Validation of LAD probes in validation dataset show the existence of
two ccRCC clusters. ... 40
Figure 2.6 Classification of tumors from validation dataset by LAD prediction
shows that subtypes have differing survival outcome. ... 42
Figure 3.1 Pathway analysis of subtypes shows that ccA and ccB differentially
express many genes ... 64
Figure 3.2 Pathway analysis of validation data subtypes mimics training data... 65
Figure 3.3 Pathway expression in subtypes compared to normal shows
similarities and vast differences. ... 66
Figure 3.4 Representative HIF staining... 69
Figure 4.1 Chromosomal regions of differential gene expression. ... 81
Figure 4.2 Chromosome 3 underexpression of UNC data shows significant
difference between ccA and ccB tumors. ... 83
Figure 4.3 Consensus matrix and PCA plot demonstrate distinct clusters in
Futreal data. ... 85
Figure 4.4 Computational karyotyping of Futreal expression data ... 86
Figure 4.5 Copy number analysis identies regions of dissimilarity between
Figure 5.2 cT values of putative housekeeper genes...107
Figure 5.3 Linear regression plots of NanoString data... 110
Figure 6.1 ccB tumors cluster with papillary tumors...122
Figure 6.2 Effect of DWD adjustment on Zhao et al.
92data ... 124
List of Abbreviations
4EBP
Eukaryotic translation initiation factor 4E-binding protein
AMPK
5' adenosine monophosphate-activated protein kinase
AJCC
American Joint Committee on Cancer
AKT
v-akt murine thymoma viral oncogene homolog 1
Ang2
Angiopoietin
2
ARNT
Aryl hydrocarbon receptor nuclear translocator or HIF-1β
BHD
Birt-Hogg-Dube
BNIP3
BCL2/adenovirus E1B 19 kDa protein-interacting protein 3
CAIX
Carbonic Anhydrase IX
cAMP
cyclic Adenosine Monophosphate
CBP/p300
Creb-binding protein/ E1A binding protein p300
ccA
clear cell Renal Cell Carcinoma, subtype A
ccB
clear cell Renal Cell Carcinoma, subtype B
CCND1 cyclin
D1
CGH
comparative genomic hybridization
ccRCC
clear cell Renal Cell Carcinoma
CREB
cAMP response element binding
cT
Cycle Threshold
CXCR4
Chemokine (C-X-C motif) receptor 4
Cyclin D1
cyclin family member D1
DAPI
4',6-diamidino-2-phenylindole
ECM
Extracellular matrix
EDNRB
Endothelin receptor type B
EGFR
Epithelial growth factor receptor
Egln3
Prolyl hydroxylase family member - egl nine homolog 3
EMT
Epithelial-to-Mesenchymal
Transition
EPAS1
Endothelial PAS domain protein 1 or HIF-2
α
ERBB2
erythroblastic leukemia viral oncogene homolog 2
FDR
False discovery rate
FDG-PET
fluorodeoxyglucose positron emission tomography
FLT1
fms-related tyrosine kinase 1
FFPE
formaldehyde-fixed, paraffin-embedded
Glut1
Glucose transporter 1
H&E
Hematoxylin and eosin
H1H2
expressing HIF1
α
and HIF2
α
H2
expressing
HIF2
α
only
HIF
Hypoxia Inducible Factor
HIF-1
α
Hypoxia inducible factor 1 alpha
HIF-1
β
Hypoxia inducible factor 2 beta or ARNT
HIF-2
α
Hypoxia inducible factor 2 alpha or EPAS1
HR
Hazards
ratio
LKB1
serine/threonine kinase 11
LOO
Leave One Out
Lox
Lysl
oxidase
MES
2-(N-morpholino)ethanesulfonic
acid
MET
MNNG (N-Methyl-N'-nitro-N-nitroso-guanidine) HOS Tranforming gene
MMP2
Matrix metalloproteinase 2
MSKCC
Memorial Sloan-Kettering Cancer Center
mTOR
Mammalian target of rapamycin
Myc
v-myc myelocytomatosis viral oncogene homolog (avian)
Oct-4
Octamer-4 or POU5F1 (POU class 5 homeobox 1)
PAI-1
Plasminogen activator inhibitor
PCA
Principle Component Analysis
PDGF
Platelet-derived growth factor
PDGFR
Platelet-derived growth factor receptor
PDK
Pyruvate dehydrogenase kinase
PHD
Prolyl hydroxylase
PI3K
Phosphatidylinositol
3-kinases
PIP2
Phosphatidylinositol
(3,4)-bisphosphate
(PI(3,4)P2)
PIP3
Phosphatidylinositol
(3,4,5)-trisphosphate
(PI(3,4,5)P3
PTEN
Phosphatase and tensin homolog
pVHL
von Hippel-Lindau tumor suppressor protein
qPCR
quantitative real time polymerase chain reaction
qRT-PCR
Quantitative reverse transcription polymerase chain reaction
Rbx1
Ring box protein 1
RCC
renal cell carcinoma
REDD
DNA-damage-inducible transcript 4
Rheb
Ras homolog enriched in brain
RT-PCR
Reverse transcription polymerase chain reaction
SAM
Significance Analysis of Microarrays
SAM-GSA
SAM gene set analysis
SNP
single nucleotide polymorphism
SSIGN Stage, Size, Grade, and Necrosis
TAD
Transcriptional activation domain
TCE
Trichloroethylene
TGF
Transforming Growth Factor
Tie2
TEK tyrosine kinase, endothelial
TMA
tissue
microarrays
TNM
tumor node metastasis
TSC
Tuberous sclerosis complex family members
Twist1
Twist homolog 1
UISS
UCLA
integrated scoring system
VEGF
Vascular endothelial growth factor
VEGFR
Vascular endothelial growth factor receptor
VCAM1
vascular cell adhesion molecule-1
VHL
von Hippel-Lindau tumor suppressor
Chapter One:
Introduction
Renal Cell Carcinoma
One in 67 people will develop kidney cancer during their lifetime
3, being the
seventh leading cause of cancer in men and eighth in women in the United States
4. In
the United States alone, 2009 is estimated to bring about 57,760 new cases of kidney
cancer, and this disease will cause the death of approximately 12,980 people. In the
US, the average age for diagnosis is 64 and for death is 71. Men will bear this burden
roughly 2 times more than women, for reasons that remain unclear. In 2008, worldwide
incidence was estimated at 271,348 new cases (Figure 1.1) and 116,309 deaths
2.
Incidence rates are higher in industrialized countries, possibly due to increased life
spans, better access to diagnostic equipment, and increased obesity (see risk factors
below). Additionally, incidence has increased 2.9% per year from 1997-2007
3.
Figure 1.1 Worldwide incidence of kidney cancer in 2008.
Fortunately, US mortality from kidney cancer has decreased 0.5% annually over
that same time period
3. This decrease is predominantly caused by cancers being
detected at an earlier stage due to increased imaging capabilities.
Certain risk factors are associated with a predisposition to kidney cancer. The
strongest risk factor is a family history of von Hippel Lindau (VHL) disease. Additionally,
other kidney syndromes, such as cystic disease or chronic end stage renal disease
increases risk. As with the majority of other cancers, cigarette smoking is a major risk
factor for the development of kidney cancer, doubling the lifetime risk for heavy smokers.
As is emerging for many cancers, obesity is also associated with increased incidence of
kidney cancer, but decreased mortality from localized disease
5. Being of African
American descent increases risk by 2% compared to caucausians and Native
Americans, while those of Hispanic origin are 2% less likely. Asian or Pacific Islander
confers almost half the average risk
3. Finally, certain occupational exposures,
particularly to the organic solvent trichloroethylene (TCE), which is widely used in carpet
cleaning, paint removing, and metal degreasing, can augment the probability of
developing kidney cancer. Interestingly, TCE was originally used to extract vegetable oil
in the 1920s, and from the 1930s-1970s, TCE was used as a general anesthetic in much
of North America and Europe. In spite of these and other known risk factors most
tumors arise in scenarios where an inciting factor cannot be identified.
chemotherapy is only implemented for palliation. Molecularly targeted therapies have
become the common form of treatment, but while they increase progression free
survival, they have not been shown conclusively to increase overall survival of patients.
Kidney cancer can be subdivided based on histological examination to grant
some further information about diagnosis, progression and response. Renal cell
carcinomas (RCCs) make up approximately 90% of all kidney cancers
6, but in itself
encompasses a heterogeneous group of cancers. Clear cell RCC (ccRCC) is the largest
histological subcategory, including 60% to 80% of cases, and will be the focus of this
dissertation. Papillary and chromophobe histologies cover the majority of the other
common subtypes. These stratifications represent highly dissimilar diseases and not
strictly variants of RCC. Recently, an increased appreciation of the distinct biology of
these subtypes has led to considerations of histology when managing these patients;
however, even this major subdivision provides little immediate guidance regarding
disease prognosis and management. Given this uncertainty, there is great need for both
prognostic and predictive biomarkers.
Tremendous efforts have been expended in the search for reliable indicators of
the underlying biology of renal carcinomas. With advancing technological opportunities
to probe the genetic and molecular underpinnings of this cancer, many critical
In the setting of these advancements, modern treatment decisions and the future
of RCC drug development will benefit greatly from increased understanding of the
underlying tumor biology. Tremendous gains in the treatment of this cancer remain to be
made. The state-of-the-art science of RCC is a continuously evolving topic, but one that
promises to provide us with valuable tools for defining the unique biology of an
individual’s tumor to inform predictions about recurrence or response to therapy for
patient-driven clinical decisions, and to aid in the discovery of new strategies to
effectively target this cancer.
Biomarkers
Before going further, it is important to first define biomarker terminology and the
main categories of biomarkers that will be discussed herein. In general, a biomarker is a
measurable characteristic that can be used to indicate certain physiological processes or
responses.
1. Diagnostic biomarkers are used to determine whether a patient might have
the disease in question. For example, a high prostate-specific antigen (PSA)
measure is an indicator that a man might have prostate cancer.
3. Predictive biomarkers assist in foretelling whether a tumor will respond to a
particular treatment. For example, when a breast tumor overexpresses
ERBB2, it is more likely to respond well to treatment with Herceptin.
4. There are additional biomarkers that we are unlikely to discuss fully. Risk
assessment biomarkers are measures of the likelihood that a person will
develop a particular disease and are generally broken down into the
categories of exposure, susceptibility, and effect. Pharmacodynamic
biomarkers assess the effectiveness that a drug is metabolized or hits its
target to help clinicians determine which dose will be most effective for a
patient, as well as what dosage might prove toxic. Pharmacogenomic
biomarkers are very similar, except the biomarker tends to be expression of a
gene or a particular single nucleotide polymorphism.
Prognostic Nomograms
In the absence of available molecular biomarkers, clinical measures have fulfilled
the need to provide prognostic information. In fact, there are a number of prognostic
scoring systems to assign risk for death to ccRCC patients already in common use
based on clinical variables. An understanding of these patient stratification schemes is
necessary as the field moves toward the routine incorporation of molecular biomarkers
into strategies for patient stratification. For initial prognostication of risk for recurrence or
death following a definitive surgical procedure, the American Joint Committee on Cancer
Tumor Node Metastasis (TNM)
7, the UCLA Integrated Scoring System (UISS)
8, and the
Memorial Sloan-Kettering Cancer Center (MSKCC)
9nomograms all use clinical
Size, Grade, and Necrosis (SSIGN) algorithm further includes tumor necrosis
10, and
another nomogram from MSKCC uses all of the above and vascular invasion
11. Thus,
eventual transitions to inclusion of molecular information to the clinical scenario will be
relatively straightforward once the most relevant molecular biomarkers emerge.
For prognosticating survival in the metastatic setting, a metastatic disease
MSKCC score is one of the most commonly used algorithms, incorporating blood
measurements of hemoglobin, serum calcium, and lactate dehydrogenase, as well as
clinical evaluation of performance status and nephrectomy status
12. A similar nomogram
was identified by the Cleveland Clinic Foundation based on an independent multivariate
analysis
13. The Mayo Clinic devised a nomogram for metastatic clear cell tumors only
that scored patients based on symptoms at nephrectomy, bone/liver metastases,
multiple metastases, resection of all metastases, time to progression, tumor thrombus,
primary tumor grade, and coagulative tumor necrosis
14. A recent outstanding review by
Isbarn and Karakiewicz
15provides a complete overview of these nomograms, which are
widely used by clinicians to provide a crude assessment of the expected survival of an
individual patient.
The pVHL/HIF axis
The biology of the von Hippel-Lindau (VHL) gene product, pVHL, and its
regulation of the hypoxia-inducible factor (HIF) family of dynamically regulated
transcription factors, is indelibly linked to ccRCC biology. The discovery of the VHL
gene, and its association with the VHL syndrome of central nervous system
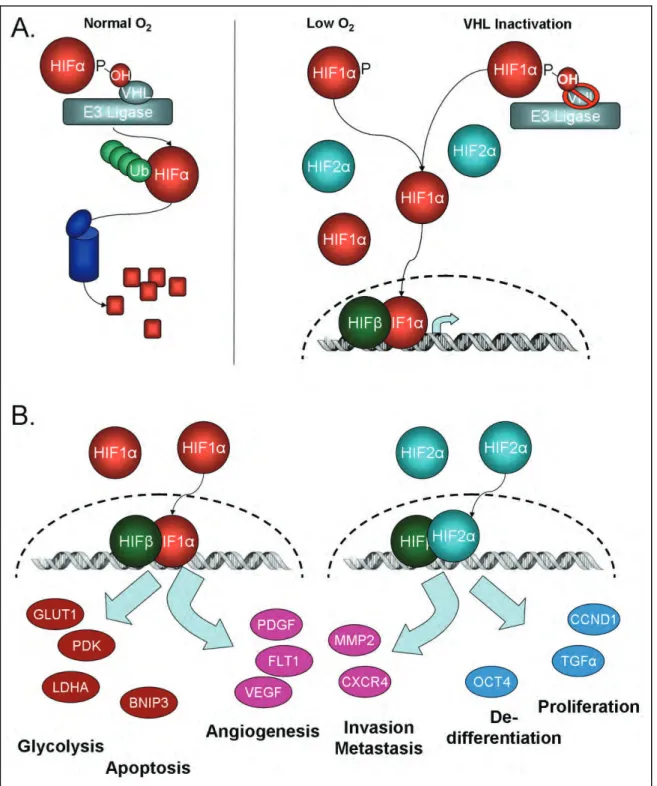
The VHL protein (pVHL) is part of an E3 ubiquitin complex, which also contains
Elongin B, Elongin C, Cullin 2, and Rbx1
19. Under physiologic conditions, pVHL recruits
the hypoxia inducible factors (HIF-1α, HIF-2α, and HIF-3α variants 1-3) to the E3
ubiquitin ligase complex leading to proteasomal degradation
20-22(Figure 1.2A). This
recruitment requires the HIF-α subunits to be hydroxylated by prolyl hydroxylases (PHDs
or EGLNs) on specific prolyl residues (Pro402 or Pro564) located within HIF-α’s oxygen
dependent domain
23-25. In addition to oxygen, the PHDs need iron, 2-oxoglutarate, and
ascorbic acid to catalyze the reaction. However, in hypoxic conditions (less than 3%
oxygen) or when VHL is mutated, the PHDs are unable to hydroxylate HIF thereby
inhibiting pVHL interaction. Xenograft studies have confirmed that restoration of pVHL
expression or suppression of deregulated HIF impairs the growth of VHL deficient renal
cell carcinoma models, verifying that VHL loss mediates renal cell carcinoma
development via HIF deregulation
26,27.
Figure 1.2 VHL/HIF Pathway
When VHL is inactivated and HIF expression thereby stabilized, 1α and
HIF-2α are then available to bind HIF-1
β
/ARNT (aryl hydrocarbon receptor nuclear
translocator) and transcriptionally activate a variety of genes (Figure 1.2B) by binding to
hypoxic response elements located within the gene’s promoter or enhancer
29. Maximal
activation is achieved by the additional binding of CREB (cAMP response element
binding) protein (CBP) and p300
30. HIF-3α splice variants 1-3 may also transcriptionally
activate specific genes, but their targets have yet to be determined. A different splice
variant, HIF-3α4, acts to dominantly negatively regulate HIF by interacting with HIF-1α,
HIF-2
α
, and HIF-1
β
, and has been found to be downregulated in ccRCC
31,32.
Which of these transcriptionally activated factors or combination of factors
participates in forming and maintaining the malignant phenotype of these tumors
remains an open question. Certainly many hypoxia-responsive genes are outstanding
candidates. One HIF target, the vascular endothelial growth factor (VEGF), has been
found to be vastly upregulated in kidney tumors compared to its elevated expression in
many other cancers
33,34. This growth factor contributes to the highly vascular nature of
this tumor, acting as a mitogen for tumor endothelial cells. Multiple therapeutic strategies
have been developed to target VEGF, neutralizing its activity as a soluble growth factor
or inhibiting the activated VEGF receptor tyrosine kinase. Remarkably, these strategies
have consistently demonstrated an effect of inhibiting tumor progression and have
produced therapeutic responses
35. These breakthroughs demonstrate how much
ccRCC remains dependent on key elements of HIF pathway activation, and that even if
we can only target a fraction of the perturbed system, there can be tremendous clinical
benefits.
genes, such as CXCR4, MMP2, Lox, and PAI-1. HIF-1 alone controls glycolytic genes
such as Glut1, PGK, and LDHA, and the apoptosis gene BNIP3. In contrast, HIF-2
preferentially regulates proliferation genes, such as cyclin D1 and transforming growth
factor α (TGFα), and the de-differentiation gene Oct4 (reviewed in
36).
We have also learned that in spite of the tremendous correlation of ccRCC with
loss or inactivation of VHL, the effect on HIF deregulation is not uniform. Variant
mutations in VHL may contribute to imbalances of HIF1α and HIF2α deregulation
leading to distinct effects on cell growth
37,38. Renal tumors can in fact be characterized
as H1H2 (expressing HIF1α and HIF2α) or H2 (expressing only HIF2α), with dramatically
differing effects on tumor cell metabolism and C-myc regulation
39. Recent evidence
suggests that the H2 tumors may lose HIF1α expression as a result of nonsense or
missense mutations in a subset of tumors
40, suggesting a potential selective pressure to
lose the HIF1α gene during tumor progression. These insights to potentially narrow the
key tumorigenic events within the VHL/HIF axis will undoubtedly lead to novel strategies
for prognostic and therapeutic maneuvers.
Other means of regulating HIF
Interestingly, HIF can be regulated independently of pVHL
41: In chromophobe
RCC, patients with mutations in the Birt-Hogg-Dube gene overexpressed HIF. Germline
MET mutations in type 1 papillary patients also overexpressed HIF proteins. Type 2
patients carry a mutation in fumarate hydratase, whereupon fumarate accumulates and
binds PHDs, preventing the binding of 2-oxo-glutarate
42. This again allows HIF to be
upregulated. Accumulation of succinate due to inactivation of succinate dehydrogenase
similarly prevents PHD from being able to attach a hydroxyl group to the HIF prolyl
sites
43. Additionally, HIF-1
Therefore, as Rathmell et al.
41point out, even though HIF overexpression had been
considered the distinguishing factor for clear cell, HIF upregulation may be a key factor
in all RCC subtypes. Variance of HIF target profiles may then be important, as might
previously unstudied genes and pathways, even within the bounds of clear cell RCC.
HIF levels can also increase due to increased translation caused by alterations of
the mTOR (mammalian target of rapamycin) pathway. As reviewed by Dowling et al.
45,
one of the ways this pathway can be activated is by the binding of insulin or a growth
factor to its receptor, e.g. PDGF to PDGFR. The p85 subunit of PI3K
(phosphatidylinositol-3-kinase) is phosphorylated by the kinase and inhibition of the p110
subunit is released. PI3K phosphorylates PIP2 to PIP3, which recruits Akt and PDK1 to
the cell membrane. PDK1 then phosphorylates and activates Akt, which can then directly
activate mTORC1 (mTOR with Raptor). Akt also inhibits the tuberous sclerosis complex
(TSC), made up of TSC1 and TSC2, that normally inhibits mTOR’s activating protein
Rheb. The activated mTOR phosphorylates p70 S6 kinase (p70 S6K) and eIF4E binding
proteins 1, 2 and 3 (4EBP). p70 S6K phosphorylates the ribosomal S6 kinase, which
increases translation of mRNAs with terminal oligopyrimidine tracts, sequences that are
contained within HIF1 and HIF2. The phosphorylated 4EBP releases initiation factor
eIF4E, increasing translation of CAP-dependent mRNAs, including cyclins and c-Myc.
Cytogenetic Studies
Beyond VHL loss and HIF activation lies the great morass of genetic events that
supplement these common molecular features to give the “teeth” to RCC. Major efforts
have yet to identify a simple linear progression of genetic lesions accounting for the
gains in aggressiveness in RCC. Rather, it appears that many events, most surprisingly
dissimilar to other epithelial cancers, participate in this progression, discovered via both
new strategies to examine the cancer genome and conventional cytogenetic studies.
These studies have enhanced our understanding of the cancer genome in RCC.
Cytogenetic studies have been performed on kidney tumors since 1966
46. Thirty
years later, comparative genomic hybridization
47(CGH) and microsatellite analysis
48of
clear cell tumors showed that that the majority (56% and 98%, respectively) of tumors
had deletion within 3p, the chromosomal area where VHL sits. Additionally, both showed
amplification of chromosome 5q (17% and 70%), and CGH identified amplification of
chromosome 7. Microsatellite analysis identified other common regions of deletion as
6q, 8p, 9, and 14q, where the latter three correlated with advanced stage disease. CGH
identified 9p and 13q as the most common after 3p. The CGH study also showed that
increased number of chromosomal losses correlated with decreased survival, and that
loss of 9p was associated with tumor recurrence. Other studies confirmed many of
these regions
49-51and validated survival association for chromosome 9
7,52-56. Recent
single nucleotide polymorphism (SNP) arrays continue to identify these same regions as
important
57-59.
variability. Additionally, some metastases showed fewer genetic changes than the
primary tumors. The most common genetic changes in metastatic tumors that were not
present in the primary tumors were loss of 8p and 9p, and gain of 17q, 21q, and Xq.
Metastases also often lacked deletion of 3p, despite the presence of the deletion in the
primary tumor, a result also seen in a previous study
61.
In 2000, a group used CGH data from 116 tumors to attempt to create a disease
progression model for ccRCC
62. They put forth several branching tree models,
suggesting that there are at least 2 subgroups of ccRCC. Three other groups suggested
likewise: Furge et al. used gene expression data to predict cytogenetic profiles and
observed two clusters in the data, associated with survival and predominantly tied to loss
of 14q
6. Arai et al. used CGH and identified two clusters, where one group had more
common deletions in 1p, 4, 9, 13q, and 14q and decreased DNA methylation
63. Most
recently, Zhang et al. combined their data with 5 other groups and saw at least 2
subtypes
64. Additionally, they created their own model for the formation and progression
of ccRCC tumors.
able to be targeted with the same treatments, and that VHL disease models may
faithfully mimic the more common sporadic disease.
The other study was a prospective study of 282 ccRCC patients with up to 108
months of follow-up using traditional cytogenetic karyotyping techniques
66. They
determined that loss of 3p was significantly associated with increased disease-specific
survival, while loss of 4p, 9p, and 14q were significantly associated with decreased
disease-specific survival. Only loss of 9p remained significant in multivariable analysis in
the presence of standard clinical measures, and was further validated in an expanded
study
67. The specific genes in these regions implicated in causing the poor prognosis
remain to be characterized.
In determining these individual genes associated with RCC, we turn to
sequencing studies. Although whole-scale sequencing has not yet been performed on
large numbers of renal carcinomas, this tumor type is being examined as a priority tumor
in the cancer genome atlas and by other international efforts. Large-scale sequencing of
cancer genomes is becoming more common as technology becomes better and the cost
decreases. In ccRCC, the Futreal group has resequenced 3544 genes in 96
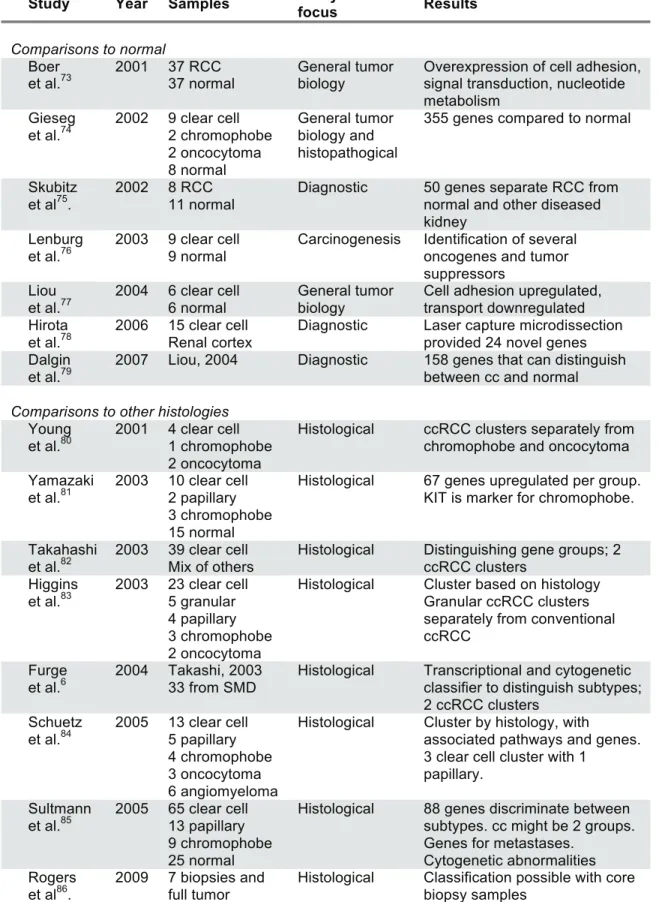
Gene Expression Studies
Table 1.1 Gene expression studies in RCC
Study Year Samples Analytical
focus Results
Comparisons to normal Boer
et al.73
2001 37 RCC 37 normal
General tumor biology
Overexpression of cell adhesion, signal transduction, nucleotide metabolism
Gieseg et al.74
2002 9 clear cell 2 chromophobe 2 oncocytoma 8 normal General tumor biology and histopathogical
355 genes compared to normal
Skubitz et al75.
2002 8 RCC 11 normal
Diagnostic 50 genes separate RCC from normal and other diseased kidney
Lenburg et al.76
2003 9 clear cell 9 normal
Carcinogenesis Identification of several oncogenes and tumor suppressors
Liou et al.77
2004 6 clear cell 6 normal
General tumor biology
Cell adhesion upregulated, transport downregulated Hirota
et al.78
2006 15 clear cell Renal cortex
Diagnostic Laser capture microdissection provided 24 novel genes Dalgin
et al.79
2007 Liou, 2004 Diagnostic 158 genes that can distinguish between cc and normal
Comparisons to other histologies Young
et al.80
2001 4 clear cell 1 chromophobe 2 oncocytoma
Histological ccRCC clusters separately from chromophobe and oncocytoma Yamazaki
et al.81
2003 10 clear cell 2 papillary 3 chromophobe 15 normal
Histological 67 genes upregulated per group. KIT is marker for chromophobe.
Takahashi et al.82
2003 39 clear cell Mix of others
Histological Distinguishing gene groups; 2 ccRCC clusters
Higgins et al.83
2003 23 clear cell 5 granular 4 papillary 3 chromophobe 2 oncocytoma
Histological Cluster based on histology Granular ccRCC clusters separately from conventional ccRCC
Furge et al.6
2004 Takashi, 2003 33 from SMD
Histological Transcriptional and cytogenetic classifier to distinguish subtypes; 2 ccRCC clusters
Schuetz et al.84
2005 13 clear cell 5 papillary 4 chromophobe 3 oncocytoma 6 angiomyeloma
Histological Cluster by histology, with
associated pathways and genes. 3 clear cell cluster with 1
papillary. Sultmann
et al.85
2005 65 clear cell 13 papillary 9 chromophobe 25 normal
Histological 88 genes discriminate between subtypes. cc might be 2 groups. Genes for metastases.
Cytogenetic abnormalities Rogers
et al86.
2009 7 biopsies and full tumor
Clinically driven analyses Takahashi
et al.87
2001 29 clear cell 29 normal
5 year survival 51 probes predict for survival with 96% accuracy
Vasselli et al.88
2003 51 clear cell 6 papillary 1 unknown
Survival 45 genes most associated with survival. VCAM-1 alone can stratify patients by survival. Jones
et al.89
2005 22 clear cell 10 metastases 37 other 24 normal
Progression and metastases
31 genes that are continuously deregulated in disease
progression. 155 genes that predicted metastases with 88.9% accuracy
Kosari et al.90
2005 10 aggr. cc 9 nonaggr. cc 9 metastatic cc 12 normal
Tumor
aggressiveness
35 genes distinguish between non-aggressive and aggressive tumors. Survivin expression predicts survival by multivariate analysis in 183 patients
Yao et al.91
2005 28 clear cell 3 chromophobe 9 normal
Histological and survival
Genes upregulated in ccRCC vs. chromophobe/normal. ADFP correlates to survival
Zhao et al.92
2006 177 clear cell Survival 259 genes associated with survival by univariate and multivariate analysis Yao
et al.93
2008 25 clear cell (14 metastatic) 2 metastases
Metastatic vs non-metastatic
3 genes (VCAM-1, EDNRB, RGS5) that by qRT-PCR can predict survival
Wuttig et al.94
2009 20 metastases Early vs late metastasis
55 genes to predict DFI
35 genes predict few vs. many
Biology-driven analyses Vasselli
et al. 88
2003 51 clear cell 6 papillary 1 unknown
Unsupervised 2 clusters of metastatic tumors with survival difference
Skubitz et al.95
2006 16 clear cell 21 normal
Unsupervised 2 subtypes distinguishable by 546 genes, with possible pathway differences Zhao
et al.92
2006 177 clear cell Unsupervised 2 clusters composed of 5 subclusters with survival difference.
Gordan et al.39
2008 21 clear cell Wild-type VHL vs H1H2 vs H2 tumors
3 groups have distinct biological pathways. H2 tumors
overexpress c-Myc, leading to increased proliferation
Zhao et al.96
2009 177 clear cell Biology of survival gene set
Good prognosis tumors
resemble normal renal cortex or glomerulus. Poor prognosis tumors associated with wound healing and loss of
differentiation. Brannon,
et al.97
2010 48 clear cell 18 normal
Unsupervised consensus clustering
2 subtypes of clear cell with pathway and survival differences, differentiable by <120 probes
Comparisons to normal tissue
The earliest gene expression analysis focused primarily on identifying the
changes between RCC tumors and normal tissue in an effort to gain a better
understanding of RCC tumor biology and the process of RCC carcinogenesis
73,74,76,77. In
general, these groups identified genes involved with cell adhesion and signal
transduction, as well as previously identified tumor suppressors and oncogenes. A few
other groups worked to identify genes that are diagnostic in nature, to distinguish the
difference between clear cell and tumor
75,78,79. Given that few biopsies are done, how
distinct ccRCC is from normal, and that small growths are generally observed or ablated,
diagnostic gene sets for ccRCC currently have limited utility.
Comparisons to other histologies
The next group of studies focused on genes that distinguish between the
different renal cell carcinoma histologies
6,80-86. Once a tumor is removed, pathologists
have a relatively easy time differentiating ccRCC from other RCC subtypes, although
occasional diagnoses of “mixed histology” or “unclassified” are used. However, this may
be particularly useful for distinguishing a chromophobe tumor from an oncocytoma.
Additionally, a recent study showed that core biopsies and extracted tumors had the
same gene expression and that it is possible to classify a tumor based on a core biopsy
using molecular markers
86. As core or fine needle biopsies become more common,
molecular markers that can identify the correct histology may become more important.
papillary clustered with 3 of their clear cell tumors, suggesting a vastly different
expression pattern for those 3 ccRCC tumors.
Analyses focused on clinical outcomes
Supervised analyses are designed to reveal the differences among tumors based
on preselected criteria, often survival, easily deriving biomarkers for the clinical
characteristic of interest. In contrast, unsupervised analyses work with the data a priori
and, therefore, are more likely to determine the underlying biological differences. While
these biological differences may also correspond with survival or other clinical
characteristics, these correlations are tangential to the original analyses; thus, these two
types of analyses generate very different kinds of results.
One of the earliest studies examined 29 ccRCC tumors and identified 51 genes
that could classify tumors based on 5 year disease-specific survival
87. This study
verified the possibility that gene expression profiles could be used to predict outcome,
but remains to be examined in a validation study or to be defined by biological
parameters which may account for this difference in disease activity. Two years later,
another group examining 51 metastatic clear cell tumors identified 45 survival genes,
with vascular cell adhesion molecule-1, VCAM-1, being the most predictive
88. Since
then, two retrospective studies have shown that VCAM-1 has prognostic
significance
93,98. Intriguingly, high expression of this molecule predicted for better overall
survival for both clear cell and papillary histology, suggesting that VCAM-1 expression
may generally indicate tumor cells with lower metastatic potential. The further
implications for anti-angiogenic therapy are not yet known.
with RCC aggression and/or survival
89. A similar study concurrently identified a potential
gene panel for aggressive clinical behavior in ccRCC by analysis of gene expression
profiles of a set of non-aggressive (low Fuhrman grade), aggressive (mostly high
Fuhrman grade), metastatic, and normal kidney samples
90. One of these genes,
Survivin, was shown to independently predict clear cell progression and risk of death
99and, therefore, was incorporated into a new prognostic algorithm
100.
The largest study included 177 clear cell tumors and identified 340 transcripts
(including VCAM-1) that could be used to assign a risk score to a patient, which was
significant in multivariate analysis with stage, grade and performance status
92. When this
group later investigated the biology associated with their survival gene set, they found
that tumors from patients who survived longer more resembled normal renal cortex or
glomerular tissue, while poor survival patients had tumors that exhibited a
wound-healing signature
96. Further delineation and validation of pathways that contribute to
tumor progression and an enhanced appreciation of the originating cell of ccRCC would
be extremely useful for modeling RCC and identifying pre-cancerous changes earlier.
Biologically driven analyses
tumor behavior. Zhao, et al. examined their 177 tumors using 3,674 genes and saw 5
different subgroups within two larger groups of ccRCC, with significant survival
differences as well as predicted biological pathway distinctions
92. These studies helped
set the stage for further delineation of subgroups within ccRCC.
In a strategy to intersect the supervised analyses with biological rationale
directed toward the most studied and understood pathway in RCC, gene expression
profiles were linked with von-Hippel Lindau tumor suppressor protein (pVHL) mutation
analysis and expression characteristics of the of hypoxia inducible factors (HIF)
39. In this
study, 160 ccRCCs were classified as VHL mutant or wild type and according to HIF
protein expression. VHL mutant, HIF1 and HIF2 expressing tumors (H1H2)
overexpressed the Akt/mTOR pathway, while VHL mutant tumors expressing solely
HIF2 (H2 tumors) replicated more rapidly, marked by overexpression of Ki-67 and
activation of c-Myc signaling. While, survival data was not available for this study, other
groups have identified Ki-67 as a poor-risk marker
66,101-111. Further studies on the
efficacy of HIF1 profile as a prognostic marker are anticipated.
Finally, one study stands out as being predominantly geared toward identifying
the inherent subgroups and underlying biological differences of ccRCC. The Skubitz
group
95looked at 16 ccRCC tumors and saw that there seemed to be two types of clear
cell, one that more highly overexpressed metabolic genes and the other extracellular
matrix/cell adhesion genes.
Other Technologies
A number of other technologies have been utilized in attempting to find good
prognostic biomarkers for ccRCC. Among them, we will touch briefly on tissue
microarrays (TMA), plasma serum protein analysis, and microRNA profiling.
Tissue microarrays (TMA) allow for quantitative and relatively quick
immunohistochemical (IHC) analysis of tumor protein expression patterns. 800
organ-confined ccRCC tumors were recently examined for expression of 15 proteins with
regards to tumor stage, Fuhrman grade, and survival data
112. Surprisingly, while pVHL
and phospho-mTOR staining correlated inversely with tumor stage and grade, neither
protein correlated with survival. However, expression of p27, PAX2, periostin, p-S6, and
CAIX did correlate with 5 year survival. Within the intermediate stage tumors (pT2 and
pT3), they found that patients with p27 and CAIX positive tumors faired better. This
information could be very useful in making clinical decisions for patients in these difficult
to predict categories. Many other potential biomarkers have been identified through
other TMA studies, as reviewed in
113.
All of the potential biomarkers listed thus far require removal and processing of at
least part of the tumor. In contrast, the use of plasma serum proteins would simply
require a blood test. Plasma serum proteins have traditionally been studied to find
non-invasive diagnostic markers for the presence of ccRCC as compared to normal or
benign renal tissue. To date, no measurable proteins have been moved forward for
screening or diagnostic evaluation. However, work from Perez-Gracia, et al, identified
potential predictive biomarkers for response to sunitinib in metastatic RCC (mCC)
patients
114. Serum from patients with clinical response or progression was screened by
cytokine arrays to discover that TNF-alpha and MMP-9 levels remained low in
decreased overall survival. In another study, low levels of sVEGFR-3 and VEGF-C in the
serum corresponded with longer progression free survival (PFS) and objective response
rate in bevacizumab-refractory mRCC
115. A third study suggested that large changes in
serum VEGF, sVEGFR-2 and sVEGFR-3 levels corresponded with tumor response
116.
All of these potential predictive biomarkers require external validation in larger sample
sizes, but suggest that serum may prove to contain cogent markers of survival and
response.
MicroRNA, 21-23 nucleotide segments of single-stranded non-coding RNA, have
now been implicated in tumorigenesis of many cancers, even being identified as
potential prognostic biomarkers in several of these. The aberrant expression of these
non-coding RNAs can provide a powerful method of epigenetic tumor regulation, as an
individual microRNA can alter the expression of many target genes. In RCC, various
studies have identified various individual or panels of microRNAs that are differentially
expressed between normal renal tissue and tumor
117-120or between histologic
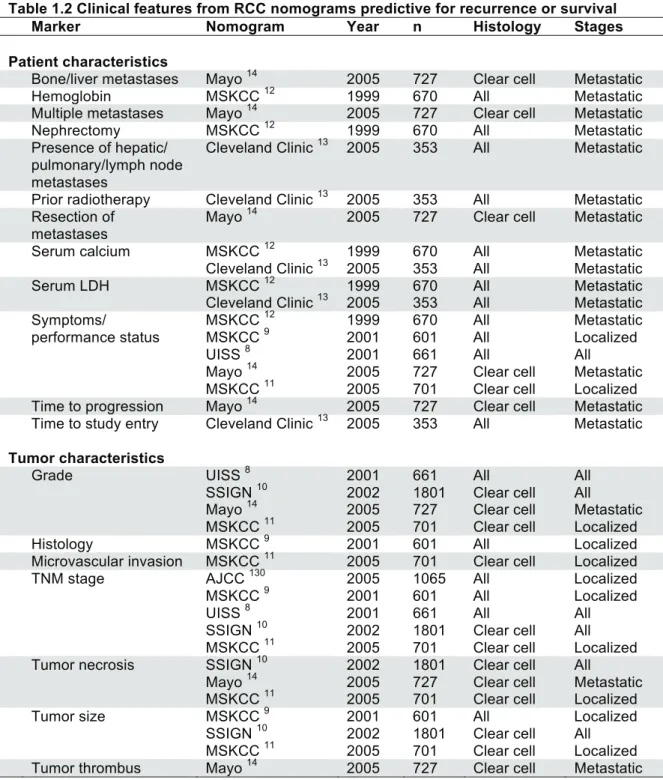
Updating Nomograms
Each of the means described earlier of calculating risk for recurrence or death of
disease were designed after 1999 and are well used by clinicians, yet have not included
any of the large number of possible biomarkers. In 2005, Kim,
et al
, devised a prognostic
model to assess patients metastatic disease that added CA9, vimentin, p53, and pTEN
IHC quantification to the common measure of tumor stage and patient performance
status
129. This model had a slightly higher concordance index than did the UISS scale
using clinically available parameters (0.68 vs 0.62). While not making a substantial
stride in influencing prognostic accuracy, this study opened the door to hybrid
nomograms which incorporate both clinical and genetic or molecular features.
Table
1.2
provides a list of clinical features incorporated into commonly used algorithms that
should be considered when designing hybrid nomograms.
appropriate to avoid undue testing expenses, and inappropriately applying molecular
information in scenarios where the additional data is uninformative.
Table 1.2 Clinical features from RCC nomograms predictive for recurrence or survival
Marker Nomogram Year n Histology Stages
Patient characteristics
Bone/liver metastases Mayo 14 2005 727 Clear cell Metastatic
Hemoglobin MSKCC 12 1999 670 All Metastatic
Multiple metastases Mayo 14 2005 727 Clear cell Metastatic
Nephrectomy MSKCC 12 1999 670 All Metastatic
Presence of hepatic/ pulmonary/lymph node metastases
Cleveland Clinic 13 2005 353 All Metastatic
Prior radiotherapy Cleveland Clinic 13 2005 353 All Metastatic Resection of
metastases
Mayo 14 2005 727 Clear cell Metastatic
Serum calcium MSKCC 12 1999 670 All Metastatic
Cleveland Clinic 13 2005 353 All Metastatic
Serum LDH MSKCC 12 1999 670 All Metastatic
Cleveland Clinic 13 2005 353 All Metastatic
Symptoms/ MSKCC 12 1999 670 All Metastatic
performance status MSKCC 9 2001 601 All Localized
UISS 8 2001 661 All All
Mayo 14 2005 727 Clear cell Metastatic
MSKCC 11 2005 701 Clear cell Localized
Time to progression Mayo 14 2005 727 Clear cell Metastatic Time to study entry Cleveland Clinic 13 2005 353 All Metastatic Tumor characteristics
Grade UISS 8 2001 661 All All
SSIGN 10 2002 1801 Clear cell All
Mayo 14 2005 727 Clear cell Metastatic MSKCC 11 2005 701 Clear cell Localized
Histology MSKCC 9 2001 601 All Localized
Microvascular invasion MSKCC 11 2005 701 Clear cell Localized
TNM stage AJCC 130 2005 1065 All Localized
MSKCC 9 2001 601 All Localized
UISS 8 2001 661 All All
SSIGN 10 2002 1801 Clear cell All
MSKCC 11 2005 701 Clear cell Localized
Tumor necrosis SSIGN 10 2002 1801 Clear cell All
Mayo 14 2005 727 Clear cell Metastatic MSKCC 11 2005 701 Clear cell Localized
Tumor size MSKCC 9 2001 601 All Localized
SSIGN 10 2002 1801 Clear cell All
MSKCC 11 2005 701 Clear cell Localized