UCSF
UC San Francisco Electronic Theses and Dissertations
TitleImplementing and Applying Multiplexed Single Cell RNA-sequencing to Reveal Context-specific Effects in Systemic Lupus Erythematosus
Permalink https://escholarship.org/uc/item/3mx1354t Author Subramaniam, Meena Publication Date 2019 Peer reviewed|Thesis/dissertation
by
Submitted in partial satisfaction of the requirements for degree of
in
in the
GRADUATE DIVISION of the
UNIVERSITY OF CALIFORNIA, SAN FRANCISCO
Approved: ______________________________________________________________________________ Chair ______________________________________________________________________________ ______________________________________________________________________________ ______________________________________________________________________________
Acknowledgements
The work described in this thesis would not have been possible without significant support from many individuals. I would like to thank my mentors Jimmie Ye and Noah Zaitlen for their constant mentorship and support, particularly in helping me identify and pursue the topics which interested me the most. I would like to thank the Biological and Medical Informatics Program at UCSF for administrative assistance, as well as the UCSF Discovery Fellows Program for their financial as well as mentorship support. Finally, I would also like to thank my thesis committee members Nir Yosef and Jonathan Weissman for their helpful feedback through this process.
The chapter entitled “Multiplexed droplet single-cell RNA-sequencing using natural genetic variation” was published in Nature Biotechnology (PMID: 29227470, doi: 10.1038/nbt.4042).
Implementing and Applying Multiplexed Single Cell RNA-sequencing to Reveal Context-specific Effects in Systemic Lupus Erythematosus
Meena Subramaniam
Abstract
Droplet single-cell RNA-sequencing (dscRNA-seq) has enabled rapid, massively parallel profiling of transcriptomes. However, assessing differential expression across multiple
individuals has been hampered by inefficient sample processing and technical batch effects. Here we describe a computational tool, demuxlet, that harnesses natural genetic variation to determine the sample identity of each cell and detect droplets containing two cells. These capabilities enable multiplexed dscRNA-seq experiments in which cells from unrelated individuals are pooled and captured at higher throughput than in standard workflows. Using simulated data, we show that 50 SNPs per cell are sufficient to assign 97% of singlets and identify 92% of doublets in pools of up to 64 individuals. Given genotyping data for each of 8 pooled samples, demuxlet correctly recovers the sample identity of >99% of singlets and identifies doublets at rates consistent with previous estimates. We also apply demuxlet to assess cell type-specific changes in gene expression in 8 pooled lupus patient samples treated with IFN-b and perform eQTL analysis on 23 pooled samples.
Systemic lupus erythematosus (SLE) is an autoimmune disease defined by a broad range of symptoms that disproportionately affects women. Our knowledge of which immune cells mediate the etiology and pathogenesis of the disease remains incomplete. Identifying pathogenic cells using bulk gene expression analysis is confounded by the functional overlap and frequency
variation of immune cell types. Here, we used multiplexed single-cell RNA-seq (scRNA-seq) to profile ~1 million peripheral blood mononuclear cells from 134 SLE cases and 58 healthy controls. Cases were marked by a reduction of naive CD4+ T cells, clonal restriction of effector
memory CD8+ T cells, and elevated expression of interferon-stimulated genes in classical
monocytes. An additional 15 cases experiencing active disease flares displayed increased expansion of effector memory CD8+ T cells and the presence of macrophages not seen in
managed disease. Although cell-type-specific expression contributed most to inter-individual expression variability across all cells, cell composition accounted for more variability in genes differentially expressed in cases. We integrated dense genotyping data to map thousands of genetic variants, including SLE-associations, whose effects on expression are modified by cell type or interferon activation. Population-scale scRNA-seq analysis reveals changes in cell composition and state associated with SLE, and when integrated with genetic data, ascribes function to disease-associated and disease-modified variants.
Table of Contents
Chapter 1: Introduction ... 1
References ... 4
Chapter 2: Multiplexed droplet single-cell RNA-sequencing using natural genetic variation ... 6
Introduction ... 7 Results ... 10 Discussion ... 16 Methods... 17 Figures... 26 References ... 30
Chapter 3: Multiplexed RNA-sequencing of 1M immune cells reveals the cellular, molecular, and genetic correlates of systemic lupus erythematosus. ... 36
Introduction ... 36 Results ... 39 Methods... 53 Figures... 58 Discussion ... 67 References ... 70
List of Figures
Figure 2.1: demultiplexing and doublet identification from single cell data. ... 26
Figure 2.2: Performance of demuxlet. ... 27
Figure 2.3: Interindividual variability in IFN-β response. ... 28
Figure 2.4 – Genetic control over cell type proportion and gene expression (N=23). ... 29
Figure 3.1: Overview and compositional changes in SLE. ... 58
Figure 3.2: Bulk expression differences and variance decomposition. ... 60
Figure 3.3: Myeloid changes in SLE ... 62
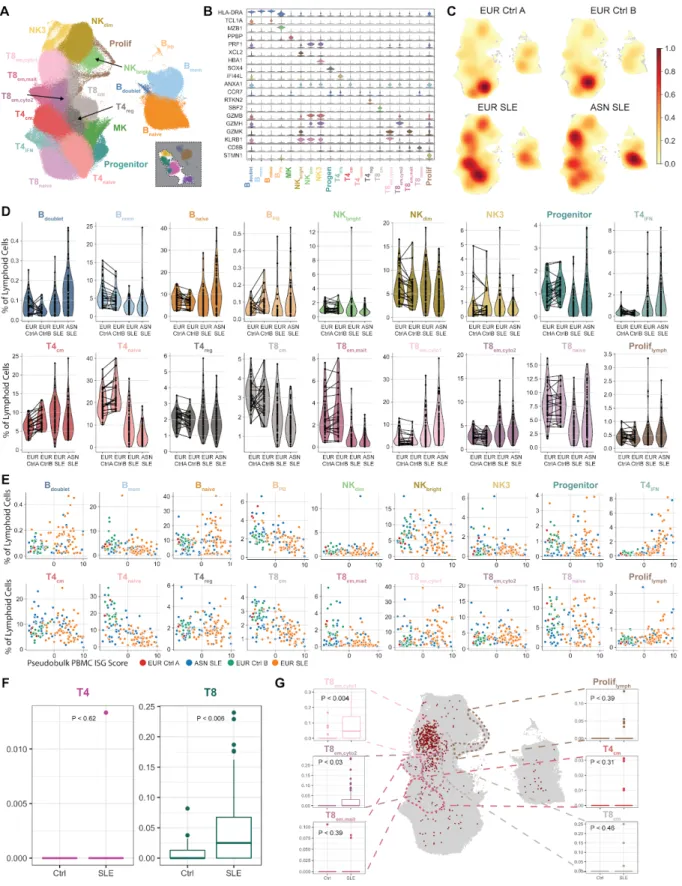
Figure 3.4: Lymphoid changes in SLE. ... 63
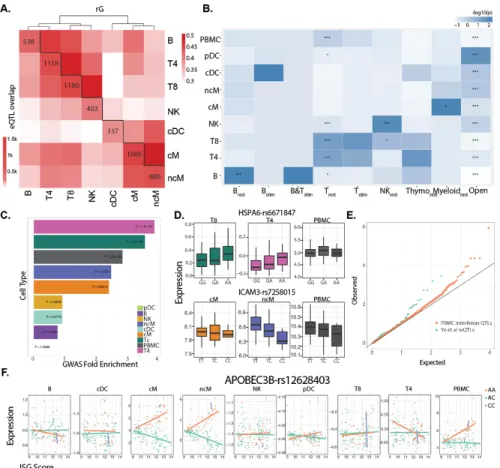
Figure 3.5: cis-eQTL mapping demonstrates cell type specificity and environmental specificty in genetic effects. ... 65
Figure 3.6: SLE flare cohort analysis demonstrates reproducibility of our findings and disease flare specific alterations ... 66
Chapter 1: Introduction
The annotation and functional interpretation of genetic variants from the human genome has been one of the largest challenges in studying complex traits. Although Genome Wide Association Studies (GWAS) have shed light on genetic loci that may be involved in disease pathology, the function of the individual variants that are associated with complex traits are often unknown and poorly understood in the context of a biological mechanism1. To overcome this,
recent studies have quantified genetic variant associations with cellular composition, gene expression, chromatin accessibility, and protein expression in tissues of interest which provide more functional context that is relevant to disease states2–4. Gene expression and chromatin
accessibility have also been used to identify potential biomarkers that are unique to disease states as well as subtype patients into groups where the disease is thought to have multiple functionally distinct mechanisms, suggesting their value in developing better diagnostics and targeted
therapies in the future5,6.
Despite these advances, gene expression profiling of tissues does not offer clarity when the relevant cell type for a specific disease is unknown. For example, in the case of Systemic Lupus Erythematosus (SLE), an autoimmune disease with highly heterogeneous manifestations that is difficult to diagnose, GWAS studies have pointed to numerous cell types in the blood having involvement in the disease etiology7. Likely due to this, studying the peripheral blood in bulk
likely does not capture the variability between patients or signatures from the specific cell subtypes that are dysregulated. Several cell subtypes including B cells, CD4 T cell subsets, and CD8 T cells as well as broad clinical phenotypes such as lymphopenia have been studied in the context of SLE, and shown to change in abundance and state through the disease course8–10.
Additionally, previous work has shown that in the case of SLE, cell type specific gene expression implicates different signatures in different ancestral backgrounds, suggesting that studying interindividual variation across many cell types may inform more personalized medicine and targeted strategies11.
Current bulk gene expression profiling across many cell types is performed by using antibodies for population markers to enrich for each cell type separately, and then prepare individual RNA libraries for each cell type. This procedure is costly, laborious, and prone to confounding effects due to the high number of independent experiments performed. Experimental procedures often take hours to prepare the samples for sequencing, and this impacts the quality and accuracy of the resulting data. Furthermore, the enrichment of specific cell subtypes based on previously identified markers biases the profiling towards known populations and does not lead to the discovery of any novel or unknown cell states that may be relevant to disease. These factors result in biased bulk gene expression profiles that are suboptimal for discovery and studying interindividual variation.
Recent advances in droplet based single cell RNA sequencing have enabled the capture of heterogeneous populations in an unbiased manner12. To date, dscRNA-seq has been used to
characterize heterogeneity in tissues globally, in response to stimulation and knock-down
perturbations, and in tumor composition13–15. Although these studies have led to the discovery of
novel cell populations and shed new light on the dynamics of transcriptional regulation, interindividual variability at single cell resolution remains largely uncharacterized. Previously, single-cell qPCR experiments have shown that the distributional properties of gene expression
may be controlled by genetic variants16. This suggests that characterizing interindividual
variability across single cells and identifying its genetic basis will aid in the discovery and interpretation of disease-causing genetic polymorphisms. Characterizing molecular quantitative traits in specific cell types from peripheral blood mononuclear cells (PBMCs) will aid in the annotation of SLE-associations and shed new light on the pathogenesis of SLE.
In this work we developed a multiplexed scRNA-seq experimental workflow that significantly decreases the cost and labor time to perform scRNA-seq experiments in large-scale cohorts. We show a proof of concept that our algorithm, demuxlet, performs with up to 99% accuracy and are able to replicate biological findings across demultiplexed data. We then applied our workflow to sequence 1M cells across 120 patients with SLE cases and 46 healthy controls, and identified cell composition as well as gene expression features that distinguish cases from controls, and show that cell type specific features are more predictive of clinical criteria for SLE than bulk features. We also performed the first genome-wide single-cell derived eQTL study in patients with SLE and healthy control to discover genetic variants that influence gene expression of different cell subtypes in the immune system.
References
1. 1000 Genomes Project Consortium et al. An integrated map of genetic variation from 1,092 human genomes. Nature491, 56–65 (2012).
2. Lappalainen, T. et al. Transcriptome and genome sequencing uncovers functional variation in humans. Nature501, 506–511 (2013).
3. Gate, R. E. et al. Genetic determinants of co-accessible chromatin regions in activated T cells across humans. Nat. Genet.50, 1140–1150 (2018).
4. Battle, A. et al. Genomic variation. Impact of regulatory variation from RNA to protein.
Science347, 664–667 (2015).
5. Banchereau, R. et al. Personalized Immunomonitoring Uncovers Molecular Networks that Stratify Lupus Patients. Cell165, 551–565 (2016).
6. Corces, M. R. et al. The chromatin accessibility landscape of primary human cancers.
Science362, (2018).
7. Guerra, S. G., Vyse, T. J. & Cunninghame Graham, D. S. The genetics of lupus: a functional perspective. Arthritis Res. Ther.14, 211 (2012).
8. Faddah, S., Elwakd, M., Aboelenein, A. & Hussein, M. Lymphopenia and systemic lupus erythematosus, a preliminary study: Correlation with clinical manifestations, disease activity and damage indices. The Egyptian Rheumatologist36, 125–130 (2014).
9. Matsushita, M. et al. Changes of CD4/CD8 ratio and interleukin-16 in systemic lupus erythematosus. Clin. Rheumatol.19, 270–274 (2000).
10. Sanz, I. & Lee, F. E.-H. B cells as therapeutic targets in SLE. Nat. Rev. Rheumatol.6, 326–337 (2010).
11. Sharma, S. et al. Widely divergent transcriptional patterns between SLE patients of different ancestral backgrounds in sorted immune cell populations. J. Autoimmun.60, 51–58 (2015).
12. Macosko, E. Z. et al. Highly Parallel Genome-wide Expression Profiling of Individual Cells Using Nanoliter Droplets. Cell161, 1202–1214 (2015).
13. Byrnes, L. E. et al. Lineage dynamics of murine pancreatic development at single-cell resolution. Nat. Commun.9, 3922 (2018).
14. Dixit, A. et al. Perturb-Seq: Dissecting Molecular Circuits with Scalable Single-Cell RNA Profiling of Pooled Genetic Screens. Cell167, 1853–1866.e17 (2016).
15. Tirosh, I. et al. Dissecting the multicellular ecosystem of metastatic melanoma by single-cell RNA-seq. Science352, 189–196 (2016).
16. Wills, Q. F. et al. Single-cell gene expression analysis reveals genetic associations masked in whole-tissue experiments. Nat. Biotechnol.31, 748–752 (2013).
Chapter 2: Multiplexed droplet single-cell RNA-sequencing using natural genetic variation
Hyun Min Kang*$1, Meena Subramaniam$2-6, Sasha Targ$2-6,11, Michelle Nguyen7-9, Lenka
Maliskova3,10, Elizabeth McCarthy11, Eunice Wan3, Simon Wong3, Lauren Byrnes12, Cristina
Lanata13,14, Rachel Gate2-6, Sara Mostafavi15, Alexander Marson7-9,16,17, Noah Zaitlen3,13,18,
Lindsey A Criswell3,13,14,19, Chun Jimmie Ye3-6*
1. Department of Biostatistics and Center for Statistical Genetics, University of Michigan School of Public Health, Ann Arbor, Michigan, United States of America
2. Biological and Medical Informatics Graduate Program, University of California, San Francisco, California, USA
3. Institute for Human Genetics (IHG), University of California San Francisco, California, USA 4. Institute for Computational Health Sciences, University of California San Francisco,
California, USA
5. Department of Epidemiology and Biostatistics, University of California San Francisco, California, USA
6. Department of Bioengineering and Therapeutic Sciences, University of California, San Francisco, California, USA
7. Department of Microbiology and Immunology, University of California, San Francisco, California, USA
8. Diabetes Center, University of California, San Francisco, California, USA
9. Innovative Genomics Institute, University of California, Berkeley, California, USA 10. Department of Neurology, University of California, San Francisco, San Francisco, California, USA
11. Medical Scientist Training Program (MSTP), University of California, San Francisco, California, USA
12. Developmental and Stem Cell Biology Graduate Program, University of California, San Francisco, California, USA
13. Department of Medicine, University of California, San Francisco
14. Rosalind Russell/Ephraim P Engleman Rheumatology Research Center, University of California, San Francisco, San Francisco, California, USA
15. Department of Statistics, University of British Columbia, Vancouver, British Columbia, Canada
16. UCSF Helen Diller Family Comprehensive Cancer Center, University of California, San Francisco, CA, USA
17. Chan Zuckerberg Biohub, San Francisco, California, USA
18. Lung Biology Center, University of California, San Francisco, CA, USA
19. Department of Orofacial Sciences, University of California San Francisco, USA
Introduction
Droplet single cell RNA-sequencing (dscRNA-seq) has increased substantially the throughput of single cell capture and library preparation1, 10, enabling the simultaneous profiling of thousands
of cells. Improvements in biochemistry11, 12 and microfluidics13, 14 continue to increase the
number of cells and transcripts profiled per experiment. But for differential expression and population genetics studies, sequencing thousands of cells per individual would better capture inter-individual variability than sequencing more cells from a few individuals. However, in standard workflows, dscRNA-seq of many samples in parallel remains challenging to implement.
If the genetic identity of each cell could be determined, pooling cells from different individuals in one microfluidic run would result in lower per-sample library preparation cost and eliminate confounding effects. Furthermore, if droplets containing multiple cells from different individuals could be detected, pooled cells could be loaded at higher concentrations, enabling additional reduction in per-cell library preparation cost.
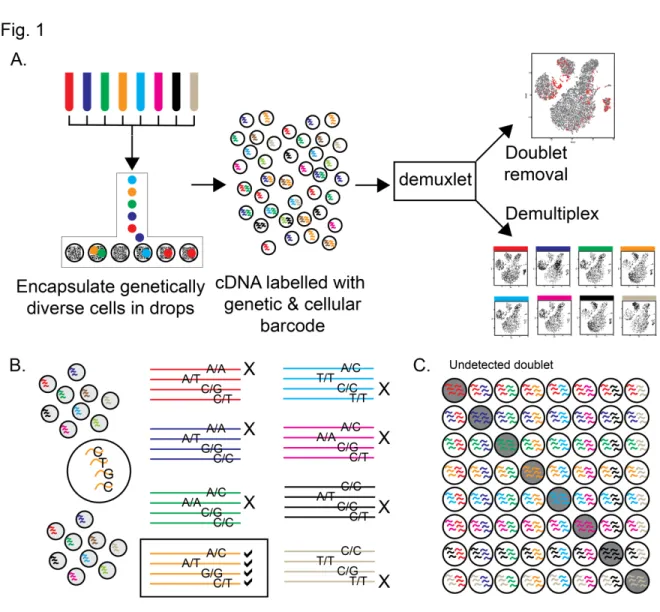
Here we develop an experimental protocol for multiplexed dscRNA-seq and a computational algorithm, demuxlet, that harnesses genetic variation to determine the genetic identity of each cell (demultiplex) and identify droplets containing two cells from different individuals (Fig. 2.1). While strategies to demultiplex cells from different species1, 10, 17 or host and graft samples17
have been reported, simultaneously demultiplexing and detecting doublets from more than two individuals has not been possible. Inspired by models and algorithms developed for detecting contamination in DNA sequencing 18, demuxlet is fast, accurate, scalable, and compatible with
standard input formats17, 19, 20.
Demuxlet implements a statistical model for evaluating the likelihood of observing RNA-seq reads overlapping a set of single nucleotide polymorphisms (SNPs) from a single cell. Given a set of best-guess genotypes or genotype probabilities obtained from genotyping, imputation or sequencing, demuxlet uses maximum likelihood to determine the most likely donor for each cell using a mixture model. A small number of reads overlapping common SNPs is sufficient to accurately identify each cell. For a pool of 8 individuals and a set of uncorrelated SNPs each with 50% minor allele frequency (MAF), 4 reads overlapping SNPs are sufficient to uniquely assign a cell to the donor of origin (Fig. 2.1) and 20 reads overlapping SNPs can distinguish every sample with >98% probability in simulation (Supplementary Fig. 1). We note that by multiplexing even a small number of individuals, the probability that a doublet contains cells
from different individuals is very high (1 – 1/N, e.g., 87.5% for N=8 samples) (Fig. 2.1). For example, if a 1,000 cell run without multiplexing results in 990 singlets with a 1% undetected doublet rate, multiplexing 1,570 cells each from 63 samples can theoretically achieve the same rate of undetected doublets, producing up to a 37-fold larger number of singlets (36,600) if the sample identity of every droplet can be perfectly demultiplexed (Supplementary Fig. 2, see Methods for details). To minimize the effects of sequencing doublets, profiling 22,000 cells multiplexed from 26 individuals generates 23-fold more singlets at the same effective doublet rate (Supplementary Fig. 3).
Results
We first assess the performance of multiplexed dscRNA-seq through simulation. The ability to demultiplex cells is a function of the number of individuals multiplexed, the depth of sequencing or number of read-overlapping SNPs, and relatedness of multiplexed individuals. We simulated 6,145 cells (5,837 singlets and 308 doublets) from 2 – 64 individuals from the 1000 Genomes Project21. We show that 50 SNPs per cell allows demultiplexing of 97% of singlets and
identification of 92% of doublets in pools of up to 64 individuals (Supplementary Figs. 4-5, see Methods for details). Simulating a range of sequencing depths, we determined that 50 SNPs can be obtained with as few as 1,000 unique molecular identifiers (UMIs) per cell (Supplementary Fig. 6), and recommended sequencing depths of standard dscRNA-seq workflows would capture hundreds of SNPs. To assess dependence on the relatedness of multiplexed individuals, we simulated 6,145 cells from a set of 8 related individuals from 1000 Genomes21. In this
simulation, 50 SNPs per cell would allow demuxlet to correctly assign over 98% of cells
(Supplementary Fig. 7). These results suggest optimal multiplexed designs where cells from tens of unrelated individuals should be pooled, loaded at concentrations 2-10x higher than standard workflows, and sequenced to at least 1,000 UMIs per cell.
We evaluate the performance of demuxlet by analyzing a pool of peripheral blood mononuclear cells (PBMCs) from 8 lupus patients. By sequential pairwise pooling, three pools of equimolar concentrations of cells were generated (W1: patients S1-S4, W2: patients S5-S8 and W3: patients S1-S8) and each loaded in a well on a 10X Chromium instrument (Fig. 2.2). 3,645 (W1), 4,254 (W2) and 6,205 (W3) cell-containing droplets were sequenced to an average depth of 51,000, 39,000 and 28,000 reads per droplet.
In wells W1, W2 and W3, demuxlet identified 91% (3332/3645), 91% (3864/4254), and 86% (5348/6205) of droplets as singlets (likelihood ratio test, L(singlet)/L(doublet) > 2), of which 25% (+/- 2.6%), 25% (+/- 4.6%) and 12.5% (+/- 1.4%) mapped to each donor, consistent with equal mixing of individuals in each well. From wells W1 and W2, each containing cells from two disjoint sets of 4 individuals, we estimated a demultiplexing error rate (number of cells assigned to individuals not in the pool) of less than 1% of singlets (W1: 2/3332, W2: 0/3864) (Fig. 2.2).
We next assess the ability of demuxlet to detect doublets in both simulated and real data. 466/3645 (13%) droplets from W1 were simulated as synthetic doublets by setting the cellular barcodes of 466 cells each from individuals S1 and S2 to be the same. Applied to simulated data, demuxlet identified 91% (426/466) of synthetic doublets as doublets or ambiguous, correctly recovering the sample identity of both cells in 403/426 (95%) doublets (Supplementary Fig. 8). Applied to real data from W1, W2 and W3, demuxlet identified 138/3645, 165/4254, and 384/6205 doublets corresponding to doublet rates of 5.0%, 5.2% and 7.1%, consistent with the expected doublet rates estimated from mixed species experiments (Fig. 2.2).
Demultiplexing of pooled samples allows for the statistical and visual comparisons of individual-specific dscRNA-seq profiles. Singlets identified by demuxlet in all three wells cluster into known immune cell types (Fig. 2.2) and are correlated with bulk RNA-sequencing of sorted cell populations (R=0.76-0.92) (Supplementary Fig. 9). For the same individuals from different wells, t-distributed stochastic neighbor embedding (t-SNE) of dscRNA-seq data are qualitatively consistent, and estimates of cell type proportions are highly correlated (R = 0.99) (Fig. 2.2 and Supplementary Fig. 10). Further, t-SNE projections of the pool and each individual are not confounded by well-to-well effects (Supplementary Fig. 11a).While 6 genes were differentially
expressed between wells W1 and W2 (DESeq2 on pseudobulk counts, FDR < 0.05), only 2 genes were differentially expressed between W1 and W2 individuals in well W3 (FDR < 0.05) (Supplementary Fig. 11b), suggesting multiplexing reduces technical effects due to separate sample processing22, 23.
We used multiplexed dscRNA-seq to characterize the cell type specificity and inter-individual variability of response to IFN-β, a potent cytokine that induces genome-scale changes in the transcriptional profiles of immune cells24, 25. From each of 8 lupus patients, PBMCs were
activated with recombinant IFN-β or left untreated for 6 hours, a time point we previously found to maximize the expression of interferon-sensitive genes (ISGs) in dendritic cells (DCs) and T cells26, 27. Two pools, IFN-β-treated and control, were prepared with the same number of cells
from each individual and loaded onto the 10X Chromium instrument.
We obtained 14,619 (control) and 14,446 (stimulated) cell-containing droplets, of which demuxlet identified 83% (12,138) and 84% (12,167) as singlets. The estimated doublet rate of 10.9% in each condition is consistent with predicted rates (Fig. 2.2) and the observed and expected frequencies of doublets for each pair of individuals are highly correlated (R=0.98) (Supplementary Fig. 12). Detected doublets form distinct clusters near the periphery of other clusters defined by cell type (Supplementary Fig. 13).
Demultiplexing individuals enables the use of the 8 individuals within each pool as biological replicates to quantitatively assess cell type-specific IFN-β responses in PBMCs. Consistent with previous reports from bulk RNA-sequencing data, IFN-β stimulation induces widespread
transcriptomic changes observed as a shift in the t-SNE projections of singlets24 (Fig. 2.3). As
expected, IFN-β did not affect cell type proportions between control and stimulated cells
(Supplementary Fig. 15). Estimates of abundances for ~2000 homologous genes in each cell type and condition correlated with similar data from mice (Supplementary Fig. 16). We identified 3,055 differentially expressed genes (logFC > 2, FDR < 0.05) in at least one cell type
(Supplementary Table 1). For 709 genes, estimates of fold change in response to IFN-β stimulation in myeloid and CD4+ cells are consistent with estimates in monocyte derived
dendritic cells28 and CD4+ T cells27, respectively (Supplementary Fig. 17) and correlated with
qPCR results of sorted CD4+ T cells (Supplementary Fig. 18). Differentially expressed genes
cluster into modules of cell type-specific responses enriched for distinct gene regulatory programs (Fig. 2.3, Supplementary Table 2). For example, genes upregulated in all leukocytes (Cluster III: 401 genes, logFC > 2, FDR < 0.05) or only in myeloid cells (Cluster I: 767 genes, logFC > 2, FDR < 0.05) are enriched for general antiviral response (e.g. KEGG Influenza A: Cluster III P < 1.6x10⁻⁵), chemokine signaling (Cluster I P < 7.6x10⁻³) and pathways active in
systemic lupus erythematosus (Cluster I P < 4.4x10⁻³). The five clusters of downregulated genes
are enriched for antibacterial response (KEGG Legionellosis: Cluster II monocyte down P < 5.5x10⁻³) and natural killer cell mediated toxicity (Cluster IV NK/Th cell down: P < 3.6x10⁻²).
The analysis of multiplexed dscRNA-seq data recovers cell type-specific gene regulatory
programs affected by interferon stimulation consistent with published IFN-β signatures in mouse and humans29.
Over all PBMCs, the variance of mean expression across individuals is higher than the variance across synthetic replicates whose cells were randomly sampled (Lin’s concordance = 0.022, Pearson correlation= 0.69, Fig. 2.3). The variance across synthetic replicates whose cells were sampled matching for cell type proportions is more concordant with the variance across individuals (Lin’s concordance = 0.54, Pearson correlation = 0.78, Fig. 2.3), suggesting a
contribution of cell type composition on expression variability. However, for each cell type, the variance across individuals22, 30 is also higher than the variance across synthetic replicates (Lin’s
concordance = 0.007-0.20) suggesting additional inter-individual variability not due to cell type composition (Supplementary Fig. 19). In CD14+CD16- monocytes, the correlation of mean
expression between pairs of synthetic replicates from the same individual (>99%) is greater than from different individuals (~97%), further indicating inter-individual variation beyond sampling (Fig. 2.3). We found between 15 to 827 genes with statistically significant inter-individual variability in control cells and 7 to 613 in stimulated cells (Pearson correlation, FDR < 0.05), with most found in classical monocytes (cM) and CD4+ helper T (Th) cells. Inter-individual
variable genes in stimulated cM and to a lesser extent in Th cells (P < 9.3x10⁻⁴ and 4.5x10⁻²,
hypergeometric test, Fig. 2.3) are enriched for differentially expressed genes, consistent with our previous discovery of more IFN-β response-eQTLs in monocyte-derived dendritic cells than CD4+ T cells26, 27. Comparing to 407 genes previously profiled in bulk monocyte-derived
dendritic cells, the proportion of variance explained by inter-individual variability is more correlated in myeloid cells after stimulation (R = 0.26 – 0.3) than before (R = 0.05 – 0.19). To map genetic variants associated with cell type proportions and cell type-specific expression using multiplexed dscRNA-seq, we sequenced an additional 15,250 (7 donors), 22,619 (8 donors) and 25,918 cells (15 donors; 8 lupus patients, 5 rheumatoid arthritis patients, and 2 healthy controls). Demuxlet identified 71% (10,766/15,250), 73% (16,618/22,619) and 60% (15,596/25,918) of droplets as singlets, correctly assigning 99% of singlets from the first two pools, W1 and W2 (10,740/10,766 and 16,616/16,618). The estimated doublet rates of 18%, 18% and 25% are consistent with the increased concentrations of loaded cells (Fig. 2.2). Similar to the IFN-β stimulation experiment, we found that expression variability was determined by variability
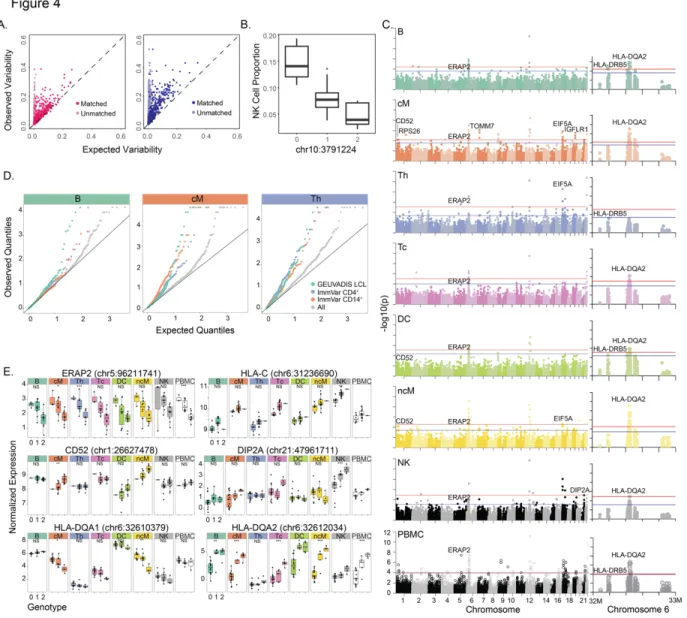
in cell type proportion (Fig. 2.4) and reproducible between batches (Supplementary Fig. 20). Associating >150,000 genetic variants (MAF > 20%) with the proportion of 8 major immune cell populations, we identified a SNP (chr10:3791224) significantly associated (P = 1.03 x 10⁻⁵, FDR
< 0.05) with the proportion of NK cells (Fig. 2.4).
Across 23 donors, we conducted an expression quantitative trait loci (eQTL) analysis to map genetic variants associated with expression variability in each major immune cell type. We found a total of 32 local eQTLs (+/- 100kb, FDR < 0.1), 22 of which were detected in only one cell type (Fig. 2.4,Supplementary Table 3). Previously reported local eQTLs from bulk CD14+
monocytes, CD4+ T cells and lymphoblastoid cell lines are more significantly associated with
gene expression in the most similar cell types (cM, Th and B cells, respectively) than other cell types (Fig. 2.4). We used an inverse variance weighted meta-analysis to identify genes with pan-cell type eQTLs, including those in the major histocompatibility complex (MHC) class I antigen presentation pathway including ERAP2 (P < 3.57x10⁻³², meta-analysis), encoding an
aminopeptidase known to cleave viral peptides34, and HLA-C (P < 1.74x10⁻²⁹, meta-analysis),
which encodes the MHC class I heavy chain (Fig. 2.4). HLA-DQA1 has local eQTLs only in some cell types (P <2.11x10⁻¹⁵, Cochran’s Q) while HLA-DQA2 has local eQTLs in all antigen
presentation cells (P < 1.02e10-43, Cochran’s Q). Among other cell type-specific local eQTLs are
CD52, a gene ubiquitously expressed in leukocytes that only has eQTLs in monocyte
populations, and DIP2A, a gene with an eQTL only in NK cells that is associated with immune response to vaccination in peripheral blood35. These results demonstrate the ability of
multiplexed dscRNA-seq to characterize inter-individual variation in immune response and when integrated with genetic data, reveal cell type-specific genetic control of gene expression, which would be undetectable when bulk tissues are analyzed.
Discussion
The capability to demultiplex and identify doublets using natural genetic variation reduces the per-sample and per-cell library preparation cost of single-cell RNA-sequencing, does not require synthetic barcodes or split-pool strategies36-40, and captures biological variability among
individual samples while limiting unwanted technical variability. We find the optimal number of samples to multiplex is approximately 20, based on sample processing time and empirical doublet rates of current microfluidic devices and anticipate that automated sample handling and lower doublet rates will increase the optimal number of individuals to multiplex.
Compared to sorting known cell types followed by bulk RNA-seq, multiplexed dscRNA-seq is a more efficient and unbiased method for obtaining cell type-specific immune traits41. Demuxlet
enables reliable estimation of cell type proportion, recovers cell type-specific transcriptional response to stimulation, and could facilitate further genetic and longitudinal analyses in relevant cell types and conditions across a range of sampled individuals, including between healthy controls and disease patients42-44. While demuxlet could in principle be applied to sequencing
solid tissue, standardizing sample processing and preservation remain major challenges. Although we developed demuxlet specifically for RNA-sequencing, we anticipate that the computational framework could be easily extended to other single cell assays where synthetic barcodes or natural genetic variation are measured by sequencing.
Methods
Identifying the sample identity of each single cell.
We first describe the method to infer the sample identity of each cell in the absence of doublets. Consider RNA-sequence reads from C barcoded droplets multiplexed across S different samples, where their genotypes are available across V exonic variants. Let !"# be the number of unique reads overlapping with the v-th variant from the c-th droplet. Let $"#% ∈ {(, *, +}, - ∈
{1, ⋯ , !"#} be the variant-overlapping base call from the i-th read, representing reference (R),
alternate (A), and other (O) alleles respectively. Let 0"#% ∈ {0,1} be a latent variable indicating
whether the base call is correct (0) or not (1), then given 0"#% = 0, $"#% ∈ {( = 0, * = 1} and
~ Binomial <2,>?@ when A ∈ {0,1,2} is the true genotype of sample corresponding to c-th
droplet at v-th variant. When 0"#% = 1, we assume that Pr($"#%|A, 0"#%) follows Supplementary Table 4. 0"#% is assumed to follow Bernoulli <10IJKLMNO @ where P"#% is a phred-scale quality score of the observed base call. We use the standard 10X pipeline to process the raw reads which estimates the phred-scale quality score based on the alignment of each read to the reference human transcriptome using the STAR aligner49.
We allow uncertainty of observed genotypes at the v-th variant for the s-th sample using
QR#(>) = Pr(A|DataR#), the posterior probability of a possible genotype A given external DNA data DataR# (e.g. sequence reads, imputed genotypes, or array-based genotypes). If genotype
likelihood Pr(DataR#|A) is provided (e.g. unphased sequence reads) instead, it can be converted to a posterior probability scale using QR#(>) = Pr (DataR#|A)Pr (A) where
allow errors V in the posterior probability, we replace it with (1 − V)QR#(>)+ VPr (A). The overall likelihood that the c-th droplet originated from the s-th sample is
Y"(Z) = ∏ \∑ ^∏ (∑_ Pr($"#%|A, 0) `ab )QR#(>) cKL %a_ d ? >ab e f #a_ (1)
In the absence of doublets, we use the maximum likelihood to determine the best-matching sample as argmaxR[Y"(Z)].
Screening for droplets containing multiple samples.
To identify doublets, we implement a mixture model to calculate the likelihood that the sequence reads originated from two individuals, and the likelihoods are compared to determine whether a droplet contains cells from one or two samples. If sequence reads from the c-th droplet originate from two different samples, Z_, Z? with mixing proportions (1 − k) ∶ k, then the likelihood in (1) can be represented as the following mixture distribution18,
Y"(Z_, Z?, α) = ∏ \∑ ^∏ (∑_ (1 − α)Pr($"#%|A_, 0) + kPr($"#%|A?, 0) `ab )QR#(>N)QR#(>n) cKL %a_ d >N,>n e f #a_
To reduce the computational cost, we consider discrete values of α ∈ {α_, ⋯ , αo}, (e.g. 5 - 50% by 5%). We determine that it is a doublet between samples Z_, Z? if and only if
pqrsN,sn,tuK(RN,Rn,v)
pqrsuK(R) ≥ x and the most likely mixing proportion is estimated to be
argmaxyY"(Z_, Z?, k). We determine that the cell contains only a single individual s if pqrsN,sn,tuK(RN,Rn,v)
pqrsuK(R) ≤
_
{ , and less confident droplets are classified as ambiguous. While we
consider only doublets for estimating doublet rates, we remove all doublets and ambiguous droplets to conservatively estimate singlets. Supplementary Fig. 8 illustrates the distribution of singlet, doublet likelihoods and the decision boundaries when t = 2 was used.
Theoretical expectation of deconvoluting singlets.
The theoretical distribution of expected singlets with multiplexing (presented in Supplementary Fig. 2) is as follows. Let !| (e.g. 0.01) be the proportion of true multiplets when }| (1,000) cells are loaded when multiplexing was not used. Then the expected multiplet rates when x cells are loaded can be modeled exponentially as !(}) = 1 − (1 − !b)~O~. Let k be the fraction of true singlets incorrectly classified as non-singlets (i.e. doublet or ambiguous), and be the fraction of multiplets correctly classified as non-singlets. When multiplexing } cells equally from Ä
samples, the expected multiplet rates are !(}), and Å_!(}) are expected to be undetectable doublets mixed between the cells from the same sample. Therefore, the overall effective
multiplet rate is \ÅI(ÅI_)ÇÅ e !(}). Similarly, the expected number of correctly identified singlets becomes (_Iy)[_Ic(É)]ÉOc(É)
IÑÖÜ (_IcO) . Given k, the expected number of singlets can be calculated by fixing the multiplet rate !(}) = !b. We used !b = 0.01, }b = 1000 for the simulation in
Supplementary Fig. 2.
Dependence of demultiplexing performance on experimental design parameters.
The demuxlet ‘plp’ option was used to generate a pileup format of 6,145 cells from one well of PBMC 10x data. The reads in the pileup were then modified to reflect the genotypes of
individuals sampled from the 1000 Genomes Phase 3 cohort. The pileup was downsampled to obtain different numbers of read-overlapping exonic SNPs (ranging from 5,000 to 100,000) for the whole cohort. To create simulated doublets, we randomly sampled and merged pairs of barcodes within a dataset, resulting in a 5% doublet rate in the original data. For simulations with related individuals, we simulated transcriptomes from 8 individuals in 1000 Genomes with
varying degrees of relatedness, ranging from unrelated to parent-child (HG00146, HG00147, HG00500, HG00501, HG00502, HG00512, HG00514, and HG00524).
Isolation and preparation of PBMC samples.
Informed consent was obtained from all patients sequenced in this study. Peripheral blood mononuclear cells were isolated from patient donors, Ficoll separated, and cryopreserved by the UCSF Core Immunologic Laboratory (CIL). PBMCs were thawed in a 37°C water bath, and subsequently washed and resuspended in EasySep buffer (STEMCELL Technologies). Cells were treated with DNAseI and incubated for 15 min at RT before filtering through a 40um column. Finally, the cells were washed in EasySep and resuspended in 1x PBMS and 0.04% bovine serum albumin. Cells from 8 donors were then re-concentrated to 1M cells per mL and then serially pooled. At each pooling stage, 1M cells per mL were combined to result in a final sample pool with cells from all donors.
IFN-β stimulation and culture.
Prior to pooling, samples from 8 individuals were separated into two aliquots each. One aliquot of PBMCs was activated by 100 U/mL of recombinant IFN-β (PBL Assay Science) for 6 hrs according to the published protocol26. The second aliquot was left untreated. After 6 hrs, the 8
samples for each condition were pooled together in two final pools (stimulated cells and control cells) as described above.
Fluorescence-activated cell sorting and analysis.
1M PBMCs from each donor were stained using standard procedure (30 min, 4 C) with the following surface antibody panel (CD3-PerCP clone SK7 (BioLegend), CD4-APC clone OKT4 (BioLegend), CD8-BV570 clone RPA-T8 (BioLegend), CD14-FITC clone 63D3 (BioLegend), CD19-BV510 clone SJ25C1 (BD), and Ghost dye A710 viability stain (Tonbo)) (Life Sciences Reporting Summary). Samples were then analyzed and sorted using a BD FACSAria Fusion instrument at the UCSF flow cytometry core. To calculate cell type proportions, the number of events in each of CD3+ CD4+ CD8- (CD4+ T cells), CD3+ CD4- CD8+ (CD8+ T cells), CD3
-CD19+ (B cells), and CD3- CD14+ (monocytes) were divided by the sum of events in these gates
(Supplementary Fig. 21).
Quantitative polymerase chain reaction analysis.
RNA was isolated from sorted CD4+ T cells following the RNeasy micro kit protocol
(QIAGEN), and cDNA was prepared using MultiScribe Reverse Transcriptase (Applied
Biosystems cat #4368814). The qPCR primers were chosen from the PrimerBank reference when available 50. Each sample was run in triplicate with the Luminaris HiGreen qPCR kit (Thermo
Scientific #K0992) according to standard protocol using a Roche Light Cycler 96 instrument and fold change was calculated from DDCT between control and stimulated samples with GAPDH as a reference gene.
Droplet-based capture and sequencing.
Cellular suspensions were loaded onto the 10x Chromium instrument (10x Genomics) and sequenced as described in Zheng et al17. The cDNA libraries were sequenced using a custom
program on 10 lanes of Illumina HiSeq2500 Rapid Mode, yielding 1.8B total reads and 25K reads per cell. At these depths, we recovered >90% of captured transcripts in each sequencing experiment.
Bulk isolation and sequencing.
PBMCs from lupus patients were isolated and prepared as described above. Once resuspended in EasySep buffer, the EasyEights Magnet was used to sequentially isolate CD14+ (using the
EasySep Human CD14 positive selection kit II, cat #17858), CD19+ (using the EasySep Human
CD19 positive selection kit II, cat #17854), CD8+ (EasySep Human CD8 positive selection kitII,
cat#17853), and CD4+ cells (EasySep Human CD4 T cell negative isolation kit (cat #17952)
according to the kit protocol. RNA was extracted using the RNeasy Mini kit (#74104), and reverse transcription and tagmentation were conducted according to Picelli et al. using the SmartSeq2 protocol51, 52. After cDNA synthesis and tagmentation, the library was amplified with
the Nextera XT DNA Sample Preparation Kit (#FC-131-1096) according to protocol, starting with 0.2ng of cDNA. Samples were then sequenced on one lane of the Illumina Hiseq4000 with paired end 100bp read length, yielding 350M total reads.
Alignment and initial processing of single cell sequencing data.
We used the CellRanger v1.1 and v1.2 software with the default settings to process the raw FASTQ files, align the sequencing reads to the hg19 transcriptome, and generate a filtered UMI expression profile for each cell17. The raw UMI counts from all cells and genes with nonzero
Cell type classification and clustering.
To identify known immune cell populations in PBMCs, we used the Seurat package to perform unbiased clustering on the 2.7k PBMCs from Zheng et al., following the publicly available Guided Clustering Tutorial17, 53. The FindAllMarkers function was then used to find the top 20
markers for each of the 8 identified cell types. Cluster averages were calculated by taking the average raw count across all cells of each cell type. For each cell, we calculated the Spearman correlation of the raw counts of the marker genes and the cluster averages, and assigned each cell to the cell type to which it had maximum correlation.
Differential expression analysis.
Demultiplexed individuals were used as replicates for differential expression analysis. For each gene, raw counts were summed for each individual. We used the DESeq2 package to detect differentially expressed genes between control and stimulated conditions54. Genes with
baseMean > 1 were filtered out from the DESeq2 output, and the qvalue package was used to calculate FDR < 0.05 55.
Estimation of interindividual variability in PBMCs.
For each individual, we found the mean expression of each gene with nonzero counts. The mean was calculated from the log2 single cell UMI counts normalized to the median count for each cell. To measure interindividual variability, we then calculated the variance of the mean
expression across all individuals. Lin’s concordance correlation coefficient was used to compare the agreement of observed data and synthetic replicates. Synthetic replicates were generated by sampling without replacement either from all cells or cells matched for cell type proportion. Cell
type-specific variability estimated as the correlation between synthetic replicates was compared to variability estimates from 23 biological replicates of bulk IFN-stimulated monocyte-derived dendritic cells. Protein coding genes (407/414) originally measured using Nanostring (a
hybridization based PCR-free quantification method) were assessed, and variability in the bulk dataset was estimated as repeatability using a linear mixed model56,26.
Estimation of interindividual variability within cell types.
For each cell type, we generated two bulk equivalent replicates for each individual by summing raw counts of cells sampled without replacement. We used DESeq2 to generate
variance-stabilized counts across all replicates. To filter for expressed genes, we performed all subsequent analyses on genes with 5% of samples with > 0 counts. The correlation of replicates was
performed on the log2 normalized counts. Pearson correlation of the two replicates from each of the 8 individuals was used to find genes with significant interindividual variability.
Quantitative trait mapping in major immune cell types.
Genotypes were imputed with EAGLE57 and filtered for MAF > 0.2, resulting in a total of
189,322 SNPs. Cell type proportions were calculated as number of cells for each cell type divided by the number of total cells for each person. Linear regression was used to test associations between each genetic variant and cell-type proportion with the Matrix eQTL software58. Cis-eQTL mapping was conducted in each cell type separately. All genes with at
least 50 UMI counts in 20% of the individuals in all PBMCs were tested for each cell type, resulting in a total of 4,555 genes. Variance-stabilized and log-normalized gene expression was calculated using the ‘rlog’ function of the DESeq2 package54. All variants within a window of
100kbp of each gene were tested with linear regression using Matrix eQTL58. Batch information
for each sample as well as the first 3 principal components of the expression matrix were used as covariates.
Single cell and bulk RNA-sequencing data has been deposited in the Gene Expression Omnibus under the accession number GSE96583. Demuxlet software is freely available at
Figures
Figure 2.1: demultiplexing and doublet identification from single cell data.
a) Pipeline for experimental multiplexing of unrelated individuals, loading onto droplet-based single-cell RNA-sequencing instrument, and computational demultiplexing (demux) and doublet removal using demuxlet. Assuming equal mixing of 8 individuals, b) 4 genetic variants can recover the sample identity of a cell, and c) 87.5% of doublets will contain cells from two different samples.
Figure 2.2: Performance of demuxlet.
a) Experimental design for equimolar pooling of cells from 8 unrelated samples (S1-S8) into three wells (W1-W3). W1 and W2 contain cells from two disjoint sets of 4 individuals. W3 contains cells from all 8 individuals. b) Demultiplexing single cells in each well recovers the expected individuals. c) Estimates of doublet rates versus previous estimates from mixed species experiments. d) Cell type identity determined by prediction to previously annotated PBMC data. e) t-SNE plot of two individuals (S1 and S5) from different wells are qualitatively concordant.
Figure 2.3: Interindividual variability in IFN-β response.
a) t-SNE plot of unstimulated (blue) and IFN-β-stimulated (red) PBMCs and the estimated cell types. b) Cell type-specific expression in stimulated (left) and unstimulated (right) cells.
Differentially expressed genes shown (FDR < 0.05, |log(FC)| > 1). Each column represents cell type-specific expression for each individual from demuxlet. c) Observed variance (y-axis) in mean expression over all PBMCs from each of the 8 individuals versus expected variance (x-axis) over synthetic replicates sampled across all cells (light blue, pink) or replicates matched for cell type proportion (blue, red). d) Cell type proportions for each individual in unstimulated and stimulated cells. e) Correlation between sample replicates in control and stimulated cells. f) Number of significantly variable genes in each cell type and condition.
Figure 2.4 – Genetic control over cell type proportion and gene expression (N=23).
a) Observed variance (y-axis) in mean expression over all PBMCs from each individual versus expected variance (x-axis) over synthetic replicates sampled across batch 1 (left, N=8) and batch 3 (right, N=15). b) Association of chr10:3791224 with NK cell type proportions. c) Genome-wide and chromosome 6 Manhattan plots across all major cell types. Horizontal lines correspond to FDR < 0.1 (blue) and FDR < 0.05 (red). d) Q-Q plots across all genes and subsets of
previously published eQTLs in relevant cell types are shown for B, cM, and Th populations. e) Notable cis-eQTLs across all major immune cell types are marked with *(FDR < 0.25), ** (FDR < 0.1), and *** (FDR < 0.05). Lack of association is marked with NS (not significant).
References
1. Macosko, E.Z. et al. in Cell, Vol. 161 1202-1214 (2015).
2. Pollen, A.A. et al. Low-coverage single-cell mRNA sequencing reveals cellular heterogeneity and activated signaling pathways in developing cerebral cortex. Nat Biotech32, 1053-1058 (2014).
3. Buenrostro, J.D. et al. in Nature, Vol. 523 486-490 (Nature Research, 2015). 4. Nagano, T. et al. in Nature, Vol. 502 59-64 (2013).
5. Patel, A.P. et al. in Science, Vol. 344 1396-1401 (American Association for the Advancement of Science, 2014).
6. Tirosh, I. et al. in Science, Vol. 352 189-196 (American Association for the Advancement of Science, 2016).
7. Muraro, M.J. et al. A Single-Cell Transcriptome Atlas of the Human Pancreas. Cell Syst
3, 385-394 e383 (2016).
8. Baron, M. et al. A Single-Cell Transcriptomic Map of the Human and Mouse Pancreas Reveals Inter- and Intra-cell Population Structure. Cell Syst3, 346-360 e344 (2016).
9. Shalek, A.K. et al. in Nature (2014).
10. Klein, A.M. et al. Droplet Barcoding for Single-Cell Transcriptomics Applied to Embryonic Stem Cells. Cell161, 1187-1201 (2015).
11. Stegle, O., Teichmann, S.A. & Marioni, J.C. Computational and analytical challenges in single-cell transcriptomics. Nat Rev Genet16, 133-145 (2015).
12. Gawad, C., Koh, W. & Quake, S.R. Single-cell genome sequencing: current state of the science. Nat Rev Genet17, 175-188 (2016).
13. Streets, A.M. et al. Microfluidic single-cell whole-transcriptome sequencing.
Proceedings of the National Academy of Sciences of the United States of America111, 7048-7053 (2014).
14. Zilionis, R. et al. Single-cell barcoding and sequencing using droplet microfluidics. Nat. Protocols12, 44-73 (2017).
15. Ziegenhain, C. et al. Comparative Analysis of Single-Cell RNA Sequencing Methods.
Molecular Cell65, 631-643.e634 (2017).
16. Hicks, S.C., Teng, M. & Irizarry, R.A. in bioRxiv 025528 (Cold Spring Harbor Labs Journals, 2015).
17. Zheng, G.X.Y. et al. in Nature Communications | doi:10.1038/ncomms9687, Vol. 8 14049 (Nature Publishing Group, 2017).
18. Jun, G. et al. in The American Journal of Human Genetics, Vol. 91 839-848 (2012). 19. Danecek, P. et al. The variant call format and VCFtools. Bioinformatics27, 2156-2158 (2011).
20. Li, H. et al. The Sequence Alignment/Map format and SAMtools. Bioinformatics25, 2078-2079 (2009).
21. The Genomes Project, C. A global reference for human genetic variation. Nature526, 68-74 (2015).
22. Aguirre-Gamboa, R. et al. Differential Effects of Environmental and Genetic Factors on T and B Cell Immune Traits. Cell Reports17, 2474-2487.
23. Li, Y. et al. A Functional Genomics Approach to Understand Variation in Cytokine Production in Humans. Cell167, 1099-1110.e1014 (2016).
24. Mostafavi, S. et al. Parsing the Interferon Transcriptional Network and Its Disease Associations. Cell164, 564-578.
25. Stark, G.R., Kerr, I.M., Williams, B.R.G., Silverman, R.H. & Schreiber, R.D. in
http://dx.doi.org/10.1146/annurev.biochem.67.1.227, Vol. 67 227-264 ( Annual Reviews 4139 El Camino Way, P.O. Box 10139, Palo Alto, CA 94303-0139, USA, 2003).
26. Lee, M.N. et al. in Science, Vol. 343 1246980-1246980 (2014). 27. Ye, C.J. et al. in Science, Vol. 345 1254665-1254665 (2014).
28. Andrés, A.M. et al. Balancing Selection Maintains a Form of ERAP2 that Undergoes Nonsense-Mediated Decay and Affects Antigen Presentation. PLOS Genetics6, e1001157 (2010).
29. Mostafavi, S. et al. Parsing the Interferon Transcriptional Network and Its Disease Associations. Cell164, 564-578 (2016).
30. Palmer, C., Diehn, M., Alizadeh, A.A. & Brown, P.O. Cell-type specific gene expression profiles of leukocytes in human peripheral blood. BMC Genomics7, 115 (2006).
31. Lappalainen, T. et al. Transcriptome and genome sequencing uncovers functional variation in humans. Nature501, 506-511 (2013).
32. Orrù, V. et al. Genetic Variants Regulating Immune Cell Levels in Health and Disease.
Cell155, 242-256 (2013).
33. Brodin, P. et al. Variation in the Human Immune System Is Largely Driven by Non-Heritable Influences. Cell160, 37-47 (2015).
34. Saveanu, L. et al. Concerted peptide trimming by human ERAP1 and ERAP2 aminopeptidase complexes in the endoplasmic reticulum. Nat Immunol6, 689-697 (2005).
35. Franco, L.M. et al. Integrative genomic analysis of the human immune response to influenza vaccination. eLife2, e00299 (2013).
36. Cao, J. et al. Comprehensive single cell transcriptional profiling of a multicellular organism by combinatorial indexing. bioRxiv (2017).
37. Dixit, A. et al. Perturb-Seq: Dissecting Molecular Circuits with Scalable Single-Cell RNA Profiling of Pooled Genetic Screens. Cell167, 1853-1866.e1817 (2016).
38. Adamson, B. et al. A Multiplexed Single-Cell CRISPR Screening Platform Enables Systematic Dissection of the Unfolded Protein Response. Cell167, 1867-1882.e1821 (2016). 39. Jaitin, D.A. et al. Dissecting Immune Circuits by Linking CRISPR-Pooled Screens with Single-Cell RNA-Seq. Cell167, 1883-1896.e1815 (2016).
40. Datlinger, P. et al. Pooled CRISPR screening with single-cell transcriptome readout. Nat Meth14, 297-301 (2017).
41. Farh, K.K.-H. et al. Genetic and epigenetic fine mapping of causal autoimmune disease variants. Nature518, 337-343 (2015).
42. Buettner, F. et al. Computational analysis of cell-to-cell heterogeneity in single-cell RNA-sequencing data reveals hidden subpopulations of cells. Nat Biotech33, 155-160 (2015). 43. Tung, P.-Y. et al. Batch effects and the effective design of single-cell gene expression studies. Scientific Reports7, 39921 (2017).
44. Tanay, A. & Regev, A. Scaling single-cell genomics from phenomenology to mechanism.
Nature541, 331-338 (2017).
45. Habib, N. et al. Div-Seq: Single-nucleus RNA-Seq reveals dynamics of rare adult newborn neurons. Science353, 925 (2016).
46. Lake, B.B. et al. Neuronal subtypes and diversity revealed by single-nucleus RNA sequencing of the human brain. Science (New York, N.Y.)352, 1586-1590 (2016).
47. Habib, N. et al. DroNc-Seq: Deciphering cell types in human archived brain tissues by massively-parallel single nucleus RNA-seq. bioRxiv (2017).
48. Wills, Q.F. et al. Single-cell gene expression analysis reveals genetic associations masked in whole-tissue experiments. Nat Biotech31, 748-752 (2013).
49. Dobin, A. et al. STAR: ultrafast universal RNA-seq aligner. Bioinformatics29, 15-21 (2013).
50. Wang, X., Spandidos, A., Wang, H. & Seed, B. PrimerBank: a PCR primer database for quantitative gene expression analysis, 2012 update. Nucleic Acids Research40, D1144-D1149 (2012).
51. Picelli, S. et al. Smart-seq2 for sensitive full-length transcriptome profiling in single cells.
Nat Meth10, 1096-1098 (2013).
52. Picelli, S. et al. Full-length RNA-seq from single cells using Smart-seq2. Nat. Protocols
9, 171-181 (2014).
53. Satija, R., Farrell, J.A., Gennert, D., Schier, A.F. & Regev, A. Spatial reconstruction of single-cell gene expression data. Nat Biotech33, 495-502 (2015).
54. Anders, S. & Huber, W. Differential expression analysis for sequence count data.
Genome Biology11, R106 (2010).
55. Dabney, A., Storey, J.D. & Warnes, G.R. qvalue: Q-value estimation for false discovery rate control. R package version1 (2010).
56. Falconer, D.S., Mackay, T.F. & Frankham, R. Introduction to quantitative genetics (4th edn). Trends in Genetics12, 280 (1996).
57. Loh, P.R., Palamara, P.F. & Price, A.L. Fast and accurate long-range phasing in a UK Biobank cohort. Nat Genet48, 811-816 (2016).
58. Shabalin, A.A. Matrix eQTL: ultra fast eQTL analysis via large matrix operations.
Chapter 3: Multiplexed RNA-sequencing of 1M immune cells reveals the cellular, molecular, and genetic correlates of systemic lupus erythematosus.
Introduction
The approach described in Chapter 2 enables the large-scale profiling of disease cohorts in efficient and cost-effective manner. Chapter 3 highlights the biological insights that can be gained from applying this method to a disease cohort. In this chapter, we study Systemic Lupus Erythematosus using our mutliplexed single cell sequencing workflow and demuxlet, profiling 120 lupus cases and 46 healthy controls.
Systemic lupus erythematosus (SLE) is a systemic autoimmune disease that disproportionately affects women1 and is characterized by a broad range of manifestations across multiple organs2.
Molecular analyses have implicated the production of autoantibodies, dysregulation of antigen presentation and lymphocyte signaling3,4, activation of the interferon signaling pathway3,4, and
failure of apoptotic clearance as hallmarks of the disease5,6. Many genes that participate in these
immunological processes are proximal to the ~100 genetic variants thus far associated with SLE7. However, while these results implicate multiple immune pathways in SLE3,8, mapping the
cell types and states underlying the pathogenesis of the disease remains incomplete and annotating the molecular function of disease-associated variants remains challenging.
Historically, separate approaches have been used to characterize changes in cell composition and state in SLE. Flow cytometry analysis that estimates composition based on known cell surface markers has reported frequency changes of circulating immune populations9,10. Bulk peripheral
blood gene expression analyses with or without sorting for specific subsets have found elevated levels of interferon signaling with pleiotropic effects across immune cell types3,4,11. However,
flow cytometry relies on the initial set of markers (and thus biased by prior knowledge) and bulk expression averages across diverse cells between and within types. Moreover, neither can
simultaneously measure the frequencies and activation states of cell types or capture
heterogeneity within sorted populations. Additionally, it is challenging to apply both methods at scale across the large cohorts necessary to detect subtle shifts in cell composition and gene expression caused by disease or disease-associated variants.
Massively parallel single-cell RNA-sequencing (scRNA-seq) holds enormous potential as a comprehensive approach to simultaneously estimate the composition and characterize the state of circulating immune cells. When integrated with dense genotyping data, there is a further
opportunity to ascribe molecular functionality to disease-associated variants across a number of cellular contexts. However, profiling large population cohorts using scRNA-seq has been limited by sample throughput and susceptibility to technical and biological variability. To overcome these limitations, we recently described a sample multiplexing approach that leverages single nucleotide polymorphisms (SNPs) to enable systematic and cost-effective profiling of 104 cells
from 10-100genetically distinct samples in one microfluidic reaction12.
Here, we used multiplexed single cell sequencing to profile ~1 million peripheral blood mononuclear cells (PBMCs) isolated from 58 healthy controls and 136 SLE patients of Asian and European ancestry, including patients experiencing active disease flares. We analyzed this rich dataset to define changes in cellular composition, cell-type-specific gene expression, and
immune repertoire in cases. To place our findings in the context of the known molecular signatures of SLE, we estimated the contribution of cellular composition and cell-type-specific expression to inter-individual expression variability calculated over aggregated PBMCs, hereinafter pseudobulk. We further explored the contribution of genetics to interindividual variability by mapping common genetic variants associated with gene expression (eQTLs) across 8 immune cell types, identifying eQTLs whose effects are modified by cell-type identity and interferon activation. Finally, we leveraged published genome-wide association studies (GWAS) summary statistics to annotate cell types that may mediate genetic associations in SLE and other autoimmune diseases. Our work demonstrates the power of single-cell RNA-seq as a compelling tool for quantitative high-dimensional immunological phenotyping of immunological disease.
Results
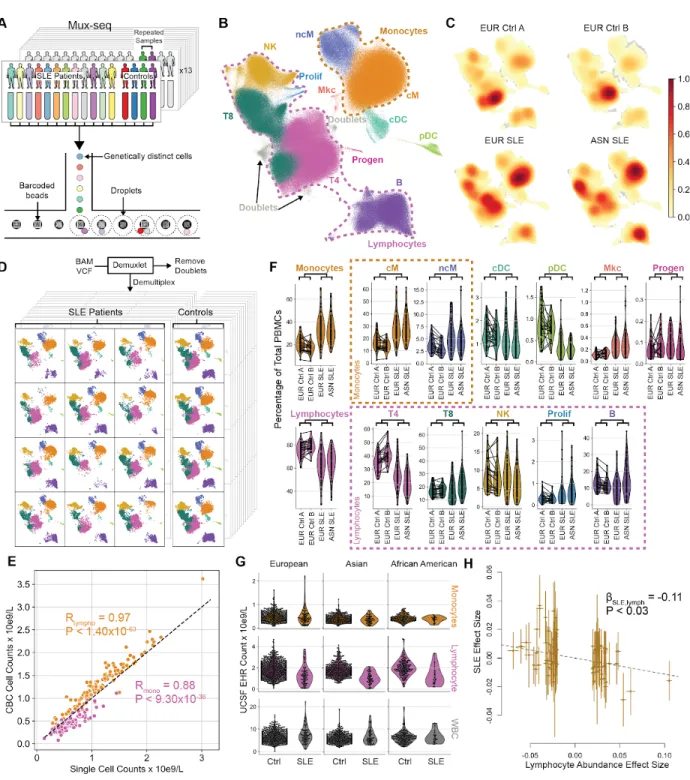
Changes in helper T cell composition causally associated with SLE
We generated a cross-sectional dataset of 834,096 cell profiles across 169 donors (119 cases from the California Lupus Epidemiology Study13 and 50 controls from the ImmVar
Consortium14–17). PBMCs were profiled using multiplexed single cell sequencing in 13 pools
each containing 16 donors12 (Fig. 3.1). A total of 1,134,700 cell-containing droplets were
sequenced to an average depth of 18,201 reads per droplet. 834,096 cells remained after quality control filtering and removal of droplets containing two cells using demuxlet12 (doublet rate
26.5%, expected 22-25%) resulting in 4,590 singlets (+/- 1,572) assigned to each donor (Supp. Fig. 1).
From the multiplexed single cell sequencing profiles, we estimated the composition of circulating immune cells per sample and assessed the robustness of the estimates. Following batch correction, normalization, principal component analysis, k-nearest neighbor graph
construction, and Leiden clustering (see Methods), we assigned each of 32 resulting clusters to 11 immune cell types based on known gene signatures including: classical (cM) and
non-classical monocytes (ncM), conventional (cDCs) and plasmacytoid dendritic cells (pDCs), CD4+
(T4) and CD8+ T cells (T8), natural killer cells (NK), B cells (B), proliferating lymphocytes
(Prolif), megakaryocytes (MK), and progenitor cells (Progen). Uniform Manifold Approximation and Projection (UMAP)18 revealed distinct regions of the embedding occupied by cells of
different types (Fig. 3.1) and to a lesser extent by cells from cases versus controls (Fig. 3.1). For each sample, we constructed a personalized projection and obtained highly reproducible
estimates of cell composition between biological replicates (Mean R2 = 0.81) (Fig. 3.1, Supp.
Fig. 2-3). Notably for 107 cases, estimates of monocyte (ncM+cM) and lymphocyte
(T4+T8+NK+B) abundances are extremely well correlated with those measured by automated white blood cell counts with differential reported in the UCSF Electronic Health Records (EHR) (Rmono = 0.88, P < 9.30x10-36, Rlympho= 0.97, P < 1.40x10-63, Fig. 3.1).
We used least squares regression weighted by the total number of cells per donor to quantify composition differences between cases and controls. Cases were marked by higher percentages of monocytes (cM: +10.7%, P < 1.68x10⁻⁸; ncM: +1.7%, P < 5.32x10⁻⁴, Linear Regression) and a
corresponding lower T4 percentage because composition estimates are relative (-13.3%, P < 1.78x10⁻¹³; R
cM.vs.T4 = -0.41) (Fig. 3.1, Supp. Fig. 4-5). Additionally, SLE patients have higher
percentages of ProlifT (+0.34%, 4.29x10⁻⁴), and a small but significant percentage of pDCs
(-0.55%, P < 5.16x10⁻²⁴) consistent with most reports19. No significant effects of treatment on
composition were detected in patients currently receiving mycophenolate mofetil, hydroxychloroquine, or oral steroids (Supp. Fig. 6), consistent with reports that suggest mycophenolate mofetil has no effect on white blood cells20 and prednisone has only transient
effects on CD4+ T cells21,22.
A higher ratio of monocytes to T4 cells could be due to mutually antagonistic regulation of myeloid versus lymphoid lineages during hematopoiesis or the enrichment or depletion of one lineage. Analysis of lymphocyte and monocyte abundances reported in the EHR of an additional 117 cases and 1,688 matched controls found no difference in the abundance of monocytes but depletion of lymphocytes in cases (Caucasians: P < 8.00x10⁻⁹, African Americans: P < 1.81x10⁻⁵,
Asians: P < 1.66x10⁻¹⁴, Fig. 3.1). To assess if lymphocyte depletion is causative for disease, we
performed Mendelian randomization using Generalised Summary-data-based Mendelian Randomisation (GSMR)23 using summary statistics on SLE and blood composition traits from
the UK Biobank(Bycroft et al. 2018). The causal effect size of SLE-associated variants on disease status is negatively correlated with their effect sizes on lymphocyte (βSLE.lymph = -0.11, P
< 0.03; Fig. 3.1) but not monocyte abundances (Supp. Fig. 7). These results suggest that single cell sequencing can reliably detect broad changes in peripheral blood cell types and is concordant with other approaches to estimate cellular composition.
Composition accounts for more inter-individual expression variability in SLE
Bulk profiling of circulating immune cells have identified transcriptomic signatures linked to interferon signaling, lymphocyte activation, and cytolytic function in SLE4. However,
pinpointing the pathogenic cells underlying bulk transcriptional signatures may be confounded by the functional overlap and frequency variation of immune cell types. To identify expression changes across cell types in SLE, we computed pseudobulk PBMC or cell-type-specific profiles for each sample and identified 141 differentially expressed (DE) genes in PBMCs and an
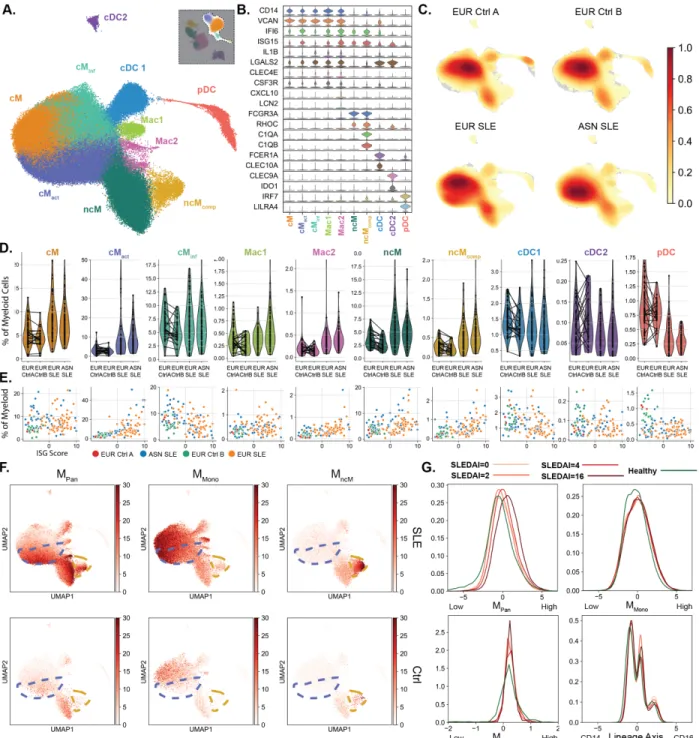
additional 57 in at least one of eight cell types between cases and controls (cM, ncM, cDC, pDC, T4, T8, NK, or B) (FDR < 0.01, abs(logFC) > 1; Supp. Table 1, Fig. 3.2,see Methods). The 198 DE genes clustered into 6 up-regulated and two down-regulated modules in SLE (Fig. 3.2,
Supp. Fig. 8). Down-regulated modules MpDC and MT4 are comprised of lineage-specific genes
reflective of the decrease in the frequencies of T4 (i.e. CCR7) and pDC (i.e. LILRA4). The up-regulated modules include MPan, enriched for interferon-stimulated genes (ISG) across all cell