DISCUSSION
PAPER
/ / M A X I M I L I A N B A C H / / N O . 1 9 - 0 5 9 | 1 2 / 2 0 1 9
Strategic Grade Retention
∗
Maximilian Bach
†November 2019
Abstract
Most school systems grant teachers and school principals considerable discretion in grade retention decisions. This paper argues that schools can exploit this discretion by selectively retaining students to reduce class size which potentially has important implications for public spending on education and affected students. To this end, I build a model in which class size is subject to a class size cap, with teachers and school principals determining the share of students to be retained. This leads to a set of empirical predictions that can be tested with minimal data requirements. Testing these predictions using administrative data for German primary schools yields strong evidence of schools strategically using grade retention to reduce class size.
Keywords: Grade retention; Class size; Incentives JEL Codes: I20, I28, I29
∗I benefited from helpful discussions with Bernd Fitzenberger, Felix Weinhardt, C. Katharina Spieß, Jan
Berkes, Jonas Jessen, Jan Marcus, Jeffrey Smith, Julia Schmieder, Ulrich Zierahn, Friedhelm Pfeiffer, as well as with audiences at ZEW Mannheim, DIW Berlin and IPN Kiel. I also thank the statistical office of Saxony for providing the data. The usual disclaimers apply.
1
Introduction
Grade retention is an important feature of many school systems around the world. According to PISA 2009, an average of 13 percent of 15-year-old students across OECD countries report having repeated a grade at least once (OECD, 2011). The primary intent of grade retention is to allow low-achieving students to catch up to grade-level requirements (Eurydice, 2011). But grade retention is also thought of as an incentive device that can increase study effort (Jacob, 2005). Yet, holding students back a grade comes at considerable costs. These include the public expenses for an additional year of education and the indirect costs for retained students in the form of potentially negative effects of retention, e.g. through a delayed labor market entry or reduced self-esteem.1 The OECD estimates that the financial resources
devoted to grade retention represent between 10 and 12 percent of total expenditures on primary and secondary education in Belgium, the Netherlands, Portugal, and Spain (and 4 to 10 percent in Brazil, Germany, Italy, and the US) (OECD, 2011). In the empirical literature consensus is lacking as to whether these costs outweigh the benefits of grade retention.2
While the net-benefits of grade retention remains a controversial topic in research and policy, it is generally taken for granted that teachers and school principals make retention decisions in an effort to help the affected student. In this paper, I challenge this prevailing view and explore a different motive for retaining students. More specifically, I analyze whether decisions to retain students are partly a result of strategic considerations by teachers and school principals to reduce class size. Shifting students across grades by retaining them allows schools to affect the size of their classes and it is well know that teachers generally
1Other harmful effects might arise from stigmatization, reduced expectations for academic performance on the part of teachers and parents, as well as the challenges of adjusting to a new peer group (Schwerdt et al., 2017).
2Recent studies with causal identification strategies include Jacob and Lefgren (2004, 2009); Manacorda (2012); Gary-Bobo et al. (2016); Fruehwirth et al. (2016); Eren et al. (2017); Schwerdt et al. (2017); Cockx et al. (2019). In contrast to earlier studies that did not take into account selection on unobservables, these studies generally find more positive short-run effects of grade retention. In the long run, however, effects on high school completion and test scores seem to be neutral or negative.
prefer smaller classes.3 School principals might prefer smaller classes largely because teachers
and parents have a preference for them. Rules that set school budgets as a function of the number of classes rather than total enrollment reinforce this preference. This paper examines if schools respond to these incentives by exploiting their discretion in grade retention decisions to minimize class size.
The paper is divided into two parts. The first part derives testable implications of strategic grade retention. To this end, I set up a model for retention decisions by teachers and school principals in a school system with maximum class size rules (or class size caps) where the number of classes changes whenever enrollment falls below or exceeds a particular threshold. In this setting, individual retention decisions can result in disproportionate class size changes for enrollment levels in the vicinity of the threshold. Based on this idea, I derive two testable implications. The first is an inverted-U relationship between end-of-year retention rates and current enrollment within two consecutive multiples of the class size cap, i.e. for enrollment levels with the same predicted number of classes. The inverted-U arises from the interaction of two effects: for enrollment just below (above) a multiple of the class size cap not retaining any students increases (decreases) the probability that the class is split (merged) in the next grade, thereby decreasing expected class size. However, retained students also leave their initial class. This class size reducing effect of grade retention dominates in medium sized classes with enrollment sufficiently above or below the class size cap where the probability for a change in the number of classes is low.
The second testable implication relates to the relationship between retention rates and enrollment in the grade below. To add another class or avoid having to merge classes for next year’s cohort, retention rates for the current cohort should increase as enrollment in the grade below gets closer to the class size cap. This results in an U-shaped relationship between retention rates and enrollment in the grade below for enrollment levels within two consecutive multiples of the class size cap.
3For example, reducing class size is the number one spending priority reported by teachers across the OCED (OECD, 2019).
In the second part of the paper, I test these implications with administrative data for all public primary schools in Saxony, a German federal state, for the school years 2004/2005 through 2014/2015. Consistent with strategic grade retention, I find support for both pre-dictions: There is a pronounced inverted-U relationship between retention rates and current enrollment as well as a U-shaped relationship between retention rates and enrollment in the grade below. These patterns also hold within rather than between schools and are strongest in first grade, where the potential for strategic manipulation and its benefits for schools are largest. In addition, the inverted-U relationship between retention rates and current enroll-ment does not hold in the last grade of primary school, where my model does not predict it. These findings reinforce my confidence that what I measure is indeed strategic grade retention rather than the result of student sorting at specific enrollment levels. Further-more, strategic grade retention is more pronounced when changing the number of retained students affects the probability of classes being merged rather than being split, a finding best accommodated by loss aversion.
Testing more formally for strategic grade retention yields that retention rates in grade 1 increased by more than 0.6 percentage points (27 percent) when this was expected to decrease next cohort’s class size. Students held back due to these strategic considerations are estimated to account for approximately 8.3 percent of all retained students in first grade. Conversely, first grade retention rates drop by more than 0.2 percentage points (9 percent) when retaining fewer students is expected to decrease class size in the next grade (when current enrollment is close to the class size cap). Without this strategic non-retention, the average retention rate in first grade would have been approximately 4.9 percent higher.
This paper makes two important contributions. To the best of my knowledge, it is the first to point out the role that class size considerations play in retention decisions and also demonstrates it empirically. From a policy perspective this can be important for two reasons. First, the manipulation of enrollment around class size caps through strategic grade retention results in the need to fund additional classes. Especially in primary schools, which are
generally small with relatively few classes,4 each additional class and the required teaching
staff substantially increases a school’s budget and thereby public spending on education. These practices also allocate a larger share of public resources to those schools which are willing to manipulate the class size rule. Second, grade retention itself is a costly policy affecting children in many school systems around the world. Rather than manipulating enrollment, it is reasonable to assume that school authorities would want to ensure that children are retained if and only if they can be expected to benefit from it. On the one hand to avoid the public and individual costs of retaining students who are unlikely to benefit from it, but also to ensure that students who potentially benefit from repeating a grade are indeed retained.
The second contribution is that the empirical predictions I derive allow researchers to test for strategic grade retention in many contexts. For instance, almost all European countries allow grade retention, and of those countries with explicit grade retention policies, all grant teachers and principals considerable discretion in grade retention decisions (Eurydice, 2011).5 Moreover, class size caps are used in most public school systems to form classes and determine school budgets. Testing my empirical predictions also does not require detailed student-level data or information on teachers, which are often unavailable to researchers. Instead, only school-grade-year level data on total enrollment, the number of classes, and number of grade repeaters is required. This information is typically recorded for administrative purposes and, hence, should be easily available to researchers.
This paper is most closely related to two studies that analyze how individual schools and school districts respond to maximum class size rules. The study by Urquiola and Verhoogen (2009) sets up a model for profit-maximizing schools that are subject to a class size cap. Their model predicts that schools at the class size cap adjust prices or enrollment to avoid
4There are on average only 1.76 classes per grade in Saxon primary schools and the corresponding number for the US is 2.89 (U.S. Department of Education, National Center for Education Statistics, Schools and Staffing Survey, 2007)
5The only two countries where, according to legislation, students progress to the next year automatically, regardless of academic performance are Iceland and Norway. The United Kingdom is another exception: There are no regulations on grade retention, but grade retention is virtually nonexistent.
adding an additional classroom. They find support for this prediction in data for Chilean private schools. Their findings are very different from mine, because, unlike the special case of Chile’s highly liberalized education system, I analyze public schools. These schools are almost exclusively financed through taxes, and therefore not only face very different incentives compared to private schools but are also the most common type of school. The second study by Cohen-Zada et al. (2013) investigates the public secondary school system in Israel, where schools have a per-student funding budget. They show that local school authorities selectively manipulate the maximum class-size rule in order to place weaker students in smaller classes.
My paper also contributes to the literature on several forms of strategic manipulation by schools and teachers. In early work, Jacob and Levitt (2003) provide evidence of a high prevalence of test score manipulation in Chicago elementary schools that responds strongly to relatively small changes in incentives for teachers. For the same schools, Jacob (2005) further shows that teachers responded to the introduction of high stakes testing by strategically increasing special education placements and preemptively retaining students. Outside of the United States, Angrist et al. (2018) finds that small classes increase test score manipulation in Southern Italy due to teachers shirking when they transcribe answer sheets. This paper demonstrates teacher and school manipulation to not only be limited to contexts where schools are held accountable for the performance of their students.
More generally, this paper relates to a vast literature on the principal-agent problem that studies how to design institutions in order to align the incentives of principals (6= school principals) and economic agents (see e.g., Fama, 1980; Laffont and Martimort, 2002). In the case of grade retention, school authorities, which are responsible for the allocation of funds across schools, act as principals. They must delegate grade retention decisions to teachers and school principals (the agents). A conflict in the objectives of agent and principal arises because individual schools prefer smaller classes (more resources) while school authorities must allocate funding across all schools according to certain objectives. This conflict is not
easily resolved since school authorities do not observe individual student ability, and hence, can not judge the validity of schools’ retention decisions.
The rest of the paper is organized as follows. The next section presents a stylized model of teacher’s and principal’s retention decisions and derives testable implications. Section 3 presents some institutional background on primary schools in Saxony. Section 4 describes the data used. Section 5 tests the model’s implications and Section 6 concludes.
2
The Model
Below I outline a highly stylized model of grade retention that illustrates how different incen-tives to retain students for teachers and school principals arise through class size thresholds. This yields a set of intuitive predictions that can be tested empirically. I tailor the model to the school system in Germany, where teachers typically follow the same class for several grades. However, it would be simple to expand the framework to other settings such as the US, where teachers typically remain at the the same grade level.
2.1
Teachers’ Decision to Retain Students
I start with teachers who are generally responsible for grading and recommending students for grade retention since they observe a student’s daily behavior. To simplify the exposition, consider a cohort in a particular school that is taught by the same teachers for two consec-utive periods: lower grade (L) and higher grade (H). This is consistent with many school systems where teachers follow the same class through multiple grades. A cohort consists of a continuum of students of mass SL in lower grade and class size in each grade is
deter-mined by a class size cap of Ψ according to the following formula, commonly referred to as “Maimonides Rule”: CSgt = Sgt ceil[Sgt Ψ ] (1)
integer greater than or equal to the given argument.
At the end of lower grade, teachers can choose the fraction of students to be retained in L (=λL). For concreteness, I assume that the fraction of retained students is subject to the
following constraint:
0≤λL≤π+πCSL ≤1 (2)
whereπ, π >0. The functional form of this constraint can be derived from an underlying process where class size negatively affects student achievement and teachers only retain students with academic skills below a certain threshold. This captures the idea that teachers have professional ethics and are expected to follow guidelines that prescribe only retaining students who can not be expected to perform to certain academic standards in the next grade.6
Even if no student is retained in lower grade, the number of students in a cohort is likely to change from lower to higher grade. For example, students can switch schools and retained students in higher grade stay in the same grade, joining next year’s cohort. I denote the mass of students that join or leave a cohort in higher grade by φ and assume that it follows a uniform distribution with E(φ) = 0 and density 1/2θ.7, 8 Here θ can be interpreted as the
maximum number of students that can be expected to join a cohort as it progresses to the next grade. Total enrollment in higher grade is then given by
SH = (1−λL)SL+φ (3)
6It also entails that teachers have to justify retention decisions to the school principal who sometimes even makes the final decision. To see why this might limit a teacher’s ability to retain students, note that principals should generally prefer lower retention rates because retained students also increase class size for the next cohort (who stays longer in school) if the number of classes does not change. In the next section, I study what the prospect of changing next cohort’s class size implies for school principals’ retention decision for the current cohort.
7Note thatφdoes not include the number of students who leave a cohort between lower and higher grade because they are retained in lower grade. However,φdoes include students from the previous cohort who were retained in higher grade (i.e. λHSH,t−1) as given.
8Making different distributional assumptions aboutφ yields identical predictions but comes with much added complexity.
and expected class size in higher grade, as a function of the fraction of retained students in lower grade, can be expressed as
E[CSH(λ)] =P (merge|λL)×E[CSH(λL)|merge]
+P (split|λL)×E[CSH(λL)|split]
+P (same|λL)×E[CSH(λL)|same]
(4)
where merge, split, and same denote a decrease, increase, or no change in the number of classes for a cohort from lower to higher grade, respectively.9
I abstract from all other determinants of teachers’ utility and assume that the problem facing teachers is to minimize class size in the higher grade by choosing the fraction of students to retain in lower grade. Because of the shockφ, teachers do not know the realization of SH when the retention decision is made. Therefore, they minimize expected class size in
higher grade
minimize
λL
E[CSH(λL)] (5)
subject to constraint (2).
With a slight abuse of notation, define bSLc and dSLe as multiples of the class size cap
Ψ satisfying
bSLc=xΨ< SL≤(x+ 1)Ψ =dSLe for x∈ {0,1, . . . , n} (6)
such that the interval
(bSLc,dSLe] (7)
delimits enrollment segments within which the number of classes is constant. I can then state the proposition that characterizes retention decisions of teachers.
9To avoid clutter, I do not write explicitly the dependence ofP(.|λ),CS
H(λL), andλL onSL,θ, andφ but this dependence should be understood.
Proposition 1 Either retention rates always increase monotonically with class size or there exist critical enrollment levels ST(θ) and ST(θ) such that
• For bSLc< SL≤ST(θ) it is optimal not to retain any students
• For ST(θ)< SL< S T
(θ)it is optimal to retain the maximum share of students possible and retention rates increases monotonically with class size
• For ST(θ)≤SL≤ dSLe it is optimal not to retain any students
The proof is in the Appendix. Proposition 1 states that within enrollment segments where the number of classes stays constant, there are critical lower and upper enrollment levels. For enrollment between these critical levels, teachers retain more students as enrollment increases. In schools with enrollment below (above) the lower (upper) critical level, however, no student should be retained. Importantly, these critical values are a function of θ, i.e. the number of students that can be expected to join or a leave a cohort between lower and higher grade irrespective of the teacher’s retention decisions.
The intuition for these critical levels is as follows. Consider the case of a cohort with enrollment below or equal to Ψ, which has only one class. For this cohort expected class size in higher grade is equal to
E[CSH(λL)] =P (split|λL)×E[CSH(λL)|split]
+P (same|λL)×E[CSH(λL)|same]
(8)
Regardless of the fraction of retained students, the probability for the class being split in the next grade is negligible if enrollment is sufficiently below the class size cap and expected class size in the next grade is simply E[CSH(λL)|same]. Since class size is reduced by
retaining more students if the number of classes stays the same (∂E[CSH(λL)|same]
∂λL < 0), it is thus optimal for teachers to retain as many students as possible. However, with enrollment moving closer to the class size cap, the probability of enrollment crossing the class size cap (which implies a class size reduction by approximately half its current size) becomes positive
and increases with fewer retained students (∂P(split|λL)
∂λL >0). At some point, the latter effect dominates the class size reducing effect of retaining more students. In order to increase the chances of enrollment crossing the class size cap next grade it is optimal not to retain any students. The intuition for the lower critical level (ST(θ)) is very similar and, therefore, omitted.
Proposition 1 is not directly testable because I do not observe the critical enrollment levels ST(θ) and ST(θ) for a particular school. But retention rates for enrollment above
ST(θ) and belowST(θ) are always predicted to be zero. Therefore, aggregating over schools with different values for θ (i.e. schools with more or less fluctuation in enrollment between grades) and, hence, different critical levels, yields the following testable implication:
Testable Implication 1 If teachers make retention decisions to minimize expected class
size, there is an inverted-U relationship between retention rates and current enrollment for enrollment levels within two consecutive multiples of the class size cap in grades lower than the last grade of primary school.
It is worth considering what my model predicts for grade retention in the final grade of primary school. In that case, teachers’ future class size is unaffected by their retention decisions as they will be assigned to a new first grade class next year. Hence, if teachers generally use grade retention as a remedial intervention to help poorly performing students and class size has a negative effect on student achievement, we should expect a monotonically positive relationship between the retention rate and enrollment within enrollment segments, but no inverted-U. This gives the second testable implication:
Testable Implication 2 If teachers make retention decisions to minimize their expected
class size, there is no inverted-U relationship between retention rates and enrollment within two consecutive multiples of the class size cap in the last grade of primary school.
So far I have mostly abstracted from the behavior of school principals, though their incentives not to retain students whenever current enrollment is close to the class size cap
are similar to those of teachers. Hence, the previous testable implications can also be shown to be consistent with strategic grade retention on the part of school principals.10 Implications
1 and 2, therefore, do not allow to test whether it is teachers or school principals who retain strategically. When discussing the empirical results, I will always refer to schools as acting strategically instead.
2.2
Principals’ Decision to Retain Students
While teachers are usually best equipped to judge the chances of students to be successful in the next grade, it is oftentimes school principals who make the final retention decision. In this section, I describe their optimization problem and the resulting testable implications for the relationship between retention rates and enrollment for the next year’s cohort. To fix ideas, assume that students again spend lower and higher grade in the same school. However, students can only be retained in the higher grade and, if not retained in higher grade, they leave the school at the end of the school year.11 Hence, I focus on the effect that retained
students in higher grades have on the class size for next year’s cohort in higher grade.12
Class size in higher grade is subject to the same maximum class size rule in (1). Let λH
denote the share of students who are retained in grade H at the end of school year t−1.
φ still captures the mass of students that join or leave a cohort between lower and higher grade (but now excludes retained students in higher grade). Total enrollment in the higher
10In contrast to teachers, however, showing this is complicated by the fact that school principals should also take into account the effect of retaining students for next year’s cohort (see the discussion in footnote 6). Hence, for enrollment levels where the probability for the current cohort’s class to be split or merged is negligible, it is not clear why school principals should retain any students. Assuming that they have a preference for retaining weak students or that teachers exert some pressure to retain students, however, yields testable implication 1.
11Here one can think of higher grade as the last grade in primary school.
12It is straightforward to include retention decisions in lower grades and allow students to spend more grades in the same school, but this would come at the cost of complexity that distracts from the main mechanism without additional insights.
grade in school year t is then given by
SH,t=SL,t−1+λHSH,t−1+φ (9)
The expected class size in the higher grade as a function of the fraction of retained students in the previous year can be expressed as
E[CSH,t(λ)] =P (merge|λH)×E[CSH,t(λH)|merge]
+P (split|λH)×E[CSH,t(λH)|split]
+P (same|λH)×E[CSH,t(λH)|same]
(10)
Similar to teachers, school principals only retain students with insufficient academic skills such that the share of retained students is subject to (2). In contrast to teachers, however, principals take into account the effect that grade retention has on next cohort’s class size. Thus, their optimization problem is
minimize
λH
E[CSH,t(λH)] (11)
Subject to constraint (2). Solving this problem then yields the following proposition
Proposition 2 Within a given grade level, retention rates are either a constant function
of next year’s enrollment or there exist critical enrollment levels for next year’s enrollment
SP(θ) and SP(θ) such that
• For bSLc< SL≤SP(θ)it is optimal to retain the maximum share of students possible.
• For SP(θ)< SL < S P
(θ) it is optimal not to retain any students
• For SP(θ)≤SL ≤ dSLe it is optimal to retain the maximum share of students possible
The proof is in the appendix. Similar to the first proposition, Proposition 2 states that, within enrollment segments where the number of classes stays constant, there exist critical
lower and upper enrollment levels. However, the predicted relationship between current retention rates and enrollment for next year’s cohort is exactly opposite to that between retention rates and current enrollment. For next year’s enrollment between these critical levels, principals have no incentive to retain any students. But for next year’s enrollment below (above) the lower (upper) critical level, principals have an incentive to retain as many students as possible. Again, these critical values are a function ofθ.
The intuition is as follows. Consider a school where enrollment in lower grade is just above Ψ with two classes. For this cohort the probability that enrollment will be larger than two times the class size cap in the next grade is equal to zero. Expected class size in higher grade is then given by
E[CSH(λ)] =P (merge|λH)×E[CSH(λH)|merge]
+P (same|λH)×E[CSH(λH)|same]
(12)
Regardless of the fraction of retained students in the previous year’s cohort, the proba-bility for the two classes being merged next grade is negligible if enrollment is sufficiently above the class size cap. Expected class size in the next grade is simplyE[CSH(λH)|same]
and class size increases with more retained students from the previous cohort joining the class in higher grade (∂E[CSH(λ)|same]
∂λ >0). Consequently, it is optimal for school principals
to not retain any students in the previous year. As enrollment decreases, the probability of enrollment falling below the class size cap next grade (which implies that class size is roughly doubled) becomes positive. However, the probability of this happening can be lowered by retaining more students in the previous year (∂P(merge|λH)
∂λH < 0). At some point, the latter effect dominates the effect that retained students increase the size of the receiving class. It becomes optimal to retain as many students as possible in order to increase the chances of enrollment staying above the class size cap next grade. The intuition for the upper critical level,SP(θ), is very similar and therefore omitted.
the following testable implication:
Testable Implication 3 If school principals make retention decisions to minimize expected
class size, there is a U-shaped relationship between current retention rates and next year’s enrollment for enrollment levels within two consecutive multiples of the class size cap.
Note that this model can easily be adopted to other school systems where teachers teach the same grade level (as in the US). Similar to school principals, teachers would in that case try to minimize next cohort’s class size, rather than next year’s class size of the current cohort. This results in the same prediction for the relationship between current retention rates and next year’s enrollment as in testable implication 3.
3
Institutional Context
To test the implications of my model, I focus the empirical analysis on Saxony, a German federal state. Generally, all federal states in Germany run their own educational systems, but states agree on some common standards such that many features are shared across states. This is especially true for primary education. As a result, most characteristics of primary schooling in Saxony are similar to all other German federal states.
Public primary schools are administered at the municipality level, but funded mostly by the state in Germany.13 Similar to most countries, school funding in Saxony is a function of
the number of classes in a grade. This number is determined by enrollment and maximum class size rules. For school years between 2004-05 and 2014-15, the maximum class size was set at 28 students (for ease of discussion I subsequently refer to an academic year by the calendar year in which it begins). Hence, whenever a class exceeded 28 students, a new class had to be formed. Furthermore, a lower limit for class size was set at 15 students.14 Noncompliance with the class size rule requires approval by the school ministry
13The state funds all personnel expenses which account for more than 80 percent of the school budget (Statistisches Bundesamt, 2018). Municipalities are responsible to fund material expenses.
and is generally limited to one school year.
Primary school in Saxony is obligatory, free of charge, and spans grades 1-4 with no explicit ability tracking.15 School entry is determined by a cut-off date set at June 30th.
Children turning six before this cut-off start school at the beginning of the same school year. Children born after the cut-off are enrolled in the next school year. However, children may be sent to school in the year before or after they become eligible depending on their maturity.16 Allocation of children to primary schools is determined by place of residence with little choice for parents, since primary schools have well-defined catchment areas that generally do not overlap. However, parents who are not satisfied with their assigned school have two options to change schools. First, they may send their child to a private school. In practice, however, very few parents resort to this option: private primary schools are extremely rare in Germany.17 The second option, sending the child to a different public school, is only
possible with the approval of the school principal and the Saxon School Ministry (S¨achsische Schulordnung, 2004). Importantly, class teachers generally follow the same class from first through the last grade in primary school.
A state wide promotion policy establishes that students have to repeat a grade in primary school if they fail any subject.18 However, this policy leaves teachers and school principles
with considerable room for discretion; grading is not based on standardized tests and students that apply to all primary schools. This is crucial as the class size limits in other federal states often depend on the student composition, with specific information on which exact class size threshold applies to each school not generally available. For example, in Saarland, the class size cap is a function of the number of students with insufficient German proficiency in a given grade, while in Hamburg the cap depends on the social index of the school’s catchment area.
15While Germany is known for early ability tracking, this happens only when students leave primary school after fourth grade and enroll at one of three different secondary schooling tracks (Gymnasium, Realschule, or Hauptschule) or for special needs students in primary school.
16Early school entry is possible upon parental request, subject to the school principal’s agreement. Prin-cipals base their assessment on the results of a medical- and in some cases a psychological examination of the child, in addition to discussion with the parents. Equally, principals may decide to defer school entry for another year.
17In 2006, there were only 624 of these schools which accounted for 3.7 percent of all primary schools in Germany (Autorengruppe Bildungsberichterstattung, 2016). Almost all of these schools were board-ing schools, religious schools, or schools offerboard-ing specialized pedagogic approaches, like Waldorf education (Cortina et al., 2008).
18Failing a subject amounts to scoring worse than a four (“ausreichend”) on a scale from one (“sehr gut”) to six (“ungen¨ugend”), where one is the best possible score.
who fail a subject can be exempted from repeating a grade under certain conditions. For example, a student failing one of the core subjects German, mathematics, or Sachunterricht (a mix of science and history) can be exempted from repeating a grade if her teacher expects the student to meet the academic requirements in the next grade based on her learning and working behavior.19 Additionally, it is not possible to fail first grade because students are
not yet graded. Still, students can be retained with parental approval if their teacher judges their proficiency in some subject to be insufficient and retention rates in primary school are highest in first grade. The decision of whether a student is retained or eligible for exemptions is made by the class council (i.e., the “Klassenkonferenz”) — a panel comprising the school principal and all the staff who teach a student’s class.
4
Data
I draw on administrative school records provided by the statistical office of Saxony to test my model’s implications. These data include enrollment, the number of classes, and the number of retained students on the school-grade-year level for all 818 public primary schools in Saxony between the 2004 and 2014 school years. Since all these variables are measured at the school-grade-year level, the terms retention rate and class size should always be understood as the respective school-grade-year average.
I impose three set of restrictions on these data. First, I drop all school-year observations with zero classes. These are schools that formed multi-grade classes, typically because en-rollment was too low to form separate classes for each grade. Second, I drop schools that serve as so-called dyslexic centers (“LRS-St¨utzpunkte”). These schools draw in all children diagnosed with a reading and writing disability (dyslexia) from the surrounding schools in grade three. Dyslexic children then spend two years in special classes in grade three before returning to their original school in grade four. These schools are excluded because class
for-19Other exemptions apply to students who have a selective achievement deficit (e.g. dyslexia), changed schools in the previous school year, or suffered from a long period of illness.
mation does not seem to be subject to the same class size rules that apply to regular schools. Third, all first grade observations for the year 2014 have to be excluded because next year’s enrollment needs to be observed for each school-grade-year observation. These restrictions result in 26 percent of the initial data being dropped. The final estimation sample includes 718 schools with 29,434 school-grade-year observations for a total of 1,033,940 student-grade observations.
Table 1 presents some descriptive statistics for my sample. The average class size is 19.90 and each school has an average 35.13 of students per grade. Grade repetition rates decrease in higher grades. Whereas 2.24 percent of all students are retained in first grade, only 0.77 percent repeat fourth grade.
[Table 1 about here]
In Table A.1 in the appendix, I investigate the dynamics of enrollment by calculating autocorrelations of enrollment in first grade. These vary from 0.79 to 0.88 indicating high enrollment persistence within schools (panel A of Table A.1). However, enrollment growth shows no persistence with all autocorrelations of an order larger than one being close to zero (panel B of Table A.1). Taken together, these two patterns are consistent with enrollment fluctuating randomly around a school’s average enrollment level without school-specific linear trends.20
To get a sense of the magnitude of enrollment variation within schools, panel A of Table 2 decomposes the variance of enrollment into total, between-, and within-school parts sepa-rately for each grade. Unsurprisingly, most of the variation in enrollment is between schools. Nevertheless, the within-school standard deviation is around 7, which amounts to more than 18% of the average enrollment level. This indicates substantial variation in first grade en-rollment within schools over time. Panel B further decomposes the within-school enen-rollment
20Formally, these results are consistent with the following data generating process for enrollment in first grade
Si1t=Si1+ei1t
whereSi1tis first grade enrollment at schooliin yeart;Si1 is a school specific intercept, andeitis an error term with no autocorrelation.
variation into between- and within-cohort parts. The latter measures the variation in cohort size as cohorts transition to the next higher grade, i.e. the variation in cohort size resulting from student movement due to grade retention or students changing schools. Comparing columns 3 and 4 shows that there is some within-cohort variation (with a SD between 1.31 and 1.85), but that it only makes up a small share of the total enrollment variation within schools. Further, student movement within-cohorts is largest between grades 2 and 3, most likely due to students transferring to dyslexic centers after grade 2.
[Table 2 about here]
These features of the data, within-school and within-cohort variation in enrollment, are important for the analysis below for two reasons. First, given the extent of within-school variation in enrollment, schools face different incentives to retain students over time. This allows to conduct some of the analyses below conditional on school fixed effects. Under the assumption that the student composition within schools stays constant over time, alternative explanations for the results from these school fixed effects models, such as sorting of students at specific enrollment levels, can be ruled out. Second, within-cohort changes between grade levels is a necessary condition for the testable implications derived above.21 Without the
possibility of students joining a class in higher grade, for example, teachers have no incentive to refrain from retaining students for enrollment levels just below the next closest multiple of the closest class size cap.22
21Recall the term φin (3) and (9), which denotes the number of students that join or leave a cohort in higher grade.
22Note that in this case the probability that enrollment in the next higher grade in the subsequent year will exceed the next closest larger multiple of the class size cap is zero and classes are never split in higher grade.
5
Results
5.1
Compliance with class size rules
Before testing for strategic grade retention, I document compliance with the class size rule in Saxon primary schools in Figure 1. The upper panel plots the average class size and rule based predictions against enrollment in grade 1. Actual class size follows the rule reasonably closely but the drops in actual class size at multiples of the class size cap are rounded as some classes are split before crossing the maximum class size of 28.
The lower panel of Figure 1 shows the distribution of enrollment with a one-student bin size. Vertical lines indicate the class size cutoffs. The data do not reveal any evidence for stacking at enrollments that are multiples of the maximum class size rule, limiting concerns about systematic sorting around the class size thresholds. Similar to what Argaw and Puhani (2018) document for the German state of Hesse, enrollment seems to follow a multimodal distribution with the density close to the thresholds being smaller than it is further away. This suggests that school catchment areas are designed to make it more likely that classes, once formed in first grade, can be continued in the following years. Figure 1 also shows that data for enrollment above 112 students are relatively sparse. In the appendix, I report the same figures for grades 2-4, which show very similar compliance with the class size rules and distributions of enrollment in higher grades.
[Figure 1 about here]
While Figure 1 demonstrates strong compliance with the class size rule in first grade, a necessary condition for the mechanism discussed in Section 2 to have any practical relevance requires schools to also comply with the rule dynamically, i.e. that the number of classes for a given cohort responds to changes in enrollment between grades. To test this, panel A of Table 3 reports the results from regressions of an indicator for whether a new class was added between two grades for the same cohort on an indicator for whether the addition of the
new class was predicted by the class size rule. The estimates for all grade levels are strongly significant suggesting that schools change existing classes between all grades according to the class size rule. However, the number of changes are substantially lower than what would be predicted for a school with perfect flexibility and compliance. For instance, in only about 41 percent of the cases where changes in enrollment should have prompted the addition of a new class between grade 1 and 2, was a new class actually formed. Panel B reports analogous results for the actual and predicted reduction of classes between two grades for the same cohort. Again, the results suggests that schools merge classes between all grades, but substantially less often than mandated by the class size rule.
[Table 3 about here]
5.2
Evidence for strategic grade retention
I now take my testable implications to the data. I review each implication and present empirical results.
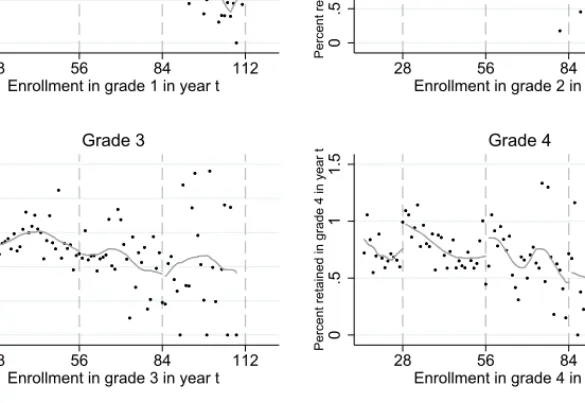
The first testable implication is that retention rates should be lower whenever enrollment is close to the class size cap in grades 1 through 3, but not in grade 4 (to ease discussion, I will refer to enrollment’s next closest class size cap as simply the class size cap). Figure 2 plots retention rates against enrollment for each grade, with the solid line plotting fitted values from a local polynomial regression within enrollment segments. A clear inverted-U relationship within enrollment segments is evident for grades 1 through 3. This is in accordance with fewer students being retained whenever enrollment is close to the class size cap. The pattern seems most pronounced in grade 1 and around the first two cutoffs, which account for the largest part of my data.23 Notably, no inverted-U pattern is evident in grade
4.
[Figure 2 about here]
A possible concern with this figure is that the drop in retention rates for enrollment levels just below the class size cap may reflect low compliance with the class size rule. Figure 1 shows that, for enrollment levels below the class size cap, classes are often split before reaching the maximum class size. The drop in retention rates could therefore, potentially be attributed to the positive effect of smaller classes on student achievement. To examine this possibility, Figure 3 plots average retention rates against class size. Retention rates for classes with 28 students in grades 1 and 29 students in grades 2-3 fall considerably below the fitted linear trend line. This suggests that the downward-sloping portion of the inverted-U pattern in Figure 2 does not just reflect lower retention rates because of smaller classes but could be explained by strategic grade retention.
[Figure 3 about here]
Next, I investigate whether retention decisions are made to influence next year’s class size in the same grade. Strategic behavior by school principals predicts that if next year’s enrollment is close to the class size cap, current retention rates should increase to push enrollment above the class size cap to trigger the formation of a new class or avoid the merging of classes. In contrast to the previous prediction this should also hold in grade 4. Figure 4, which plots current retention rates against next year’s enrollment, shows strong evidence of this. Since the patterns are very similar for all grades, I only show results pooled across grades.24 Within enrollment segments, there is clear evidence of a U-shaped pattern. Interestingly, apart from the upward sloping portion just below the next class size cap, retention rates appear to be declining in next year’s enrollment. This might stem from teacher retaining more students to place them in smaller classes next year. I investigate this pattern in more detail further below.
[Figure 4 about here]
A further concern with the figures above is that the observed patterns could be driven by systematic sorting of students into schools with different enrollment levels. This potential explanation is difficult to reconcile with the apparent opposite relationships observed between the retention rate with current and next year’s enrollment. However, to rule out sorting of students as a potential explanation, I next look at whether the observed patterns also hold within the same school, where the student composition can reasonably be assumed to stay constant.
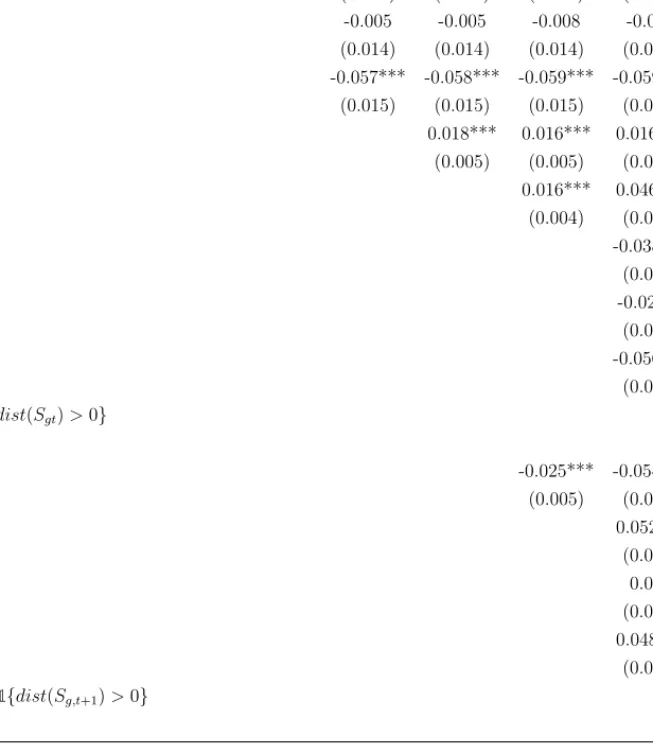
Table 4 reports the main results for strategic grade retention, where the implications are tested simultaneously. All presented results are based on regressions weighted by enrollment that control for grade and cohort fixed effects. Column 1 reports results from a simple re-gression of the retention rate on class size. The coefficient for class size is not statistically significant and small in magnitude. Once school fixed effects are controlled for in column 2, however, the coefficient increases more than sixfold and turns strongly statistically sig-nificant.25 A one-student increase in class size is associated with a 0.046 percentage point increase in the retention rate. The contrast between columns 1 and 2 suggests that differences in class size across schools are strongly related to the composition of students. Students who are more likely to be retained seem to attend schools with smaller classes. This is in line with previous research for Germany showing that school administrators use class size in a compensatory manner, whereby classes are generally smaller in schools with weaker students (Bach and Sievert, 2019, 2018).26 This demonstrates the importance of using variation in
enrollment and class size within rather than between schools, since the latter is likely related to the composition of students.
In the third column, the class size effect is allowed to differ across grades. Estimated effects in second and third grades do not differ statistically significantly from that in grade 1. They are smaller in magnitude but still statistically significantly larger than zero. The effect in the last grade of primary school, however, differs substantially from those in lower grades
25The results for the specifications in columns 3-7 without school fixed effects are reported in Table A.2. 26W¨oßmann and West (2006) show that this pattern also holds for many other countries.
and even reverses sign in specifications with additional controls. This is also confirmed by the graphical evidence in the lower right part of Figure 3. Since retaining a student in the last grade does not reduce her teacher’s class size next year, the absence of a positive effect of class size on retention rates is consistent with the notion that class size considerations matter in retention decisions. In turn, this suggests that the positive relationship between retention rates and class size observed in lower grades may not just result from lower student achievement in larger classes.
In column 4, an additionally control for differences in the size of the current class and the size of the class that a retained student enters next year (denoted by CSgt −CSg,t+1)
is included. The coefficient on this difference has a statistically significant negative sign and the coefficients for the current class size decrease somewhat.27 This suggests that the
coefficients in column 3 partly capture that students are retained more often when doing so places them in a smaller class next year, as this is more likely in larger classes. In line with the finding that class size in grade four has no effect on retention rates, this further cautions against attributing the positive effect of class size on retention rates in column 2 solely to the negative impact of class size on student achievement. Importantly, it also suggests that previous estimates of the effect of class size on retention rates are likely to overstate the negative impact of class size on student achievement (see e.g., Argaw and Puhani, 2018; Bach and Sievert, 2019; Gary-Bobo and Mahjoub, 2013).
[Table 4 about here]
To more directly test the hypothesis that schools use their discretion in retention decisions to minimize their expected class size, I include in column 5 the distance between current enrollment and the next closest positive multiple of the class size cap, denoted bydist(Sgt).28
27The estimated effect of the class size difference is very similar for specifications reported in columns 4-6. Only in column 7, where I additionally control for whether current and next year’s enrollment is above the closest multiple of the class size cap, does the effect disappear (see below for a detailed discussion of this specification). This is because the combination of these two variables is highly collinear withCSgt−CSg,t+1 as a result of the class size cap.
28Formallydist(S gt)≡ n |Sgt−xΨ| x∈N+, minx|Sgt−xΨ| o
The model predicts that retention rates should be lower for enrollment levels close to the class size cap because this minimizes (maximizes) the probability that classes are merged (split) in the next grade. In line with this prediction, the estimated coefficient for the distance between enrollment and the class size cap is significantly positive, implying fewer retained students in classes with enrollment levels closer to the class size cap.
According to my second prediction the distance to the class size cap should have different effects on retention rates across grades. In particular, there is no incentive to retain fewer students closer to the class size cap in the last grade of primary school because classes will be dissolved as students move to a secondary school after fourth grade. To test this, I allow the effect of current enrollment’s distance to the class size cap to differ by grade level in column 6. Consistent with the visual evidence in Figure 3, the pooled effect across grades in column 4 is mostly driven by the effect in grade 1. While the effects for grade 2 and 3 are statistically significantly smaller, they still indicate that more students are retained closer to the class size cap. Importantly, the sign of the effect is reversed in grade 4, thus providing further evidence that the observed patterns in lower grades stem from class size considerations. There are two potential explanations for why the effect is largest in grade 1. First, changes in class size right after grade 1 will be longer lasting compared to changes in higher grades. Hence, the incentive for teachers to strategically use grade retention should also be strongest in grade 1. Second, note that the inverted-U pattern is really a result of teachers not retaining students who they would otherwise retain if enrollment were not close the the class size cap. Since first grade students are not yet graded in Saxony, teachers’ discretion to not retain these weak students is also largest in grade 1.
The final testable implication for strategic grate retention concerns the relationship be-tween current retention rates in a given grade and enrollment in the subsequent year. If schools retain students to maximize the number of classes, thus minimizing class size, we should observe more retained students this year if enrollment in the next year in the same grade is close to the class size cap. To test this, I include in column 5 the distance between
next year’s enrollment and the class size cap. In column 6, the effect is allowed to differ across grades. The results are again supportive of strategic grade retention. The estimated effect in column 5 is positive and statistically significant. Column 6 reveals that this effect is mostly driven by grades 1 and 3. However, the effect is uniformly positive for all grades, albeit not statistically significantly. The most likely explanation for the strong effect in first grade is again that changing the number of classes earlier (i.e. right from the start) will result in more persistent reductions in class size. Furthermore, school principals might be more hesitant to split up or merge already existing classes because of the possibly perceived negative impact of breaking up peer relationships and expected resistance from parents. This might explain stronger manipulation of retention rates in first grade as this would affect the number of classes before they have been formed. The strong effect in grade 3 could follow a similar logic since some schools always form new classes after second grade. Hence, for these schools adding a new class in grade 3 comes at no cost, in terms of the perceived negative impacts of splitting up existing classes. Unfortunately, I cannot identify these schools in my data and no official statistics on the number of schools that (by default) form new classes after second grade are available.
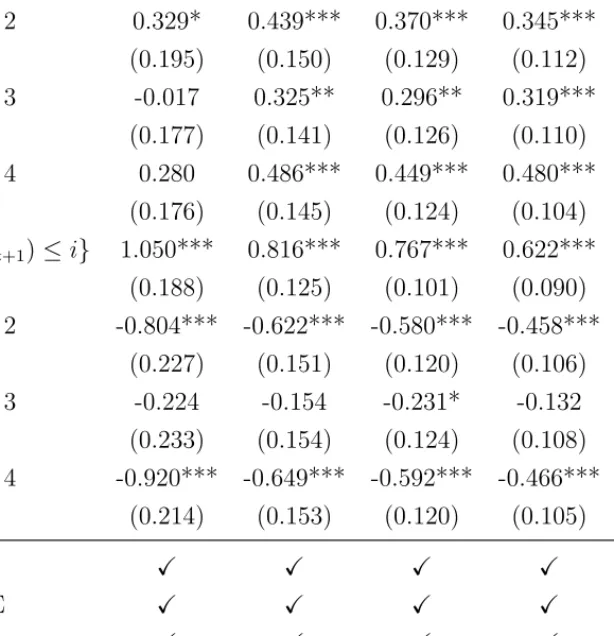
In the last column of Table 4, I further allow the distance effects to differ below and above the closest multiple of the class size cap. The coefficients for these interaction terms indicate that effects are not symmetric and substantially larger for enrollment levels where retention decisions affect the probability that classes are merged and hence the number of classes reduced next year (i.e. for dist(Sgt) >0 and dist(Sg,t+1) >0). This findings is best
accommodated by loss aversion (Kahneman and Tversky, 1979) in the sense that the threat of a reduction in the number of classes (and the associated increase in class size) provides a stronger incentive than a potential increase in the number of classes (and the associated decrease in class size). Reducing the number of classes often implies that some teachers are either assigned to a new class or have to switch schools. The latter is particularly likely to outweigh the perceived benefits for teachers and school principals of hiring a new teacher if
the number of classes is increased.
In Appendix A, I provide further visual evidence for the inverted-U relationship between retention rates and current enrollment as well as the U-shaped relationship between retention rates and next year’s enrollment even after controlling for school fixed effects and class size. To show this graphically, I estimated models similar to those reported in column 6 of Table 4 separately for each grade. However, I omitted the distance between current and next year’s enrollment to the class size cap, and instead included polynomials of varying degrees of normalized current and next year’s enrollment (see the figure notes for a detailed description of the procedure).29 Figures A.4 and A.5 plot predicted values based on the estimated
polynomial coefficients against normalized enrollment. In line with the regression results, the clearest evidence for an inverted-U relationship between grade retention and current enrollment is in grade 1. For the effect of next year’s enrollment, the U-shaped relationship is most pronounced in grades 1 and 3.
In summary, the reported patterns provide strong evidence that class size considerations affect retention decisions. To gain a better sense of the magnitude of these effects, I next replace the distance variables in Table 4 with an indicator variable, which takes on a value of one if the respective distance is smaller than a particular threshold. Since the choice of threshold is arbitrary, Table 5 presents estimates for five models with different thresholds (1-5). The coefficients on these threshold indicators suggests that between 0.2 to 0.4 percentage points (8.9 - 18 percent) fewer students are retained if current enrollment is close to the class size cap in grade 1. For next year’s enrollment, the magnitude of the implied effect is considerably larger and ranges from 0.6 to 1.1 percentage points. Relative to the average retention rate of 2.24 in first grade, this implies an increase in retained students in the range of 27-50 percent for next year’s enrollment levels close to the class size cap.
To further quantify these effects, I multiply the effects in the last column of Table 5 by the respective share of school-grade-year observations with enrollment levels within five
29Normalizing amounts to substracting the next lower multiple of the class size from enrollment to ensure that normalized enrollment lies between 1 and 28.
students of the class size cap. Diving this number by the grade-level specific retention rate provides a measure for the share of students whose retention decisions has been revised due to strategic considerations among all retained students. Table 6 reports the results of these back-of-the-envelop calculations. The point estimates suggest that without students who are strategically not retained, retention rates in first grade would be approximately 5 percent larger. Conversely, 8.3 percent of all retained students in grade 1 and 3 seem to have been retained to reduce class size.
[Table 5 about here]
Bach and Sievert (2019) point out that grade retention introduces spurious compositional effects in within-school comparisons that rely on variation in cohort size. The reason is that previously retained students mechanically make up a smaller share of students in larger cohorts. Since students in Saxon primary schools can be retained only once, this could bias any estimated effects of cohort size on retention rates.30 To see this, note that only students who have not been previously retained can potentially be retained in the future. As these students account for a larger share in larger cohorts, this results in a spurious positive effect of cohort size on retention rates. To rule out that any of my effects are driven by these mechanics, I perform an additional robustness check; instead of using the share of retained students among all students in a grade as the dependent variable, I use the fraction of retained students among the students who have not been retained before. This measure should be unaffected by the mechanical relationship between cohort size and retention rates. Tables A.3 and A.4 in the appendix present analogous results to those in Tables 4 and 5 using this alternative outcome variable. Reassuringly, the results remain almost unchanged. If at all, the effects on the distance variables become more pronounced while the coefficient for class size decreases slightly (as expected).
30If students fail a grade for a second time in primary school, they are generally classified as students with special needs and transferred to special-needs schools (i.e, “Sonderschulen”).
6
Conclusion
This paper derives a novel set of empirical predictions that allow researchers to test whether teachers and school principals strategically retain students to lower class size. These pre-dictions are based on differences in incentives to retain students that arise through class size caps. To test these predictions only requires commonly available data on total enroll-ment, the number of classes, and the number of grade repeaters at the school-grade-year level. These minimal data requirements should allow researchers to test for strategic grade retention in most school systems that allow for grade retention and form classes according to maximum class size rules.
Testing these predictions with 10 years of administrative data for all public primary schools in Saxony, I find strong evidence that class size considerations impact on retention decisions; within schools, retention rates in one cohort increase if this can trigger the forma-tion of a new class for the next cohort, and they drop if this increases the probability that current classes are split up or not merged next grade. Both results are consistent with grade retention decisions being made strategically to lower class size. These effects are strongest in first grade, where the potential for strategic manipulation and its benefits for schools are largest. My results suggest that approximately 8.3 percent of all held back students in grade 1 and 3 were retained to lower class size in the next cohort (i.e. push next year’s enrollment above the class size cap). In reverse, retention rates in first grade would have been approx-imately 4.9 percent higher if it were not for strategic non-retention of students in cohorts with enrollment close to the class size cap.
Importantly, these results likely understate the extent to which class size considerations matter for retention decisions. This study only identifies strategic grade retention for en-rollment levels close to the class size cap, where retention decisions can affect the number of classes. However, when teachers follow the same class for more than one grade, they always have an incentive to retain as many students as possible if this does not result in changing the number of classes. Further research is needed to investigate to what extent retention
decisions are driven by teachers’ concern for student achievement as opposed to the size of their class in these instances as well. This paper provides suggestive evidence for the latter; there is a reversal in the relationship between class size and retention rates between lower grades and the last grade of primary school which coincides with a change in the incentives for teachers to retain students. To further test these implications data on standardized test scores are needed.
Overall, this study underscores the need to understand educational interventions in the broader context of optimizing behavior by teachers and school principals who adapt to specific regulations. These strategic behaviors may or may not be in conflict with other pedagogical goals. In particular, my results inform the debate on the effectiveness of grade retention, by identifying potentially important unintended consequences of granting schools discretion in retention decisions. These can include an increase in school spending on ad-ditional classes, as well as the implications for students whose retention decision may be revised because of class size considerations. The latter seems a particularly promising topic for future research.
References
Angrist, J. D., Lavy, V., Leder-Luis, J., and Shany, A. (2018). Maimonides Rule Redux. NBER Working Papers 23486, National Bureau of Economic Research, Inc.
Argaw, B. A. and Puhani, P. A. (2018). Does class size matter for school tracking outcomes after elementary school? Quasi-experimental evidence using administrative panel data from Germany. Economics of Education Review, 65:48 – 57.
Autorengruppe Bildungsberichterstattung (2016). Bildung in Deutschland 2016.
Bach, M. and Sievert, S. (2018). Kleinere Grundschulklassen k¨onnen zu besseren Leistungen von Sch¨ulerInnen f¨uhren. DIW Wochenbericht, (22):465–472.
Bach, M. and Sievert, S. (2019). Birth Cohort Size Variation and the Estimation of Class Size Effects. Discussion Papers of DIW Berlin 1817, DIW Berlin, German Institute for Economic Research.
Cockx, B., Picchio, M., and Baert, S. (2019). Modeling the effects of grade retention in high school. Journal of Applied Econometrics, 34(3):403–424.
Cohen-Zada, D., Gradstein, M., and Reuven, E. (2013). Allocation of students in public schools: Theory and new evidence. Economics of Education Review, 34(C):96–106. Cortina, K. S., Baumert, J., Leschinsky, A., Mayer, K. U., and Trommer, L. (2008).
Das Bildungswesen in der Bundesrepublik Deutschland. Strukturen und Entwicklungen im ¨
uberblick. Rowohlt Taschenbuch.
Eren, O., Depew, B., and Barnes, S. (2017). Test-based promotion policies, dropping out, and juvenile crime. Journal of Public Economics, 153(C):9–31.
Eurydice (2011). Grade retention during compulsory education in Europe: Regulations and statistics . Technical report.
Fama, E. F. (1980). Agency problems and the theory of the firm. Journal of Political Economy, 88(2):288–307.
Fruehwirth, J. C., Navarro, S., and Takahashi, Y. (2016). How the timing of grade retention affects outcomes: Identification and estimation of time-varying treatment effects. Journal of Labor Economics, 34(4):979–1021.
Gary-Bobo, R. J. and Mahjoub, M.-B. (2013). Estimation of Class-Size Effects, Using Mai-monides’ Rule and Other Instruments: the Case of French Junior High Schools. Annals of Economics and Statistics, (111/112):193–225.
Gary-Bobo, R. J., Gouss´e, M., and Robin, J. (2016). Grade retention and unobserved heterogeneity. Quantitative Economics, 7(3):781–820.
Jacob, B. A. (2005). Accountability, incentives and behavior: the impact of high-stakes testing in the chicago public schools. Journal of Public Economics, 89(5):761 – 796.
Jacob, B. A. and Lefgren, L. (2004). Remedial education and student achievement: A regression-discontinuity analysis. The Review of Economics and Statistics, 86(1):226–244. Jacob, B. A. and Lefgren, L. (2009). The effect of grade retention on high school completion.
American Economic Journal: Applied Economics, 1(3):33–58.
Jacob, B. A. and Levitt, S. D. (2003). Rotten Apples: An Investigation of the Prevalence and Predictors of Teacher Cheating. The Quarterly Journal of Economics, 118(3):843–877. Kahneman, D. and Tversky, A. (1979). Prospect theory: An analysis of decision under risk.
Econometrica, 47(2):263–291.
Laffont, J.-J. and Martimort, D. (2002). The Theory of Incentives: The Principal-Agent Model. Princeton University Press.
Manacorda, M. (2012). The cost of grade retention. The Review of Economics and Statistics, 94(2):596–606.
OECD (2011). When students repeat grades or are transferred out of school: What does it mean for education systems? PISA in Focus, educational policy brief.
OECD (2019). TALIS 2018 Results (Volume I).
Schwerdt, G., West, M. R., and Winters, M. A. (2017). The effects of test-based retention on student outcomes over time: Regression discontinuity evidence from florida. Journal of Public Economics, 152:154 – 169.
Statistisches Bundesamt (2018). Bildungsausgaben Ausgaben je Sch¨ulerin und Sch¨uler 2015. Technical report, Statistisches Bundesamt (Destatis).
Urquiola, M. and Verhoogen, E. (2009). Class-Size Caps, Sorting, and the Regression-Discontinuity Design. American Economic Review, 99(1):179–215.
U.S. Department of Education, National Center for Education Statistics, Schools and Staffing Survey (2007). Public school teacher data file.
W¨oßmann, L. and West, M. (2006). Class-size effects in school systems around the world: Evidence from between-grade variation in TIMSS. European Economic Review, 50(3):695– 736.
Tables
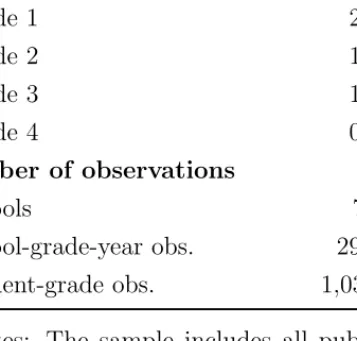
Table 1: Descriptive Statistics
Avg. classes per grade 1.76
Avg. students per grade 35.13
Avg. class size 19.97
Grade retention rates (in %)
Grade 1 2.24 Grade 2 1.73 Grade 3 1.38 Grade 4 0.77 Number of observations Schools 718 School-grade-year obs. 29,434 Student-grade obs. 1,033,940
Notes: The sample includes all public pri-mary schools in the state of Saxony for the 2004-2014 school years. Excluded are school-grade-year observations with zero classes and schools that serve as dyslexic centers.
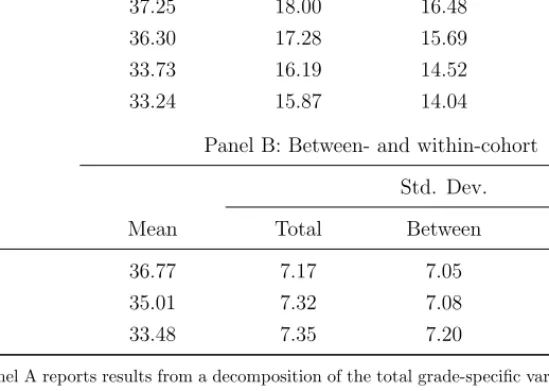
Table 2: Variance Decomposition of Enrollment
(1) (2) (3) (4)
Panel A: Between- and within-school Std. Dev.
Mean Total Between Within
Grade 1 37.25 18.00 16.48 7.07
Grade 2 36.30 17.28 15.69 7.13
Grade 3 33.73 16.19 14.52 7.14
Grade 4 33.24 15.87 14.04 7.45
Panel B: Between- and within-cohort Std. Dev.
Mean Total Between Within
Grades 1-2 36.77 7.17 7.05 1.31
Grades 2-3 35.01 7.32 7.08 1.85
Grades 3-4 33.48 7.35 7.20 1.45
Notes: Panel A reports results from a decomposition of the total grade-specific variance of enroll-ment into the parts of the variance within and between schools. Results are obtained using the relationship 1 Ng N X i=1 2014 X c=2001 (Sigc−S¯g)2= 1 Ng N X i=1 2014 X c=2001 (Sigc−S¯igc)2+ 1 Ng N X i=1 Cig( ¯Sig−S¯g)2 (i)
whereSis enrollment,i=,1,2, . . . , N is a school indicator,c= 2001,2002, . . . ,2014 is a cohort indicator, andg= 1,2,3,4 is a grade indicator. The variableNgis the total number of school-year observations for gradegandCig is the number of cohorts observed in gradegat schooli. Panel B reports results from a decomposition of the within-school variance of enrollment into the parts of the variance within and between cohorts. Results are obtained using the relationship
1 Pg+1 j=gNj N X i=1 2014 X c=2001 g+1 X j=g Sijc− Pg+1 j=gS¯ij 2 !2 =Pg+11 j=gNj N X i=1 2014 X c=2001 g+1 X j=g Sijc− Pg+1 j=gS¯ijc 2 !2 +Pg+11 j=gNj N X i=1 2014 X c=2001 Gic Pg+1 j=gSijc¯ 2 − Pg+1 j=gSij¯ 2 !2 (ii) whereGicis the number of grades cohortcis observed in at schooli.
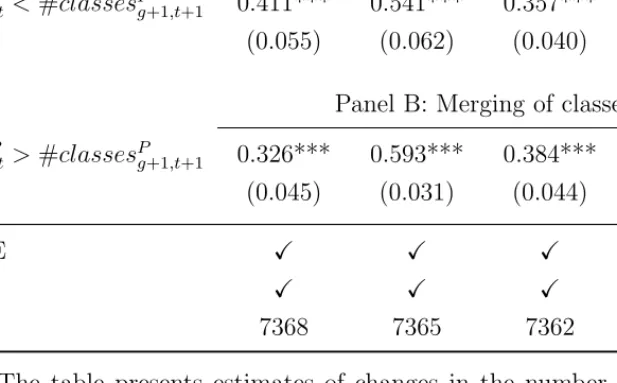
Table 3: Predicted and Actual Division/Merger of Classes
Grade 1-2 Grade 2-3 Grade 3-4 Grade 1-4
(1) (2) (3) (4)
Panel A: Division of classes
#classesPgt<#classesPg+1,t+1 0.411*** 0.541*** 0.357*** 0.600***
(0.055) (0.062) (0.040) (0.053)
Panel B: Merging of classes
#classesPgt>#classesPg+1,t+1 0.326*** 0.593*** 0.384*** 0.701***
(0.045) (0.031) (0.044) (0.027)
Cohort FE X X X X
School FE X X X X
N 7368 7365 7362 5942
Notes: The table presents estimates of changes in the number of classes in response to changes in the predicted number of classes for a given cohort. Observations are at the school-cohort-grade level and weighted by enrollment. The sample includes all public primary schools in the 2004 through 2014 school years in Saxony with at least one class. In panel A, the dependent variable is an indicator for whether a new class was added for a cohort between the grades indicated in the column header. In Panel B, the dependent variable is an indicator for whether a class was removed for a cohort between the grades indicated in the column header. #classesP
gt refers to the predicted number of
classes in grade g and school year t based on the class size rule. School and cohort fixed effects are included in all specifications. Robust standard errors clustered at the school level are reported in parentheses.