IMT Institute for Advanced Studies
Lucca, Italy
Big Data and the Web: Algorithms for
Data Intensive Scalable Computing
PhD Program in Computer Science and Engineering
XXIV Cycle
By
Gianmarco De Francisci Morales
2012
The dissertation of Gianmarco De Francisci Morales is
approved.
Program Coordinator: Prof. Rocco De Nicola, IMT Lucca
Supervisor: Dott. Claudio Lucchese, ISTI-CNR Pisa
Co-Supervisor: Dott. Ranieri Baraglia, ISTI-CNR Pisa
Tutor: Dott. Leonardo Badia, University of Padova
The dissertation of Gianmarco De Francisci Morales has been reviewed by:
Aristides Gionis, Yahoo! Research Barcelona
Iadh Ounis, University of Glasgow
IMT Institute for Advanced Studies, Lucca
2012
Where is the wisdom we
have lost in knowledge?
Where is the knowledge we
have lost in information?
To my mother, for her unconditional love and support throughout all these years.
Acknowledgements
I owe my deepest and earnest gratitude to my supervisor, Claudio Lucchese, who shepherded me towards this goal with great wisdom and everlasting patience.
I am grateful to all my co-authors, without whom this work would have been impossible. A separate acknowledgement goes to Aris Gionis for his precious advice, constant presence and exemplary guidance.
I thank all the friends and colleagues in Lucca with whom I shared the experience of being a Ph.D. student, my Lab in Pisa that accompanied me through this journey, and all the people in Barcelona that helped me feel like at home.
Contents
List of Figures xiii
List of Tables xv
Publications xvi
Abstract xviii
1 Introduction 1
1.1 The Data Deluge . . . 2
1.2 Mining the Web . . . 6
1.2.1 Taxonomy of Web data . . . 8
1.3 Management of Data . . . 10
1.3.1 Parallelism . . . 11
1.3.2 Data Intensive Scalable Computing . . . 14
1.4 Contributions . . . 16
2 Related Work 19 2.1 DISC systems . . . 20
2.2 MapReduce . . . 24
2.2.1 Computational Models and Extensions . . . 27
2.3 Streaming . . . 30
2.3.1 S4 . . . 31
3 SSJ 37
3.1 Introduction . . . 38
3.2 Problem definition and preliminaries . . . 40
3.3 Related work . . . 42
3.3.1 MapReduce Term-Filtering (ELSA) . . . 42
3.3.2 MapReduce Prefix-Filtering (VERN) . . . 44
3.4 SSJ Algorithms . . . 46
3.4.1 Double-Pass MapReduce Prefix-Filtering (SSJ-2) . . 46
3.4.2 Double-Pass MapReduce Prefix-Filtering with Re-mainder File (SSJ-2R) . . . 49 3.4.3 Partitioning . . . 52 3.5 Complexity analysis . . . 53 3.6 Experimental evaluation . . . 56 3.6.1 Running time . . . 57 3.6.2 Map phase . . . 59 3.6.3 Shuffle size . . . 62 3.6.4 Reduce phase . . . 63
3.6.5 Partitioning the remainder file . . . 65
3.7 Conclusions . . . 66 4 SCM 67 4.1 Introduction . . . 68 4.2 Related work . . . 71 4.3 Problem definition . . . 71 4.4 Application scenarios . . . 72 4.5 Algorithms . . . 74
4.5.1 Computing the set of candidate edges . . . 74
4.5.2 The STACKMR algorithm . . . 75
4.5.3 Adaptation in MapReduce . . . 81
4.5.4 The GREEDYMR algorithm . . . 84
4.5.5 Analysis of the GREEDYMR algorithm . . . 85
4.6 Experimental evaluation . . . 87
5 T.Rex 98
5.1 Introduction . . . 99
5.2 Related work . . . 104
5.3 Problem definition and model . . . 106
5.3.1 Entity popularity . . . 113 5.4 System overview . . . 116 5.5 Learning algorithm . . . 119 5.5.1 Constraint selection . . . 121 5.5.2 Additional features . . . 122 5.6 Experimental evaluation . . . 123 5.6.1 Datasets . . . 123 5.6.2 Test set . . . 125 5.6.3 Evaluation measures . . . 126 5.6.4 Baselines . . . 128 5.6.5 Results . . . 128 5.7 Conclusions . . . 130 6 Conclusions 131 A List of Acronyms 135 References 137
List of Figures
1.1 The petabyte age. . . 3
1.2 Data Information Knowledge Wisdom hierarchy. . . 4
1.3 Complexity of contributed algorithms. . . 17
2.1 DISC architecture. . . 20
2.2 Data flow in the MapReduce programming paradigm. . . . 26
2.3 Overview of S4. . . 32
2.4 Twitter hashtag counting in S4. . . 33
3.1 ELSAexample. . . 44
3.2 VERNexample. . . 46
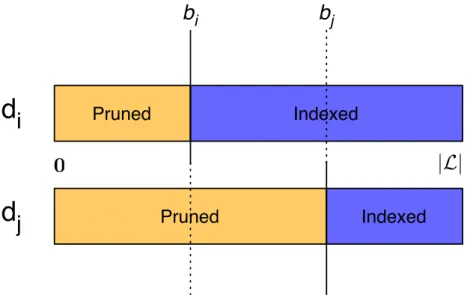
3.3 Pruned document pair: the left part (orange/light) has been pruned, the right part (blue/dark) has been indexed. 47 3.4 SSJ-2 example. . . 48
3.5 SSJ-2R example. . . 53
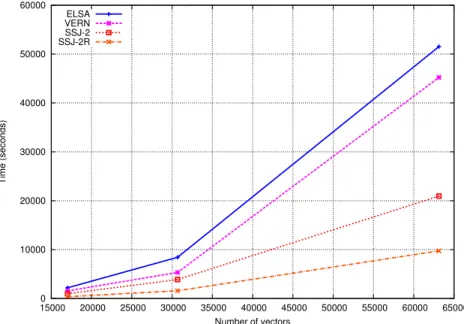
3.6 Running time. . . 58
3.7 Average mapper completion time. . . 59
3.8 Mapper completion time distribution. . . 60
3.9 Effect of Prefix-filtering on inverted list length distribution. 62 3.10 Shuffle size. . . 63
3.11 Average reducer completion time. . . 64
3.12 Remainder file and shuffle size varying K. . . 65
4.2 Communication pattern for iterative graph algorithms on
MR. . . 83
4.3 Distribution of edge similarities for the datasets. . . 88
4.4 Distribution of capacities for the three datasets. . . 89
4.5 flickr-smalldataset: matching value and number of iterations as a function of the number of edges. . . 92
4.6 flickr-largedataset: matching value and number of iterations as a function of the number of edges. . . 93
4.7 yahoo-answersdataset: matching value and number of iterations as a function of the number of edges. . . 94
4.8 Violation of capacities for STACKMR. . . 95
4.9 Normalized value of theb-matching achieved by the GREEDY -MR algorithm as a function of the number of MapReduce iterations. . . 96
5.1 Osama Bin Ladentrends on Twitter and news streams. . . . 101
5.2 Joplin tornadotrends on Twitter and news streams. . . 102
5.3 Cumulative Osama Bin Laden trends (news, Twitter and clicks). . . 113
5.4 News-click delay distribution. . . 114
5.5 Cumulative news-click delay distribution. . . 115
5.6 Overview of the T.REXsystem. . . 117
5.7 T.REXnews ranking dataflow. . . 119
5.8 Distribution of entities in Twitter. . . 123
5.9 Distribution of entities in news. . . 124
List of Tables
2.1 Major Data Intensive Scalable Computing (DISC) systems. 21 3.1 Symbols and quantities. . . 54 3.2 Complexity analysis. . . 54 3.3 Samples from the TREC WT10G collection. . . 57 3.4 Statistics for the four algorithms on the three datasets. . . . 61 4.1 Dataset characteristics.|T|: number of items;|C|: number
of users;|E|: total number of item-user pairs with non zero similarity. . . 91 5.1 Table of symbols. . . 107 5.2 MRR, precision and coverage. . . 128
Publications
1. G. De Francisci Morales, A. Gionis, C. Lucchese, “From Chatter to Head-lines: Harnessing the Real-Time Web for Personalized News Recommen-dations", WSDM’12, 5th ACM International Conference on Web Search and Data Mining, Seattle, 2012, pp. 153-162.
2. G. De Francisci Morales, A. Gionis, M. Sozio, “Social Content Matching in MapReduce”, PVLDB, Proceedings of the VLDB Endowment, 4(7):460-469, 2011.
3. R. Baraglia, G. De Francisci Morales, C. Lucchese, “Document Similarity Self-Join with MapReduce”, ICDM’10, 10th IEEE International Conference on Data Mining, Sydney, 2010, pp. 731-736.
4. G. De Francisci Morales, C. Lucchese, R. Baraglia, “Scaling Out All Pairs Similarity Search with MapReduce”, LSDS-IR’10, 8th Workshop on Large-Scale Distributed Systems for Information Retrieval, @SIGIR’10, Geneva, 2010, pp. 25-30.
5. G. De Francisci Morales, C. Lucchese, R. Baraglia, “Large-scale Data Anal-ysis on the Cloud”, XXIV Convegno Annuale del CMG-Italia, Roma, 2010.
Presentations
1. G. De Francisci Morales, “Harnessing the Real-Time Web for Personalized News Recommendation”, Yahoo! Labs, Sunnyvale, 16 Februrary 2012. 2. G. De Francisci Morales, “Big Data and the Web: Algorithms for Data
In-tensive Scalable Computing”, WSDM’12, Seattle, 8 Februrary 2012. 3. G. De Francisci Morales, “Social Content Matching in MapReduce”, Yahoo!
Research, Barcelona, 10 March 2011.
4. G. De Francisci Morales, “Cloud Computing for Large Scale Data Analy-sis”, Yahoo! Research, Barcelona, 2 December 2010.
5. G. De Francisci Morales, “Scaling Out All Pairs Similarity Search with MapReduce”, Summer School on Social Networks, Lipari, 6 July 2010. 6. G. De Francisci Morales, “How to Survive the Data Deluge: Petabyte Scale
Abstract
This thesis explores the problem of large scale Web mining by using Data Intensive Scalable Computing (DISC) systems. Web mining aims to extract useful information and models from data on the Web, the largest repository ever created. DISC systems are an emerging technology for processing huge datasets in parallel on large computer clusters.
Challenges arise from both themes of research. The Web is heterogeneous: data lives in various formats that are best modeled in different ways. Effectively extracting information requires careful design of algorithms for specific categories of data. The Web is huge, but DISC systems offer a platform for building scalable solutions. However, they provide restricted computing primitives for the sake of performance. Efficiently harnessing the power of parallelism offered by DISC systems involves rethinking traditional algorithms.
This thesis tackles three classical problems in Web mining. First we propose a novel solution to finding similar items in a bag of Web pages. Second we consider how to effectively distribute content from Web 2.0 to users via graph matching. Third we show how to harness the streams from the real-time Web to suggest news articles. Our main contribution lies in rethinking these problems in the context of massive scale Web mining, and in designing efficient MapReduce and streaming algorithms to solve these problems on DISC systems.
Chapter 1
Introduction
An incredible“data deluge”is currently drowning the world. Data sources are everywhere, from Web 2.0 and user-generated content to large scien-tific experiments, from social networks to wireless sensor networks. This massive amount of data is a valuable asset in our information society.
Data analysis is the process of inspecting data in order to extract useful information. Decision makers commonly use this information to drive their choices. The quality of the information extracted by this pro-cess greatly benefits from the availability of extensive datasets.
The Web is the biggest and fastest growing data repository in the world. Its size and diversity make it the ideal resource to mine for useful information. Data on the Web is very diverse in both content and format. Consequently, algorithms for Web mining need to take into account the specific characteristics of the data to be efficient.
As we enter the“petabyte age”, traditional approaches for data analy-sis begin to show their limits. Commonly available data analyanaly-sis tools are unable to keep up with the increase in size, diversity and rate of change of the Web. Data Intensive Scalable Computing is an emerging alterna-tive technology for large scale data analysis. DISC systems combine both storage and computing in a distributed and virtualized manner. These systems are built to scale to thousands of computers, and focus on fault tolerance, cost effectiveness and ease of use.
1.1
The Data Deluge
How would you sort 1GB of data? Today’s computers have enough memory to keep this quantity of data, so any optimal in-memory al-gorithm will suffice. What if you had to sort 100 GB of data? Even if systems with more than 100 GB of memory exist, they are by no means common or cheap. So the best solution is to use a disk based sorting al-gorithm. However, what if you had 10 TB of data to sort? At a transfer rate of about 100 MB/s for a normal disk it would take more than one day to make a single pass over the dataset. In this case the bandwidth between memory and disk is the bottleneck. In any case, today’s disks are usually 1 to 2 TB in size, which means that just to hold the data we need multiple disks. In order to obtain acceptable completion times, we also need to use multiple computers and a parallel algorithm.
This example illustrates a general point: the same problem at differ-ent scales needs radically differdiffer-ent solutions. In many cases we even need change the model we use to reason about the problem because the simplifying assumptions made by the models do not hold at every scale. Citing Box and Draper (1986) “Essentially, all models are wrong, but some are useful”, and arguably “most of them do not scale”.
Currently, an incredible “data deluge” is drowning the world. The amount of data we need to sift through every day is enormous. For in-stance the results of a search engine query are so many that we are not able to examine all of them, and indeed the competition now focuses the top ten results. This is just an example of a more general trend.
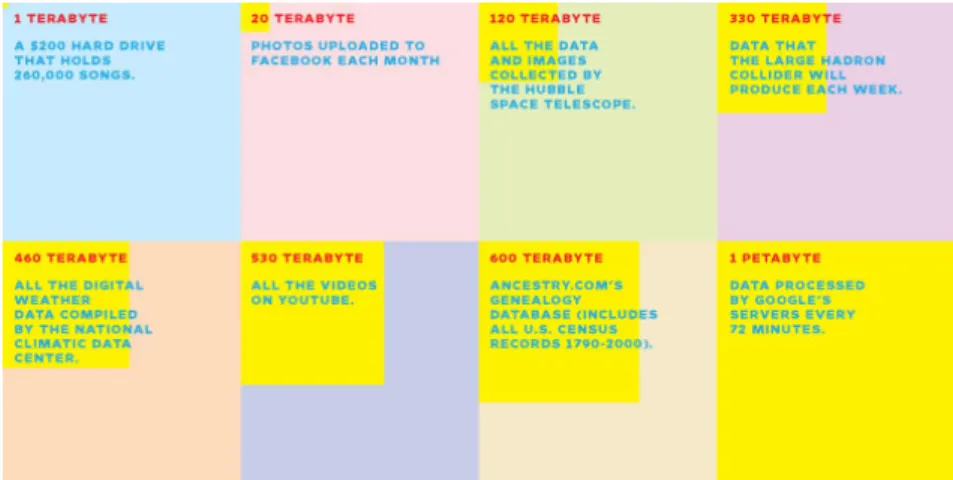
The issues raised by large datasets in the context of analytical ap-plications are becoming ever more important as we enter the so-called “petabyte age”. Figure 1.1 shows the sizes of the datasets for problems we currently face (Anderson, 2008). The datasets are orders of magni-tude greater than what fits on a single hard drive, and their management poses a serious challenge. Web companies are currently facing this issue, and striving to find efficient solutions. The ability to manage and ana-lyze more data is a distinct competitive advantage for them. This issue has been labeled in various ways: petabyte scale, Web scale or“big data”.
Figure 1.1:The petabyte age.
But how do we define“big data”? The definition is of course relative and evolves in time as technology progresses. Indeed, thirty years ago one terabyte would be considered enormous, while today we are com-monly dealing with such quantity of data.
Gartner (2011) puts the focus not only on size but on three different dimensions of growth for data, the 3V:Volume,VarietyandVelocity. The data is surely growing in size, but also in complexity as it shows up in different formats and from different sources that are hard to integrate, and in dynamicity as it arrives continuously, changes rapidly and needs to be processed as fast as possible.
Loukides (2010) offers a different point of view by saying that big data is “when the size of the data itself becomes part of the problem” and “traditional techniques for working with data run out of steam”.
Along the same lines, Jacobs (2009) states that big data is “data whose size forces us to look beyond the tried-and-true methods that are preva-lent at that time”. This means that we can callbigan amount of data that forces us to use or create innovative methodologies.
We can think that the intrinsic characteristics of the object to be an-alyzed demand modifications to traditional data managing procedures.
Understanding C o n n ec te d n es s Data Knowledge Wisdom Information Unde rstand Relati ons Unde rstand Patte rns Unde rstand Princ iples
Figure 1.2:Data Information Knowledge Wisdom hierarchy.
Alternatively, we can take the point of view of the subject who needs to manage the data. The emphasis is thus on user requirements such as throughput and latency. In either case, all the previous definitions hint to the fact that big data is a driver for research.
But why are we interested in data? It is common belief that data with-out a model is just noise. Models are used to describe salient features in the data, which can be extracted viadata mining. Figure 1.2 depicts the popular Data Information Knowledge Wisdom (DIKW) hierarchy (Row-ley, 2007). In this hierarchy data stands at the lowest level and bears the smallest level ofunderstanding. Data needs to be processed and con-densed into more connected forms in order to be useful for event com-prehension and decision making. Information, knowledge and wisdom are these forms of understanding. Relations and patterns that allow to gain deeper awareness of the process that generated the data, and prin-ciples that can guide future decisions.
For data mining, the scaling up of datasets is a“double edged”sword. On the one hand, it is an opportunity because“no data is like more data”. Deeper insights are possible when more data is available (Halevy et al., 2009). Oh the other hand, it is a challenge. Current methodologies are often not suitable to handle huge datasets, so new solutions are needed.
The large availability of data potentially enables more powerful anal-ysis and unexpected outcomes. For example, Google Flu Trends can detect regional flu outbreaks up to ten days faster than the Center for Disease Control and Prevention by analyzing the volume of flu-related queries to the Web search engine (Ginsberg et al., 2008). Companies like IBM and Google are using large scale data to solve extremely challeng-ing problems like avoidchalleng-ing traffic congestion, designchalleng-ing self-drivchalleng-ing cars or understandingJeopardyriddles (Loukides, 2011). Chapter 2 presents more examples of interesting large scale data analysis problems.
Data originates from a wide variety sources. Radio-Frequency Iden-tification (RFID) tags and Global Positioning System (GPS) receivers are already spread all around us. Sensors like these produce petabytes of data just as a result of their sheer numbers, thus starting the so called “industrial revolution of data”(Hellerstein, 2008).
Scientific experiments are also a huge data source. The Large Hadron Collider at CERN is expected to generate around 50 TB of raw data per day. The Hubble telescope captured millions of astronomical images, each weighting hundreds of megabytes. Computational biology experi-ments like high-throughput genome sequencing produce large quantities of data that require extensive post-processing.
The focus of our work is directed to another massive source of data: the Web. The importance of the Web from the scientific, economical and political point of view has grown dramatically over the last ten years, so much that internet access has been declared a human right by the United Nations (La Rue, 2011). Web users produce vast amounts of text, audio and video contents in the Web 2.0. Relationships and tags in social net-works create massive graphs spanning millions of vertexes and billions of edges. In the next section we highlight some of the opportunities and challenges found when mining the Web.
1.2
Mining the Web
The Web is easily the single largest publicly accessible data source in the world (Liu, 2007). The continuous usage of the Web has accelerated its growth. People and companies keep adding to the already enormous mass of pages already present.
In the last decade the Web has increased its importance to the point of becoming the center of our digital lives (Hammersley, 2011). People shop and read news on the Web, governments offer public services through it and enterprises develop Web marketing strategies. Investments in Web advertising have surpassed the ones in television and newspaper in most countries. This is a clear testament to the importance of the Web.
The estimated size of the indexable Web was at least 11.5 billion pages as of January 2005 (Gulli and Signorini, 2005). Today, the Web size is estimated between 50 and 100 billion pages and roughly doubling every eight months (Baeza-Yates and Ribeiro-Neto, 2011), faster than Moore’s law. Furthermore, the Web has become infinite for practical purpose, as it is possible to generate an infinite number of dynamic pages. As a result, there is on the Web an abundance of data with growing value.
The value of this data lies in being representative of collective user behavior. It is ourdigital footprint. By analyzing a large amount of these traces it is possible to find common patterns, extract user models, make better predictions, build smarter products and gain a better understand-ing of the dynamics of human behavior. Enterprises have started to re-alize on which gold mine they are sitting on. Companies like Facebook and Twitter base their business model entirely on collecting user data.
Data on the Web is often produced as a byproduct of online activity of the users, and is sometimes referred to asdata exhaust. This data is silently collected while the users are pursuing their own goal online, e.g. query logs from search engines, co-buying and co-visiting statistics from online shops, click through rates from news and advertisings, and so on. This process of collecting data automatically can scale much further than traditional methods like polls and surveys. For example it is possi-ble to monitor public interest and public opinion by analyzing collective
click behavior in news portals, references and sentiments in blogs and micro-blogs or query terms in search engines.
As another example, Yahoo! and Facebook (2011) are currently repli-cating the famous “small world” experiment ideated by Milgram. They are leveraging the social network created by Facebook users to test the “six degrees of separation” hypothesis on a planetary scale. The large number of users allows to address the critiques of selection and non-response bias made to the original experiment.
Let us now more precisely define Web mining. Web mining is the ap-plication of data mining techniques to discover patterns from the Web. According to the target of the analysis at hand, Web mining can be cat-egoryzed into three different types: Web structure mining, Web content mining and Web usage mining (Liu, 2007).
Web structure mining mines the hyperlink structure of the Web using graph theory. For example, links are used by search engines to find important Web pages, or in social networks to discover communi-ties of users who share common interests.
Web content mining analyzes Web page contents. Web content mining differs from traditional data and text mining mainly because of the semi-structured and multimedial nature of Web pages. For exam-ple, it is possible to automatically classify and cluster Web pages according to their topics but it is also possible to mine customer product reviews to discover consumer sentiments.
Web usage mining extracts information from user access patterns found in Web server logs, which record the pages visited by each user, and from search patterns found in query logs, which record the terms searched by each user. Web usage mining investigates what users are interested in on the Web.
Mining the Web is typically deemed highly promising and rewarding. However, it is by no means an easy task and there is a flip side of the coin: data found on the Web is extremely noisy.
The noise comes from two main sources. First, Web pages are com-plex and contain many pieces of information, e.g., the main content of the page, links, advertisements, images and scripts. For a particular ap-plication, only part of the information is useful and the rest is consid-ered noise. Second, the Web is open to anyone and does not enforce any quality control of information. Consequently a large amount of informa-tion on the Web is of low quality, erroneous, or even misleading, e.g., automatically generated spam, content farms and dangling links. This applies also to Web server logs and Web search engine logs, where er-ratic behaviors, automatic crawling, spelling mistakes, spam queries and attacks introduce a large amount of noise.
The signal, i.e. the useful part of the information, is often buried un-der a pile of dirty, noisy and unrelated data. It is the duty of a data ana-lyst to“separate the wheat from the chaff”by using sophisticated cleaning, pre-processing and mining techniques.
This challenge is further complicated by the sheer size of the data. Datasets coming from the Web are too large to handle using traditional systems. Storing, moving and managing them are complex tasks by themselves. For this reason a data analyst needs the help of powerful yet easy to use systems that abstract away the complex machinery needed to deliver the required performance. The goal of these systems is to re-duce the time-to-insight by speeding up the design-prototype-test cycle in order to test a larger number of hypothesis, as detailed in Section 1.3.
1.2.1
Taxonomy of Web data
The Web is a very diverse place. It is an open platform where anybody can add his own contribution. Resultingly, information on the Web is heterogeneous. Almost any kind of information can be found on it, usu-ally reproduced in a proliferation of different formats. As a consequence, the categories of data available on the Web are quite varied.
Data of all kinds exist on the Web: semi-structured Web pages, struc-tured tables, unstrucstruc-tured texts, explicit and implicit links, and multime-dia files (images, audios, and videos) just to name a few. A complete
classification of the categories of data on the Web is out of the scope of this thesis. However, we present next what we consider to be the most common and representative categories, the ones on which we focus our attention. Most of the Web fits one of these three categories:
Bags are unordered collections of items. The Web can be seen as a col-lections of documents when ignoring hyperlinks. Web sites that collect one specific kind of items (e.g. flickr or YouTube) can also be modeled as bags. The items in the bag are typically represented as sets, multisets or vectors. Most classical problems like similarity, clustering and frequent itemset mining are defined over bags. Graphs are defined by a set of vertexes connected by a set of edges. The
Web link structure and social networks fit in this category. Graph are an extremely flexible data model as almost anything can be seen as a graph. They can also be generated from predicates on a set of items (e.g. similarity graph, query flow graph). Graph algorithms like PageRank, community detection and matching are commonly employed to solve problems in Web and social network mining. Streams are unbounded sequences of items ordered by time. Search
queries and click streams are traditional examples, but streams are generated as well by news portals, micro-blogging services and real-time Web sites like twitter and “status updates” on social net-works like Facebook, Google+ and LinkedIn. Differently from time series, Web streams are textual, multimedial or have rich metadata. Traditional stream mining problems are clustering, classification and estimation of frequency moments.
Each of these categories has its own characteristics and complexities. Bags of items include very large collections whose items can be analyzed independently in parallel. However this lack of structure can also com-plicate analysis as in the case of clustering and nearest neighbor search, where each item can be related to any other item in the bag.
In contrast, graphs have a well defined structure that limits the cal relationships that need to be taken into account. For this reason lo-cal properties like degree distribution and clustering coefficient are very
easy to compute. However global properties such as diameter and girth generally require more complex iterative algorithms.
Finally, streams get continuously produced and a large part of their value is in their freshness. As such, they cannot be analyzed in batches and need to be processed as fast as possible in an online fashion.
For the reasons just described, the algorithms and the methodologies needed to analyze each category of data are quite different from each other. As detailed in Section 1.4, in this work we present three different algorithms for large scale data analysis, each one explicitly tailored for one of these categories of data.
1.3
Management of Data
Providing data for analysis is a problem that has been extensively stud-ied. Many solutions exist but the traditional approach is to employ a Database Management System (DBMS) to store and manage the data.
Modern DBMS originate in the ’70s, when Codd (1970) introduced the famousrelational model that is still in use today. The model intro-duces the familiar concepts of tabular data, relation, normalization, pri-mary key, relational algebra and so on.
The original purpose of DBMSs was to process transactions in busi-ness oriented processes, also known as Online Transaction Processing (OLTP). Queries were written in Structured Query Language (SQL) and run against data modeled in relational style. On the other hand, cur-rently DBMSs are used in a wide range of different areas: besides OLTP, we have Online Analysis Processing (OLAP) applications like data ware-housing and business intelligence, stream processing with continuous queries, text databases and much more (Stonebraker and Çetintemel, 2005). Furthermore, stored procedures are preferred over plain SQL for performance reasons. Given the shift and diversification of application fields, it is not a surprise that most existing DBMSs fail to meet today’s high performance requirements (Stonebraker et al., 2007a,b).
High performance has always been a key issue in database research. There are usually two approaches to achieve it: vertical and
horizon-tal. The former is the simplest, and consists in adding resources (cores, memory, disks) to an existing system. If the resulting system is capable of taking advantage of the new resources it is said to scale up. The inherent limitation of this approach is that the single most powerful system avail-able on earth could not suffice. The latter approach is more complex, and consists in adding new separate systems in parallel. The multiple systems are treated as a single logical unit. If the system achieves higher performance it is said to scale out. However, the result is a parallel sys-tem with all the hard problems of concurrency.
1.3.1
Parallelism
Typical parallel systems are divided into three categories according to their architecture: shared memory, shared disk or shared nothing. In the first category we find Symmetric Multi-Processors (SMPs) and large parallel machines. In the second one we find rack based solutions like Storage Area Network (SAN) or Network Attached Storage (NAS). The last category includes large commodity clusters interconnected by a local network and is deemed to be the most scalable (Stonebraker, 1986).
Parallel Database Management Systems (PDBMSs) (DeWitt and Gray, 1992) are the result of these considerations. They attempt to achieve high performance by leveraging parallelism. Almost all the designs of PDBMSs use the same basic dataflow pattern for query processing and horizontal partitioning of the tables on a cluster of shared nothing ma-chines for data distribution (DeWitt et al., 1990).
Unfortunately, PDBMSs are very complex systems. They need fine tuning of many“knobs”and feature simplistic fault tolerance policies. In the end, they do not provide the user with adequate ease of installation and administration (the so called“one button”experience), and flexibility of use, e.g., poor support of User Defined Functions (UDFs).
To date, despite numerous claims about their scalability, PDBMSs have proven to be profitable only up to the tens or hundreds of nodes. It is legitimate to question whether this is the result of a fundamental theoretical problem in the parallel approach.
Parallelism has some well known limitations. Amdahl (1967) argued in favor of a single-processor approach to achieve high performance. In-deed, the famous“Amdahl’s law” states that the parallel speedup of a program is inherently limited by the inverse of his serial fraction, the non parallelizable part of the program. His law also defines the concept
ofstrong scalability, in which thetotalproblem size is fixed. Equation 1.1
specifies Amdahl’s law forN parallel processing units wherersandrp
are the serial and parallel fraction of the program (rs+rp= 1)
SpeedU p(N) = 1 rs+
rp
N
(1.1)
Nevertheless, parallelism has a theoretical justification. Gustafson (1988) re-evaluated Amdahl’s law using a different assumption, i.e. that the problem sizes increases with the computing units. In this case the problem sizeper unit is fixed. Under this assumption, the achievable speedup is almost linear, as expressed by Equation 1.2. In this caser0
s
andrp0 are the serial and parallel fraction measured on the parallel
sys-tem instead of the serial one. Equation 1.2 defines the concept ofscaled
speeduporweak scalability
SpeedU p(N) =r0s+r
0
p∗N =N+ (1−N)∗r
0
s (1.2)
Even though the two equations are mathematically equivalent (Shi, 1996), they make drastically different assumptions. In our case the size of the problem is large and ever growing. Hence it seems appropriate to adopt Gustafson’s point of view, which justifies the parallel approach.
Parallel computing has a long history. It has traditionally focused on“number crunching”. Common applications were tightly coupled and CPU intensive (e.g. large simulations or finite element analysis). Control-parallel programming interfaces like Message Passing Interface (MPI) or Parallel Virtual Machine (PVM) are still the de-facto standard in this area. These systems are notoriously hard to program. Fault tolerance is diffi-cult to achieve and scalability is an art. They require explicit control of parallelism and are called“the assembly language of parallel computing”.
In stark contrast with this legacy, a new class of parallel systems has emerged:cloud computing. Cloud systems focus on being scalable, fault tolerant, cost effective and easy to use.
Lately cloud computing has received a substantial amount of atten-tion from industry, academia and press. As a result, the term “cloud computing” has become a buzzword, overloaded with meanings. There is lack of consensus on what is and what is notcloud. Even simple client-server applications are sometimes included in the category (Creeger, 2009). The boundaries between similar technologies are fuzzy, so there is no clear distinction among grid, utility, cloud, and other kinds of comput-ing technologies. In spite of the many attempts to describe cloud com-puting (Mell and Grance, 2009), there is no widely accepted definition.
However, within cloud computing, there is a more cohesive subset of technologies which is geared towards data analysis. We refer to this subset as Data Intensive Scalable Computing (DISC) systems. These sys-tems are aimed mainly at I/O intensive tasks, are optimized for dealing with large amounts of data and use a data-parallel approach. An inter-esting feature is they are“dispersed”: computing and storage facilities are distributed, abstracted and intermixed. These systems attempt to move computation as close to data as possible because moving large quanti-ties of data is expensive. Finally, the burden of dealing with the issues caused by parallelism is removed from the programmer. This provides the programmer with ascale-agnosticprogramming model.
The data-parallel nature of DISC systems abstracts away many of the details of parallelism. This allows to design clean and elegant algorithms. DISC systems offer a limited interface that allows to make strong as-sumptions about user code. This abstraction is useful for performance optimization, but constrains the class of algorithms that can be run on these systems. In this sense, DISC systems are not general purpose com-puting systems, but are specialized in solving a specific class of problems. DISC systems are a natural alternative to PDBMSs when dealing with large scale data. As such, a fierce debate is currently taking place, both in industry and academy, on which is the best tool (Dean and S. Ghemawat, 2010; DeWitt and Stonebraker, 2008; Stonebraker et al., 2010).
1.3.2
Data Intensive Scalable Computing
Let us highlight some of the requirements for a system used to perform data intensive computing on large datasets. Given the effort to find a novel solution and the fact that data sizes are ever growing, this solution should be applicable for a long period of time. Thus the most important requirement a solution has to satisfy isscalability.
Scalability is defined as “the ability of a system to accept increased input volume without impacting the profits”. This means that the gains from the input increment should be proportional to the increment itself. This is a broad definition used also in other fields like economy. For a system to be fully scalable, the size of its input should not be a design parameter. Forcing the system designer to take into account all possible deployment sizes in order to cope with different input sizes leads to a scalable architecture without fundamental bottlenecks.
However, apart from scalability, there are other requirements for a large scale data intensive computing system. Real world systems cost money to build and operate. Companies attempt to find the most cost effective way of building a large system because it usually requires a sig-nificant money investment. Partial upgradability is an important money saving feature, and is more easily attained with a loosely coupled sys-tem. Operational costs like system administrators’ salaries account for a large share of the budget of IT departments. To be profitable, large scale systems must require as little human intervention as possible. Therefore
autonomicsystems are preferable, systems that are configuring,
self-tuning and self-healing. In this respectfault toleranceis a key property. Fault tolerance is “the property of a system to operate properly in spite of the failure of some of its components”. When dealing with a large number of systems, the probability that a disk breaks or a server crashes raises dramatically: it is the norm rather than the exception. A performance degradation is acceptable as long as the systems does not halt completely. A denial of service of a system has a negative economic impact, especially for Web-based companies. The goal of fault tolerance techniques is to create ahighly available system.
To summarize, a large scale data analysis system should be scalable, cost effective and fault tolerant.
To make our discussion more concrete we give some examples of DISC systems. A more detailed overview can be found in Chapter 2 while here we just quickly introduce the systems we use in our research. While other similar systems exist, we have chosen these systems be-cause of their availability as open source software and bebe-cause of their widespread adoption both in academia and in industry. These factors increase the reusability of the results of our research and the chances of having practical impact on real-world problems.
The systems we make use of in this work implement two different paradigms for processing massive datasets: MapReduce (MR) and stream-ing. MapReduce offers the capability to analyze massive amounts of stored data while streaming solutions are designed to process a mul-titude of updates every second. We provide a detailed descriptions of these paradigms in Chapter 2.
Hadoop1is a distributed computing framework that implements the
MapReduce paradigm(Dean and Ghemawat, 2004) together with a com-panion distributed file system called Hadoop Distributed File System (HDFS). Hadoop enables the distributed processing of huge datasets across clusters of commodity computers by means of a simple functional programming model.
A mention goes to Pig2, a high level framework for data manipulation that runs on top of Hadoop (Olston et al., 2008). Pig is a very useful tool for data exploration, pre-processing and cleaning.
Finally, S43is a distributed scalable stream processing engine (Neumeyer
et al., 2010). While still a young project, its potential lies in complement-ing Hadoop for stream processcomplement-ing.
1http://hadoop.apache.org 2http://pig.apache.org 3http://incubator.apache.org/s4
1.4
Contributions
DISC systems are an emerging technology in the data analysis field that can be used to capitalize on massive datasets coming from the Web. “There is no data like more data” is a famous motto that epitomizes the opportunity to extract significant information by exploiting very large volumes of data. Information represents a competitive advantage for actors operating in the information society, an advantage that is all the greater the sooner it is achieved. Therefore, in the limit online analytics will become an invaluable support for decision making.
To date, DISC systems have been successfully employed for batch processing, while their use for online analytics has not received much attention and is still an open area of research. Many data analysis algo-rithms spanning different application areas have been already proposed for DISC systems. So far, speedup and scalability results are encourag-ing. We give an overview of these algorithms in Chapter 2.
However, it is not clear in the research community which problems are a good match for DISC systems. More importantly, the ingredients and recipes for building a successful algorithm are still hidden. Design-ing efficient algorithms for these systems requires thinkDesign-ing at scale, care-fully taking into account the characteristics of input data, trading off communication and computing and addressing skew and load balanc-ing problems. Meetbalanc-ing these requirements on a system with restricted primitives is a challenging task and an area for research.
This thesis explores the landscape of algorithms for Web mining on DISC systems and provides theoretical and practical insights on algo-rithm design and performance optimization.
Our work builds on previous research in Data Mining, Information Retrieval and Machine Learning. The methodologies developed in these fields are essential to make sense of data on the Web. We also leverage Distributed Systems and Database research. The systems and techniques studied in these fields are the key to get an acceptable performance on Web-scale datasets.
Algorithm Structure Da ta C o m p le x ity MR-Iterative
MR-Optimized S4-Streaming & MR
Bags
Streams & Graphs
Graphs Social Content Matching Similarity Self-Join Personalized Online News Recommendation
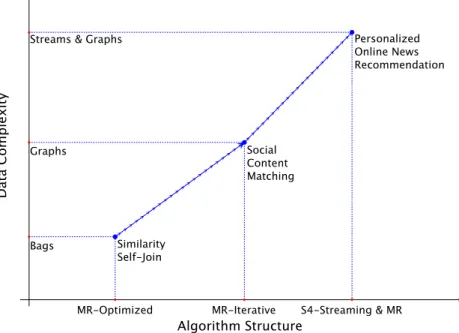
Figure 1.3:Complexity of contributed algorithms.
Concretely, our contributions can be mapped as shown in Figure 1.3. We tackle three different problems that involve Web mining tasks on dif-ferent categories of data. For each problem, we provide algorithms for Data Intensive Scalable Computing systems.
First, we tackle the problem of similarity on bags of Web documents in Chapter 3. We present SSJ-2 and SSJ-2R, two algorithms specifically designed for the MapReduce programming paradigm. These algorithms are batch oriented and operate in a fixed number of steps.
Second, we explore graph matching in Chapter 4. We propose an ap-plication of matching to distribution of content from social media and Web 2.0. We describe STACKMR and GREEDYMR, two iterative MapRe-duce algorithms with different performance and quality properties. Both algorithms provide approximation guarantees and scale to huge datasets.
Third, we investigate news recommendation for social network users in Chapter 5. We propose a solution that takes advantage of the real-time Web to provide personalized and real-timely suggestions. We present T.REX, a methodology that combines stream and graph processing and is amenable to parallelization on stream processing engines like S4.
To summarize, the main contribution of this thesis lies in addressing classical problems like similarity, matching and recommendation in the context of Web mining and in providing efficient and scalable solutions that harness the power of DISC systems. While pursuing this general objective we use some more specific goals as concrete stepping stones.
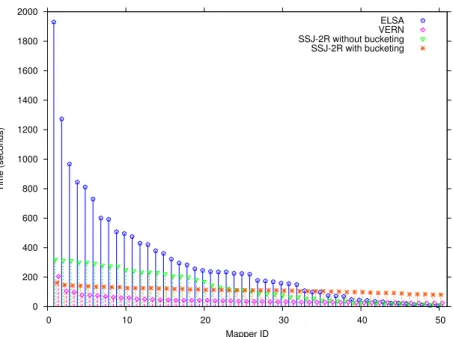
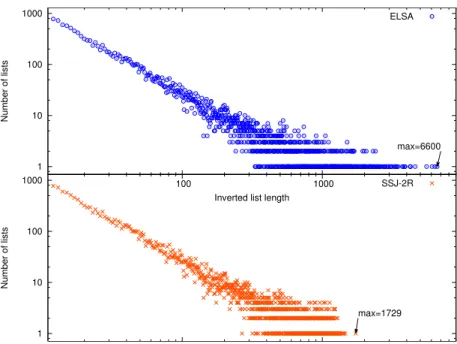
In Chapter 3 we show that carefully designing algorithms specifically for MapReduce gives substantial performance advantages over trivial parallelization. By leveraging efficient communication patterns SSJ-2R outperforms state-of-the-art algorithms for similarity join in MapReduce by almost five times. Designing efficient MapReduce algorithms requires rethinking classical algorithms rather than using them as black boxes. By applying this principle we provide scalable algorithms for exact similar-ity computation without any need to tradeoff precision for performance. In Chapter 4 we propose the first solution to the graph matching problem in MapReduce. STACKMR and GREEDYMR are two algorithms for graph matching with provable approximation guarantees and high practical value for large real-world systems. We further propose a gen-eral scalable computational pattern for iterative graph mining in MR. This pattern can support a variety of algorithms and we show how to apply it to the two aforementioned algorithms for graph matching.
Finally in Chapter 5 we describe a novel methodology that combines several signals from the real-time Web to predict user interest. T.REXis able to harnesses information extracted from user-generated content, so-cial circles and topic popularity to provide personalized and timely news suggestions. The proposed system combines offline iterative computa-tion on MapReduce and online processing of incoming data in a stream-ing fashion. This feature allows both to provide always fresh recommen-dations and to cope with the large amount of input data.
Chapter 2
Related Work
In this chapter we give an overview of related work in terms of systems, paradigms and algorithms for large scale Web mining.
We start by describing a general framework for DISC systems. Large scale data challenges have spurred the design of a multitude of new DISC systems. Here we review the most important ones and classify them ac-cording to our framework in a layered architecture. We further distin-guish between batch and online systems to underline their different tar-gets in the data and application spectrum. These tools compose the big data software stack used to tackle data intensive computing problems.
Then we offer a more detailed overview of the two most important paradigms for large scale Web mining: MapReduce and streaming. These two paradigms are able to cope with huge or even unbounded datasets. While MapReduce offers the capability to analyze massive amounts of stored data, streaming solutions offer the ability to process a multitude of updates per second with low latency.
Finally, we review some of the most influential algorithms for large scale Web mining on DISC systems. We focus mainly on MapReduce algorithms, which have received the largest share of attention. We show different kind of algorithms that have been proposed in the literature to process different types of data on the Web.
2.1
DISC systems
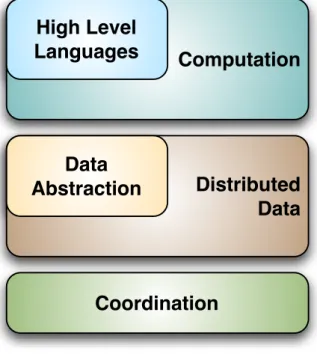
Even though existing DISC systems are very diverse, they share many common traits. For this reason we propose a general architecture of DISC systems, that captures the commonalities in the form of a multi-layered stack, as depicted in Figure 2.1. A complete DISC solution is usually devised by assembling multiple components. We classify the various components in three layers and two sublayers.
Coordination
Computation
High Level
Languages
Distributed
Data
Data
Abstraction
Figure 2.1:DISC architecture.
At the lowest level we find acoordinationlayer that serves as a basic building block for the distributed services higher in the stack. This layer deals with basic concurrency issues.
Thedistributed datalayer builds on top of the coordination one. This
dis-tributed file system it does not offer standard POSIX semantics for the sake of performance. Thedata abstractionlayer is still part of the data layer and offers different, more sophisticated interfaces to data.
Thecomputation layer is responsible for managing distributed
pro-cessing. As with the data layer, generality is sacrificed for performance. Only embarrassingly data parallel problems are commonly solvable in this framework. Thehigh level languages layer encompasses a number of languages, interfaces and systems that have been developed to sim-plify and enrich access to the computation layer.
Table 2.1:Major DISC systems.
Batch Online
High Level Languages Sawzall, SCOPE, Pig Latin, Hive, DryadLINQ, FlumeJava, Cascading, Crunch
Computation MapReduce, Hadoop, Dryad, Pregel, Giraph, Hama
S4, Storm, Akka
Data Abstraction BigTable, HBase,
PNUTS, Cassandra, Voldemort
Distributed Data GFS, HDFS, Cosmos Dynamo
Coordination Chubby, Zookeeper
Table 2.1 classifies some of the most popular DISC systems.
In the coordination layer we find two implementations of a consensus algorithm. Chubby (Burrows, 2006) is an implementation of Paxos (Lam-port, 1998) while Zookeeper (Hunt et al., 2010) implements ZAB (Reed and Junqueira, 2008). They are distributed services for maintaining con-figuration information, naming, providing distributed synchronization and group services. The main characteristics of these services are very high availability and reliability, thus sacrificing high performance.
On the next level, the distributed data layer presents different kinds of data storages. A common feature in this layer is to avoid full POSIX semantic in favor of simpler ones. Furthermore, consistency is somewhat relaxed for the sake of performance.
HDFS1, Google File System (GFS) (Ghemawat et al., 2003) and Cos-mos (Chaiken et al., 2008) are distributed file systems geared towards large batch processing. They are not general purpose file systems. For example, in HDFS files can only be appended but not modified and in GFS a record might get appended more than once (at least once seman-tics). They use large blocks of 64 MB or more, which are replicated for fault tolerance. Dynamo (DeCandia et al., 2007) is a low latency key-values store used at Amazon. It has a Peer-to-Peer (P2P) architecture that uses consistent hashing for load balancing and a gossiping protocol to guarantee eventual consistency (Vogels, 2008).
The systems described above are either mainly append-only and batch oriented file systems or simple key-value stores. However, it is sometime convenient to access data in a different way, e.g. by using richer data models or by employing read/write operations. Data abstractions built on top of the aforementioned systems serve these purposes.
BigTable (Chang et al., 2006) and HBase2are non-relational data stores. They are actually multidimensional, sparse, sorted maps designed for semi-structured or non structured data. They provide random, realtime read/write access to large amounts of data. Access to data is provided via primary key only, but each key can have more than one column. PNUTS (Cooper et al., 2008) is a similar storage service developed by Yahoo! that leverages geographic distribution and caching, but offers limited consistency guarantees. Cassandra (Lakshman and Malik, 2010) is an open source Apache project initially developed by Facebook. It fea-tures a BigTable-like interface on a Dynamo-style infrastructure. Volde-mort3is an open source non-relational database built by LinkedIn,
basi-cally a large persistent Distributed Hash Table (DHT).
1http://hadoop.apache.org/hdfs 2http://hbase.apache.org 3http://project-voldemort.com
In the computation layer we find paradigms for large scale data in-tensive computing. They are mainly dataflow paradigms with support for automated parallelization. We can recognize the same pattern found in previous layers also here: trade off generality for performance.
MapReduce (Dean and Ghemawat, 2004) is a distributed computing engine developed by Google, while Hadoop4is an open source clone. A
more detailed description of this framework is presented in Section 2.2. Dryad (Isard et al., 2007) is Microsoft’s alternative to MapReduce. Dryad is a distributed execution engine inspired by macro-dataflow techniques. Programs are specified by a Direct Acyclic Graph (DAG) whose ver-texes are operations and whose edges are data channels. The system takes care of scheduling, distribution, communication and execution on a cluster. Pregel (Malewicz et al., 2010), Giraph5 and Hama (Seo et al.,
2010) are systems that implement the Bulk Synchronous Parallel (BSP) model (Valiant, 1990). Pregel is a large scale graph processing system developed by Google. Giraph implements Pregel’s interface as a graph processing library that runs on top of Hadoop. Hama is a generic BSP framework for matrix processing.
S4 (Neumeyer et al., 2010) by Yahoo!, Storm6by Twitter and Akka7are
distributed stream processing engines that implement the Actor model (Agha, 1986) They target a different part of the spectrum of big data, namely online processing of high-speed and high-volume event streams. Inspired by MapReduce, they provide a way to scale out stream process-ing on a cluster by usprocess-ing simple functional components.
At the last level we find high level interfaces to these computing sys-tems. These interfaces are meant to simplify writing programs for DISC systems. Even though this task is easier than writing custom MPI code, DISC systems still offer fairly low level programming interfaces, which require the knowledge of a full programming language. The interfaces at this level allow even non programmers to perform large scale processing. Sawzall (Pike et al., 2005), SCOPE (Chaiken et al., 2008) and Pig Latin
4http://hadoop.apache.org
5http://incubator.apache.org/giraph 6https://github.com/nathanmarz/storm 7http://akka.io
(Olston et al., 2008) are special purpose scripting languages for MapRe-duce, Dryad and Hadoop. They are able to perform filtering, aggrega-tion, transformation and joining. They share many features with SQL but are easy to extend with UDFs. These tools are invaluable for data explo-ration and pre-processing. Hive (Thusoo et al., 2009) is a data warehous-ing system that runs on top of Hadoop and HDFS. It answers queries expressed in a SQL-like language calledHiveQL on data organized in tabular format. Flumejava (Chambers et al., 2010), DryadLINQ (Yu et al., 2008), Cascading8and Crunch9are native language integration libraries
for MapReduce, Dryad and Hadoop. They provide an interface to build pipelines of operators from traditional programming languages, run them on a DISC system and access results programmatically.
2.2
MapReduce
When dealing with large datasets like the ones coming from the Web, the costs of serial solutions are not acceptable. Furthermore, the size of the dataset and supporting structures (indexes, partial results, etc...) can easily outgrow the storage capabilities of a single node. The MapReduce paradigm (Dean and Ghemawat, 2004, 2008) is designed to deal with the huge amount of data that is readily available nowadays. MapReduce has gained increasing attention due to its adaptability to large clusters of computers and to the ease of developing highly parallel and fault-tolerant solutions. MR is expected to become the normal way to deal with massive datasets in the future (Rajaraman and Ullman, 2010).
MapReduce is a distributed computing paradigm inspired by con-cepts from functional languages. More specifically, it is based on two higher order functions: Map andReduce. The Mapfunction reads the input as a list of key-value pairs and applies a UDF to each pair. The result is a second list of intermediate key-value pairs. This list is sorted and grouped by key in theshufflephase, and used as input to theReduce
function. TheReducefunction applies a second UDF to each
intermedi-8http://www.cascading.org
ate key with all its associated values to produce the final result. The two phases are strictly non overlapping. The general signatures of the two phases of a MapReduce computation are as follows:
Map: hk1, v1i → [hk2, v2i] Reduce: hk2,[v2]i → [hk3, v3i]
TheMapandReducefunction are purely functional and thus without side effects. This property makes them easily parallelizable because each input key-value is independent from the other ones. Fault tolerance is also easily achieved by just re-executing the failed function instance.
MapReduce assumes a distributed file systems from which theMap
instances retrieve their input data. The framework takes care of mov-ing, grouping and sorting the intermediate data produced by the various mappers (tasks that execute theMapfunction) to the corresponding re-ducers (tasks that execute theReducefunction) .
The programming interface is easy to use and does not require any explicit control of parallelism. A MapReduce program is completely de-fined by the two UDFs run by mappers and reducers. Even though the paradigm is not general purpose, many interesting algorithms can be implemented on it. The most paradigmatic application is building an in-verted index for a Web search engine. Simplistically, the algorithm reads the crawled and filtered web documents from the file system, and for every word it emits the pairhword, doc_idiin theMapphase. The Re-ducephase simply groups all the document identifiers associated with the same wordhword,[doc_id1, doc_id2, . . .]ito create an inverted list.
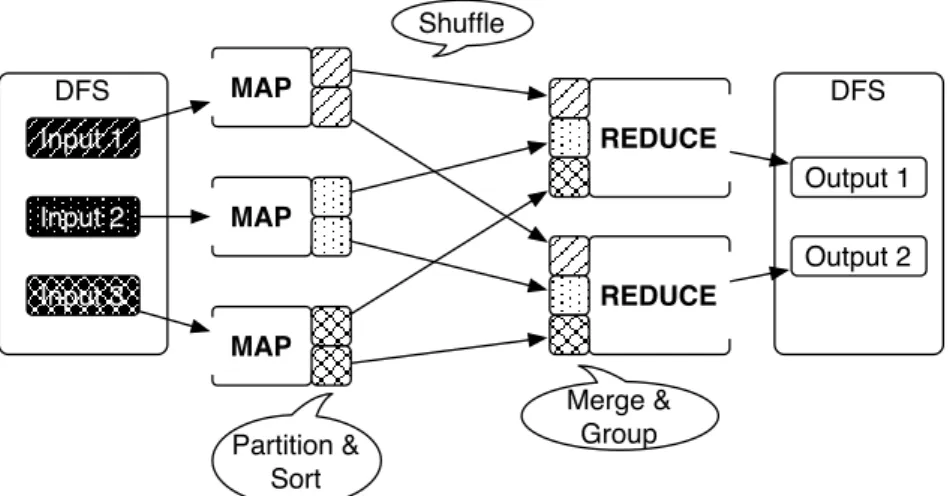
The MapReduce data flow is illustrated in Figure 2.2. The mappers read their data from the distributed file system. The file system is nor-mally co-located with the computing system so that most reads are local. Each mapper reads a split of the input, applies theMapfunction to the key-value pair and potentially produces one or more output pairs. Map-pers sort and write intermediate values on the local disk.
Each reducer in turn pulls the data from various remote locations. Intermediate key-value pairs are already partitioned and sorted by key by the mappers, so the reducer just merge-sorts the different partitions to
DFS Input 1 Input 2 Input 3 MAP MAP MAP REDUCE REDUCE DFS Output 1 Output 2 Shuffle Merge & Group Partition & Sort
Figure 2.2:Data flow in the MapReduce programming paradigm.
group the same keys together. This phase is calledshuffleand is the most expensive in terms of I/O operations. The shuffle phase can partially overlap with theMapphase. Indeed, intermediate results from mappers can start being transferred as soon as they are written to disk. In the last phase each reducer applies theReducefunction to the intermediate key-value pairs and write the final output to the file system.
MapReduce has become the de-fact standard for the development of large scale applications running on thousand of inexpensive machines, especially with the release of its open source implementation Hadoop.
Hadoop is an open source MapReduce implementation written in Java. Hadoop also provides a distributed file system called HDFS, used as a source and sink for MapReduce jobs. Data is split in chunks, dis-tributed and replicated among the nodes and stored on local disks. MR and HDFS daemons run on the same nodes, so the framework knows which node contains the data. Great emphasis is placed on data locality. The scheduler tries to run mappers on the same nodes that hold the input data in order to reduce network traffic during theMapphase.
2.2.1
Computational Models and Extensions
A few computational models for MapReduce have been proposed. Afrati and Ullman (2009) propose an I/O cost model that captures the essential features of many DISC systems. The key assumptions of the model are:
• Filesare replicated sets of records stored on a distributed file
sys-tem with a very large block sizeband can be read and written in parallel by processes;
• Processesare the conventional unit of computation but have limits
on I/O: a lower limit ofb(the block size) and an upper limit ofs, a quantity that can represent the available main memory;
• Processors are the computing nodes, with a CPU, main memory
and secondary storage, and are available in infinite supply.
The authors present various algorithms for multiway join and sort-ing, and analyze the communication and processing costs for these ex-amples. Differently from standard MR, an algorithm in this model is a DAG of processes, in a way similar to Dryad. Additionally, the model as-sumes that keys are not delivered in sorted order to the Reduce. Because of these departures from the traditional MR paradigm, the model is not appropriate to compare real-world algorithms developed for Hadoop.
Karloff et al. (2010) propose a novel theoretical model of computation for MapReduce. The authors formally define theMapandReduce func-tions and the steps of a MR algorithm. Then they proceed to define a new algorithmic class: MRCi. An algorithm in this class is composed by a finite sequence ofMapandReducerounds with some limitations. Given an input of sizen:
• eachMaporReduceis implemented by a random access machine that uses sub-linear space and polynomial time inn;
• the total size of the output of eachMapis less than quadratic inn;
The model makes a number of assumptions on the underlying infras-tructure to derive the definition. The number of available processors is assumed to be sub-linear. This restriction guarantees that algorithms in
MRCare practical. Each processor has a sub-linear amount of memory. Given that theReducephase can not begin until all the Maps are done, the intermediate results must be stored temporarily in memory. This explains the space limit on theMapoutput which is given by the total memory available across all the machines. The authors give examples of algorithms for graph and string problems. The result of their analysis is an algorithmic design technique forMRC.
A number of extensions to the base MR system have been developed. Many of these works focus on extending MR towards the database area. Yang et al. (2007) propose an extension to MR in order to simplify the implementation of relational operators. More specifically they target the implementation of join, complex, multi-table select and set operations. The normal MR workflow is extended with a third finalMergephase. This function takes as input two different key-value pair lists and outputs a third key-value pair list. The model assumes that the output of the
Reducefunction is fed to theMerge. The signature are as follows.
Map: hk1, v1iα → [hk2, v2i]α
Reduce: hk2,[v2]iα → hk2,[v3]iα Merge: h hk2,[v3]iα,hk3,[v4]iβi → [hk4, v5i]γ
whereα,β,γrepresentdata lineages. The lineage is used to distinguish the source of the data, a necessary feature for joins.
The signatures for theReduce function in this extension is slightly different from the one in traditional MR. TheMergefunction requires its input to be organized in partitions. For this reason theReducefunction passes along the keyk2received from theMapto the next phase without
modifying it. The presence ofk2guarantees that the two inputs of the Mergefunction can be matched by key.
The implementation of theMergephase is quite complex so we refer the reader to the original paper for a detailed description. The proposed framework is efficient even though complex for the user. To implement a single join algorithm the programmer needs to write up to five different functions for theMergephase only. Moreover, the system exposes many internal details that pollute the clean functional interface of MR.
The other main area of extension is adapting MR for online analytics. This modification would give substantial benefits in adapting to changes, and the ability to process stream data. Hadoop Online Prototype (HOP) is a proposal to address this issue (Condie et al., 2009). The authors modify Hadoop in order to pipeline data between operators, and to sup-port online aggregation and continuous queries. In HOP a downstream dataflow element can begin consuming data before a producer element has completed its execution. Hence HOP can generate and refine an ap-proximate answer by using online aggregation (Hellerstein et al., 1997). Pipelining also enables to push data as it comes inside a running job, which in turn enables stream processing and continuous queries.
To implement pipelining, mappers push data to reducers as soon as it is ready. The pushed data is treated as tentative to retain fault tolerance, and discarded in case of failure. Online aggregation is performed by ap-plying theReducefunction to all the pipelined data received so far. The result is a snapshot of the computation and is saved on HDFS. Continu-ous MR jobs are implemented by using both pipelining and aggregation on data streams, by reducing a sliding window of mappers output.
HOP presents several shortcomings because of hybrid model. Pipelin-ing is only possible between mappers and reducers in one job. Online aggregation recomputes the snapshot from scratch each time, consum-ing computconsum-ing and storage resources. Stream processconsum-ing can only be performed on a window because of fault tolerance. Anyway reducers do not process the data continuously but are invoked periodically. HOP tries to transform MapReduce from a batch system to an online system by reducing the batch size and addressing the ensuing inefficiencies.
HStreaming10also provides stream processing on top of Hadoop. 10http://www.hstreaming.com
2.3
Streaming
Streaming is an fundamental model for computations on massive datasets (Alon et al., 1999; Henzinger et al., 1998). In the traditional streaming model we are allowed only a constant number of passes on the data and poly-logarithmic space in the size of the inputn. In the semi-streaming model, we are allowed a logarithmic number of passes andO(n·polylogn) space (Feigenbaum et al., 2005). Excluding the distribution over multiple machines, these models are indeed very similar to the model of compu-tation allowed in MapReduce. Feldman et al. (2007) explore the relation-ship between streaming and MapReduce algorithms.
Streaming is applicable to a wide class of data-intensive applications in which the data is modeled best as transient data streams rather than persistent relations. Examples of such applications include financial ap-plications, network monitoring, security and sensor networks.
A data stream is a continuous, ordered sequence of items. However, its continuous arrival in multiple, rapid, possibly unpredictable and un-bounded streams raises new interesting challenges (Babcock et al., 2002). Data streams differ from the traditional batch model in several ways: • data elements in the stream arrive online;
• the algorithm has no control over the order of the items; • streams are potentially unbounded in size;
• once an item has been processed it is discarded or archived. This last fact implies that items cannot be retrieved easily unless they are explicitly stored in memory, which is usually small compared to the size of the input data streams.
Processing on streams in performed viacontinuous queries, which are evaluated continuously as streams arrive. The answer to a continu-ous query is produced over time, always reflecting the stream items seen so far. Continuous query answers may be stored and updated as new data arrives, or they may be produced as data streams themselves.
Since data streams are potentially unbounded, the amount of space required to compute an exact answer to a continuous query may also grow without bound. While batch DISC systems are designed to handle massive datasets, such systems are not well suited to data stream appli-cations since they lack support for continuous queries and are typically too slow for real-time response.
The data stream model is most applicable to problems where short response times are important and there are large volumes of data that are being continually produced at a high speed. New data is constantly arriving even as the old data is being processed. The amount of com-putation time per data element must be low, or else the latency of the computation will be too high and the algorithm will not be able to keep pace with the data stream.
It is not always possible to produce exact answers for data stream queries by using a limited amount of memory. However, high-quality approximations are often acceptable in place of exact answers (Manku and Motwani, 2002). Sketches, random sampling and histograms are common tools employed for data summarization. Sliding windows are the standard way to perform joins and other relational operators.
2.3.1
S4
S4 (Simple Scalable Streaming System) is a distributed stream-processing engine inspired by MapReduce (Neumeyer et al., 2010). It is a general-purpose, scalable, open platform built from the ground up to process data streams as they arrive, one event at a time. It allows to easily de-velop applications for processing unbounded streams of data when a single machine cannot possibly cope with the volume of the streams.
Yahoo! developed S4 to solve problems in the context of search ad-vertising with specific use cases in data mining and machine learning. The initial purpose of S4 was to process user feedback in real-time to op-timize ranking algorithms. To accomplish this purpose, search engines build machine learning models that accurately predict how users will click on ads. To improve the accuracy of click prediction the models
in-Processing Element Zookeeper Event Streams Coordination
Events Input Events Output
Business logic goes here Processing Node 1 PE PE PE PE Processing Node 2 PE PE PE PE Processing Node 3 PE PE PE PE Figure 2.3:Overview of S4.
corporate recent search queries, clicks, and timing information as a form of personalization. A production system needs to process thousands of search queries per second from potentially millions of users per day.
The authors initially considered extending Hadoop, but: “Rather than trying to fit a square peg into a round hole we decided to explore a programming paradigm that is simple and can operate on data streams in real-time.”
S4 implements the well known Actor model (Agha, 1986). In an Actor based system, actors are the element of computation and communication is handled exclusively by message passing. Actors share no state, there-fore a system based on the Actor model lends itself to easy parallelization on a cluster of shared nothing machines. The Actor model provides en-capsulation and location transparency, thus allowing applications to be massively concurrent while exposing a simple API to developers.
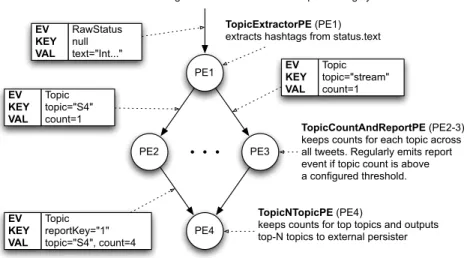
In the context of S4, actors are called Processing Elements (PEs) and they communicate via event streams as shown in Figure 2.3. Much like in MR, events consist of key-value pairs. Keyed data events are routed with affinity to PEs. PEs consume the events and may publish results or emit one or more events which may be consumed by other PEs.
The platform instantiates a PE for each value of the key attribute. When a new key is seen in an event, S4 creates a new instance of the PE associated to that key. Thus, for each PE there will be as many instances