Designing a Network-Based Earthquake Early Warning
Algorithm for California: ElarmS-2
by H. Serdar Kuyuk, Richard M. Allen, Holly Brown, Margaret Hellweg, Ivan Henson,
and Douglas Neuhauser
Abstract
The California Integrated Seismic Network (CISN) is developing an earthquake early warning (EEW) demonstration system for the state of California. Within thisCISNShakeAlert project, three algorithms are being tested, one of which is the network-based Earthquake Alarm Systems (ElarmS)EEWsystem. Over the last three years, the ElarmS algorithms have undergone a large-scale reassessment and have been recoded to solve technological and methodological challenges. The improved algorithms in the new production-grade version of the ElarmS version 2 (referred to as ElarmS-2 or E2) code maximize the current seismic network’s configuration, hardware, and software per-formance capabilities, improving both the speed of the early warning processing and the accuracy of the warnings. E2 is designed as a modular code and consists of a new event monitor module with an improved associator that allows for more rapid association with fewer triggers, while also adding several new alert filter checks that help minimize false alarms. Here, we outline the methodology and summarize the performance of this new online real-time system. The online performance from 2 October 2012 to 15 February 2013 shows, on average, ElarmS currently issues an alert 8:683:73 s after the first P-wave detection for all events across California. This time is reduced by 2 s in regions with dense station instrumentation. Standard deviations of magnitude, origin time are 0.4 magnitude units, 1.2 s, and the median location errors is 3.8 km. E2 successfully detected 26 of 29 earthquakes (MANSS>3:5) across California, while issuing two false alarms. E2is now delivering alerts to ShakeAlert, which in turn distributes warnings to test users.
Introduction
Earthquake early warning (EEW) is the concept of rec-ognizing earthquakes in progress and sending immediate alerts to surrounding population centers, ideally several sec-onds before damaging ground shaking begins (Allen, 2004,
2006,2007;Kuyuk and Allen, 2013a). Both onsite and net-work-based early warning algorithms use data from several seismic stations near the source to rapidly estimate event magnitude, location, and origin time, typically fromP-wave arrivals (Olson and Allen, 2005;Kuyuk and Allen, 2013b). In 2007, the California Integrated Seismic Network (CISN) em-barked on a multiyearEEWproject in California. The project, namedCISNShakeAlert, is implementing, testing, and integrat-ing three distinctEEWalgorithms into a single, end-to-end pro-duction-grade system to provide warnings to test users from industrial, government, and corporate groups, with a view to eventually provide warnings to the general public (Böseet al., 2013). The system uses seismic data from networks across the state (∼400stations), which contribute to theCISN(Fig.1).
ShakeAlert is based on three researchEEWalgorithms: (1) Earthquake Alarm Systems (ElarmS), developed and maintained at the University of California Berkeley (this
article); (2) OnSite, developed and maintained at the California Institute of Technology (Böseet al., 2009); and (3) Virtual Seismologist, developed and maintained at ETH Zurich (Cua et al., 2009). Each of these algorithms has different methods of detecting thePwave, associating triggers with events, estimating magnitude, and filtering out false alarms. ShakeAlert combines information from all three of these algorithms and, through a DecisionModule (DM), it rec-ognizes when the algorithms identify the same event and pro-duces a single summary for each earthquake. This combined event information is sent as a single sequence of updated alert messages across the Internet to registered test users. The three algorithms (including ElarmS) provide source information (location, magnitude, etc.) to the DM. Source information is then passed forward to users who use the UserDisplay (UD) to (automatically) determine the expected shaking inten-sity and time until shaking at their location.
There are a variety of ways early test users of the project can receive and use the alerts. The most common use at this stage is to receive the alerts on computer desktops using the project’sUD software. When the UD receives an alert 162
message that meets the user’s configured criteria (such as magnitude, intensity, and/or likelihood thresholds), a pop-up message appears on the screen warning of impending shaking. The screen displays the estimated shaking intensity at the user’s location and a countdown to the onset of shak-ing. An audible signal also accompanies this information. A summary of the ShakeAlert system is provided inBöseet al. (2013). Test users from the San Francisco Bay Area Rapid Transit (BART) train system have developed a secondary re-sponse layer that also triggers when an observed ground-motion threshold is exceeded. The BARTautomated train control system then decelerates trains when a significant event is detected. This system is currently in place and is the first automated earthquake response of a transit system in the United States.
The original ElarmS code, most recently described in
Brownet al.(2011), has been running in real time since 2007 for the entire state of California (Allen et al., 2009) using data from the CISN seismic networks. Although this algo-rithm has been in place for approximately six years, the alerts were only issued to a small group of testers of the system. The theoretical foundations of the code were first developed byAllen and Kanamori (2003)for southern California and byWurmanet al.(2007)for northern California. The algo-rithm has also been tested offline with datasets of large earth-quakes (4< MJMA<8) in Japan (Brown et al., 2009) and Italy (Olivieriet al., 2008). Since 2009, more than 150 events from the greater San Francisco Bay Area were detected by ElarmS and forwarded to the ShakeAlert DM. Between 2010 and 2011, the research prototype system underwent
Figure1. Map ofCISNseismic stations that contribute to E2 processing. The two alert regions described in the text are shown as the San
Francisco Bay Area (SFBA, northern) and Los Angeles (LA, southern) boxes and are areas with high densities of both population and seismic stations. The Eureka box illustrates the region where we release the requirement that a station must be within 100 km of an epicenter in order to contribute to the magnitude estimate. This is necessary to account for offshore earthquakes in the Mendocino Triple Junction and Gorda plate regions. The color version of this figure is available only in the electronic edition.
a complete rewrite and rebuild. Existing processing elements have been rewritten to become a streamlined production code, and we have developed new algorithms to improve per-formance. In early 2012, the second-generation ElarmS sys-tem replaced the first-generation code as the authoritative version reporting to the ShakeAlert DM. This new version of the algorithm detects and sends alert information for all California earthquakes. In this article, we describe the sig-nificant methodology and code development and the perfor-mance of ElarmS version 2 (referred to as ElarmS-2 or E2) that is now in operation in California.
ElarmS-2 Methodology
The E2 code is designed specifically to maximize the current network, hardware, and software performance capa-bilities by improving both the speed and accuracy of early warning processing. E2 is written in C++, which, compared with the previous scripting language (FORTRAN), improves processing speed and takes advantage of the power of the
networking environment. In addition, the speed of data trans-mission recently has increased. Many of the data loggers at the seismic stations of the CISN’s networks were replaced with funding through the recent American Recovery and Re-investment Act (ARRA). These stations can now send data in 1 s packets to the waveform processing (WP) centers; this is an improvement over the previous system, in which packet transmissions could take several seconds. Since April 2012 (for the UC Berkeley [BK] network) and August 2012 (for the Southern California Seismic Network [CI] network), these data are now processed directly, shaving up to 6 s from alert times.
E2 consists of a newWPmodule and a new event mon-itor (EM) module, plus several new alert filters that check each event just prior to forwarding alerts to the DM. The new modular code design of E2 makes it easy to upgrade individual elements of the algorithm (location, magnitude, etc.) at any time, without disrupting the processing stream (Fig. 2). E2 now also has a replay capability, allowing us to compare results from new algorithms or components with
Figure2. Processing flow for E2. Station waveform feeds are processed at the threeCISNnetwork hubs, UC Berkeley, Caltech, and
Menlo Park.P-wave triggers, amplitudes, frequencies, and other parameters are generated at the three processing centers and forwarded to a single, statewide trigger pool and event monitor running at UC Berkeley. After a quality check of new triggers, association is first attempted with existing events based on the trigger time falling within a defined space–time window. If new triggers cannot be associated with existing events, the associator attempts to create a new event based on the space–time proximity of unassociated triggers. If three or more triggers are close in space and time, a new event is created. New or modified events are then located using the arrival times and a simple grid-search algorithm. Magnitude is then estimated. A split-event filter checks that the triggers from a single event have not been split into two events (i.e., two or more events within a small space–time window), in which case one is deleted and the triggers are returned to the trigger pool. An alert filter continuously checks the event pool to identify any events that pass another set of criteria and can be published to the ShakeAlertDM. Currently, event alerts are only published to test users.
past performance and thereby to optimize configuration changes. The replay capability is key to improving the system, and modules within the E2 algorithms have been updated several times (Table1). The latest version, E2.3.2, has been operational since 22 January 2013.
Waveform Processing
The newWPmodule is currently operating at the three CISN network hubs (UC Berkeley, Caltech, and the U.S. Geological Survey [USGS] at Menlo Park). At each of these locations, WPprocesses individual data streams as they ar-rive from the seismic stations. TheWPhas been redesigned so that it can read and process smaller packets of waveform data, and it can now send the resulting parameters more promptly to theEM, which runs at UC Berkeley (Fig.2).WP processes waveforms in 1 s segments. To allow monitoring of data quality for all stations and channels, the maximum values of displacement, velocity, and acceleration in each second are sent to E2. These ground-motion parameters are bundled together into packets containing up to 50 channels. Event detection is based on a set of trigger parameters. When the short-term-average to long-term-average trigger thresh-old is exceeded, the station information and trigger time are packaged into a trigger packet containing network, sta-tion, channel, location code, station latitude and longitude, and trigger time. This packet is immediately forwarded to
the EM. During the 4 s following theP-wave trigger time, parameters providing information on the frequency content of thePwave (τmax
p ) and on the peak displacement (Pd) and peak velocity (Pv) amplitude are computed every 0.1 s and forwarded to theEM. More information on the determination of these parameters is found in Brownet al. (2011).
An Apache ActiveMQ server running at UC Berkeley handles communication between the WP centers and the EM at Berkeley. The WP clients send compressed binary messages via the Java Message Service API to the ActiveMQ message broker, which provides a publish–subscribe mes-sage environment for E2 and any other mesmes-sage-receiving clients. E2 and all WP programs send heartbeat messages every 5 s to the message broker at UC Berkeley. These messages are logged in a file and received by a monitoring program that provides state-of-health information to clients, such as the CISNShakeAlertUD.
Event Monitor
The second component of E2 is theEM(Fig.2). Its main tasks are to associate P-wave triggers in order to identify earthquakes in progress, characterize the source, and to filter out false events. TheEMconsists of a C++ code designed for efficiency, a revised trigger associator, and a new alert filter, which verifies each event before sending an alert to theDM for release to test users. Additional improvements include Table 1
Modifications to the Various Versions of E2
E2 E2.1 E2.2 E2.3 E2.3.1 E2.3.2
12–26 April 2012 27–30 April 2012 1 May–28 August 2012 28 August–01 October 2012 02 October 2012–22 January 2013 22 January 2013– present
1 s packet BK implementation CI implementation
WP WP2 and heartbeats implemented
Data packets processed immediately (not waiting for integer second) Association Relocation of epicenter in integrated into association algorithm Association of triggers up to 1500 km equation(1) implemented
Trigger pool updated
Magnitude* nCA: MTp,MPd sCA: MPd Network magnitude correction Eureka magnitude box nCA: MPd sCA:MPd Location 2 km grid implemented 5 km approximation combined with 2 km exact grid Rejection if epicenter is on edge of grid Alert Criteria 50% of stations within distance of most distant trigger must have triggered; four station triggers required Linear teleseismic filtering implemented 40% of station must have triggered; still 4 stations required
Break out of association and go to alert if 10 stations have triggered
trigger and event pools. TheEMcan handle multiple events in the event pool at the same time. Currently, there is only oneEMrunning at UC Berkeley, but the modular design al-lows for multipleEMs to be active simultaneously. TheEM operates on data from the entire state, which it receives as trigger and ground-motion information from WP modules at each of the three data centers.
Before association, the quality of each trigger is evalu-ated. For example, the signal-to-noise ratio must be greater than 0.5. Also, two additional criteria must be satisfied: −5:5<logPd<3:5and−0:9<logτmaxp <1, in which
Pd and τmaxp are in centimeters and seconds, respectively. Requiring triggers to fall in this range filters out many noise spikes. TheEMcan declare an event by associating just two triggers, but the trigger criteria are more strict in this case, requiring 0:5<logPd<3 and 0:3<logτmaxp <1. If a trigger from any channel fails to satisfy the criteria, it is sent back to the trigger pool. This iterative process continues until bothPd andτmaxp pass the quality checks.
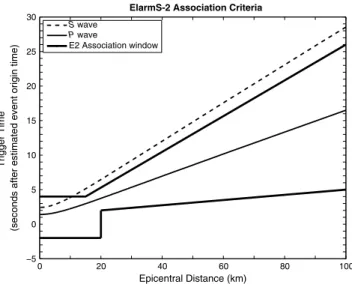
Next, theEM’s associator attempts to link qualified trig-gers with existing events from the event pool. To be associ-ated, the trigger time must fall within a defined time–space window (Fig.3). New triggers are permitted to contribute an event’s location and origin time if they are within 1500 km of the epicenter. This requirement prevents E2 from creating separate (false) events using triggers from stations far from the epicenter and allows the algorithm to better characterize events with long fault ruptures. If a qualified trigger cannot be associated with any of the existing events, the EM at-tempts to create a new event by associating it with other trig-gers from the trigger pool. A new event can only be created if the trigger satisfies the equation
jtnew−tnj<Δd=VP3; 1 in whichjtnew−tnjis the onset time difference between the new trigger and existing triggers in the event,Δdis the dis-tance between stations, andVPis theP-wave velocity. This criterion prevents the association of triggers that are incon-sistent with aPwave traveling between the station of the new trigger and other stations in the event.
The new E2 associator has an additional level of event detection. If a new trigger cannot be associated with an existing event, it is added to the trigger pool, which is a hop-per containing unassociated triggers. When otherwise unoc-cupied, the algorithm scans through the hopper, looking for any set of three or more triggers that can be associated into an event based on the space–time parameters (Fig.3and equa-tion1). This multitrigger event step is critical because it can identify a large portion of California earthquakes in regions of dense station coverage, which typically coincide with re-gions of dense population. In these rere-gions,P-wave triggers can occur at multiple stations in rapid succession. If the algorithm cannot generate a multitrigger event, it scans through the hopper again, looking for any two triggers that are less than 100 km apart and separated by fewer than 16.5 s. Any trigger not associated with an existing event, or used to generate a new event, remains in the trigger pool. A trigger not associated with any other events will be returned to the trigger pool until an expiration time of 30 s is ex-ceeded, at which point the trigger is deemed anomalous and subsequently deleted from the pool.
If an event is created based on two triggers, the locator assigns an epicenter located between them, but one-third closer to the station that was triggered first. If an event is determined from triggers at three or more stations, the locator estimates its position and origin time using a grid-search algorithm. This algorithm assesses points within a
400×400km grid, with grid points every 5 km, located at the centroid of the three stations. Each station is assumed to be located at the nearest grid point, and an approximate epicenter is estimated based on arrival-time residuals. To ob-tain a higher-resolution location, the search is repeated on a
40×40km grid, with 2 km grid-point spacing, based on the approximate epicenter determined from the first cycle itera-tion. As accurate magnitude estimation relies on a good dis-tance correction factor, this location step is important to the E2 system process.
Rapid magnitude estimation is at the heart of ElarmS and is accomplished using empirically derived scaling rela-tionships between magnitude and the frequency (τmax
p ) and/or displacement (Pd) and velocity (Pv) amplitude content of the
Pwaves. An empirical scaling relationship between magni-tude andτmax
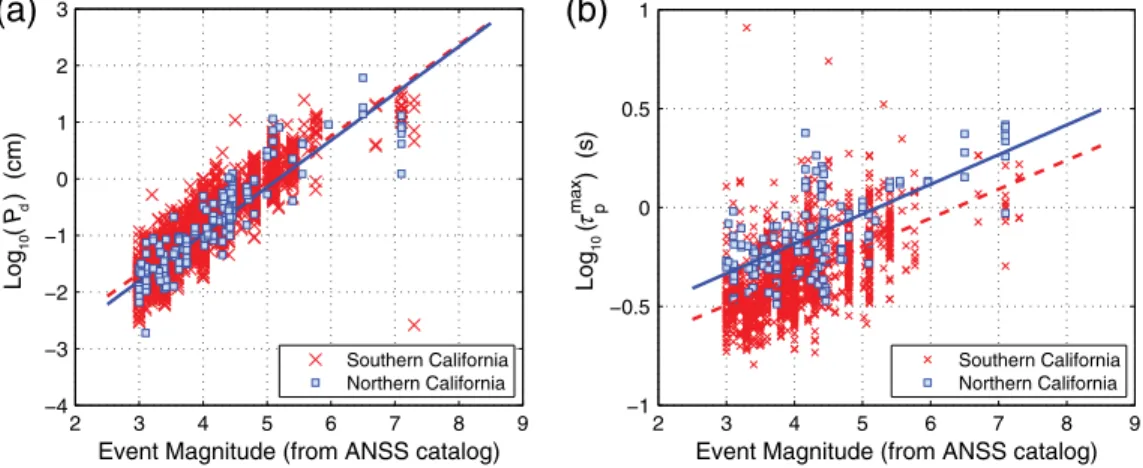
p was first calibrated from a southern California earthquake catalog (Fig.4,Allen and Kanamori, 2003) and then updated byTsanget al.(2007). A second set of scaling relationships, between P-wave amplitude (Pd and Pv) and magnitude, was empirically determined for northern Califor-nia (Wurmanet al., 2007). Prior to late August 2012, E2 used
0 20 40 60 80 100 −5 0 5 10 15 20 25 30 Epicentral Distance (km) Trigger Time
(seconds after estimated event origin time)
ElarmS-2 Association Criteria
S wave
P wave
E2 Association window
Figure 3. Time–space association criteria for E2. Expected
P- and S-wave arrival times are shown as solid and dashed lines, respectively, for 8 km focal depth. If a new trigger falls within the E2 association time and space window (between thick solid lines), relative to an existing event, it is associated with the event, and its parameter information contributes to the event location, origin time, and magnitude.
both thePdandτmaxp relationships for northern California and only the Pd relationship for southern California. However, since September 2012, only the Pd–magnitude relationship is used in both parts of the state, because it provides a more accurate estimate of magnitude with less variation in the ab-solute error. Initially E2 only included triggered stations within 100 km of the epicenter to contribute to magnitude calculations. However, this created a problem determining the magnitude of offshore events, particularly around the Mendocino Triple Junction region, where many earthquakes are more than 100 km offshore. To avoid this problem, we do not enforce the 100 km restriction near the Mendocino Triple Junction in a region we refer to as the Eureka box (Fig.1). The original EM occasionally struggled with split events, in which the system produces two separate but simul-taneous events for a single earthquake. This occurs when a small subset of triggers falls outside the initial association criteria. This can occur, for example, from a poor initial earthquake location. To avoid this problem, we define a blackout window around existing events encompassing time–space windows of 15 s and 90 km. Before the associa-tor generates a new event, it first checks all existing events in the blackout window. If the proposed new event epicenter is a match with an existing event in the blackout window, the associator cancels the new event. All triggers associated with the canceled event are released back into the trigger pool. In offline reruns of past data, this simple procedure has pre-vented the creation of split events in most cases.
In the new E2, the EM has four filters that have been added at the end of processing and before an alert message is sent to theDMfor release. The purpose of these filters is to minimize the publication of false events. First, the event magnitude must be greater than 2, and the estimated epicen-ter should not be on the edge of a location grid-search area. Second, an event must have triggers contributed from at least four stations. Although an event can be generated internally within ElarmS based on triggers from only two stations, we
find the false alarm rate is significantly reduced if we require four stations to be associated before an alert is issued to the DM. We have also developed an artificial neural network-based approach to improve performance when only two or three triggers are available. This method is currently under consideration for inclusion in a future version of E2. The cur-rent E2 requires four station sites to trigger an alert rather than only four vertical channels (many sites have a velocity and acceleration instrument). This may seem like a minor technicality, but the seismic network in California has many stations installations that have more than one sensor, such as collocated accelerometers and broadband seismometers. Given this, the old requirement of triggers from four chan-nels could potentially be satisfied by just two stations, which we have determined are not enough to accurately determine an epicenter.
Our third filter was designed to assure that sufficient sta-tions were triggered near the epicenter prior to issuing an alert message. To accomplish this, the algorithm first counts the number of triggered stations and determines the largest source–station distance (Dmax). Next, a circle of radiusDmax is constructed around the earthquake epicenter, and the num-ber of stations within this circle is counted. The filter checks that at least 40% of these stations issued trigger alerts. If the percentage is below 40%, the event remains in the event pool until the 40% criteria is satisfied.
Our fourth filter discriminates between local and tele-seismic events. This filter was created to avoid false events from large-magnitude teleseisms. The initial P-wave dis-placements of large teleseismic earthquakes generally have displacement amplitudes similar to those of smaller local events. The difference between the two is that waveforms from the local events tend to have shorter-period content (τmax
p ) than the waveforms of the teleseismic events. This type of filter is also used by the Onsite algorithm (Böseet al., 2009). For ElarmS, we have developed a simple linear dis-criminant based on the events’averageτmax
p andPd(Fig.5). 2 3 4 5 6 7 8 9 −4 −3 −2 −1 0 1 2 3
Event Magnitude (from ANSS catalog)
Log 10 ( Pd ) (cm) 2 3 4 5 6 7 8 9 −1 −0.5 0 0.5 1
Event Magnitude (from ANSS catalog)
Log 10 ( p max ) (s) Southern California Northern California Southern California Northern California
(b)
(a)
τFigure4. P-wave parameters scaling relationships. Crosses and squares represent (a) displacement (Pd) and (b)P-wave frequency (τmax
p )
values from the calibration datasets in southern and northern California, respectively (modified fromBrownet al., 2011). Diagonal lines are the resulting magnitude scaling relations used by E2 to estimate event magnitudes. The color version of this figure is available only in the electronic edition.
To separate local and (most) teleseismic events, we use the following discriminant:
FKLIT
F <0 Teleseismic
else Local earthquake; 2 in which K32:75, L−24:75 8:78, and
Ilog τmaxp Pd
.
Applying this filter, our algorithm correctly separates 70 local events from 23 teleseisms and only misidentifies 3 teleseisms in our test dataset.
The alert filter continuously applies the above criteria to events in the event pool. Once an event passes the criteria, it is released as an alert to theDM. After the initial alert, the event information can still be updated when event parameters are refined based on additional data becoming available from stations that have already triggered (within the 4 s window) or based on data from newly triggered stations. These updates are forwarded to theDM.
Defining the optimal alert criteria is one of the biggest challenges inEEWsystems. Criteria which are too strict, such as requiring too many or a large percentage of stations to trigger, may not be met in a timely fashion for moderate-size events. In this case, an alert message is delayed or not sent at
all (i.e., missed event). On the other hand, criteria that are not strict enough can result in an issued alert message when there is no real event (i.e., a false event). Our newly developed replay capability has allowed us to efficiently explore the application of multiple filters and multiple thresholds.
Performance
To test our new E2 system, we use a catalog of Califor-nia earthquakes that occurred between 2 October 2012 and 15 February 2013. All statistics we present are derived from the first alert issued by E2. We choose the first alert, as it is clearly the most important for early warning. However, the first alert, when compared to subsequent alerts, generally has the largest errors in magnitude, location, and origin time (i.e., iterative updates are more accurate than the first alerts). Each earthquake identified by E2 is compared with California earthquakes in the merged catalog of the Advanced National Seismic System (ANSS). E2-generated earthquakes are then categorized as being detected, false, or missed (Table2). An earthquake is deemed detected if its E2 location and origin time match an earthquake in the ANSS catalog to within 100 km distance and within30s. A false alert is one that does not correspond to an earthquake in theANSS catalog within these limits, and a missed event is an earthquake with M≥3:5 listed in the ANSS catalog for which no E2 alert message was issued. E2 may not have detected the event, or it may have detected the event but not satisfied the criteria required to issue an alert. This is not a zero-sum process, as some E2 detections withME2≥3:5may correspond to events
in the ANSS catalog that have MANSS≤3:5 and are thus considered detected.
The performance statistics we present here are for the online real-time E2 system version E2.3.1 and E2.3.2, which have been running in real time since 2 October 2012 (Fig.6). The changes made in E2.3.2 only affect the performance speed, so we are maximizing the time window and number of events by considering performance for both versions. We find that E2 detected 26 of the 29MANSS≥3:5ANSS earth-quakes. We also investigate the performance in the most populated, and the most instrumented regions of the state, the San Francisco Bay Area, and Los Angeles regions and find that all events in these regions were detected and there was only one false event (Table 2, Fig. 6). E2 also successfully detected most earthquakes just outside the CISN networks, −0.7 −0.5 −0.3 −0.1 0.1 0.3 0.5 0.7 −5 −4.5 −4 −3.5 −3 −2.5 −2 −1.5 −1 −0.5 0 Log(τmaxp ) (s) Log( Pd ) (cm) sCA Calibration nCA Calibration Local events Teleseismic events
Figure5. Linear filter to discriminate teleseismic events from
local earthquakes. Triangles are the average τmax
p and Pd for the events of the calibration dataset from the southern California net-work (sCA; inverted triangles) and northern California netnet-work (nCA; upward pointing triangles). Squares are average values from local events recorded by the real-time system. Averageτmax
p andPd
for E2 events caused by teleseismic events are shown as circles. The line is the linear discriminant function that divides most local and teleseismic events. Teleseismic events can havePwaves with dis-placements similar to local events, but they are also longer period. The discriminant is not perfect, as three teleseismic events fall on the wrong side of the line. The color version of this figure is avail-able only in the electronic edition.
Table 2
Number of Detected, Missed, and False Events for E2MANSS≥
3:5California Earthquakes that Occurred between 2 October 2012 and 15 February 2013
California Bay Area Los Angeles
Detected 26 3 1
Missed 3 0 0
False 2 0 0
including offshore of Cape Mendocino in northern California and south of the California–Mexico border. However, these estimates for earthquakes that are at the edge or outside of our network have larger errors than typical detections within the network footprint.
E2 issued five false alert messages, none of which were in the highly populated San Francisco Bay Area and Los Angeles regions (Fig.6, Table2). Instead, these false alerts were caused by events outside of California. One was the
Mw 6.3 earthquake, off the west coast of Baja California on 14 December 2012, which was more than 300 km from the network yet triggered many southern California stations. These triggers were associated into four simultaneous sepa-rate/split events because the offshore event had a poor first-location estimation (false events 1a–d in Fig.6). The other false event was from anMw5.1 earthquake 72 km west of Tonopah, Nevada, on 13 December 2012. The closest station to this Nevada event was 80 km away, resulting in a signifi-cant initial mislocation. The E2 algorithm did adequately lo-cate this earthquake in later iteration; however, later station triggers also generated another event (false alert 2 in Fig.6). While the E2 teleseismic filter prevented alerts from several dozen events created from triggers caused by teleseismic arriv-als, these more regional events did pass the teleseismic filter and thus generated false alerts. We plan to optimize associa-tion criteria to handle these earthquakes in the next version.
Of the California earthquakes, E2 missed three
MANSS≥3:5 events (Fig. 6), all of which occurred at the margins of the CISNnetworks. One was at the California– Mexico (and network) boundary, and two were just south of Lake Tahoe near the California–Nevada border. Our associa-tor works well in regions of dense station and azimuthal cov-erage where interstation spacing is∼20km or less (Kuyuk and Allen, 2013a). For example, we had a 100% success rate identifying local earthquakes in the San Francisco Bay and Los Angeles regions. Performance can, however, be compro-mised by seismicity swarms or aftershock sequences. For ex-ample, a previous E2 version (E2.2) missed 14% of the large earthquakes (M>3:5) in the 2012 Brawley swarm on 26–29 August. There were 21MANSS≥3:5events, and E2.2 reported only 18 of them. The three missed earthquakes occurred within 2 min of a larger event, and the overprinting of the signal from the larger event on the signals of the smaller events made the smaller events undetectable. Overprinting of earthquakes in an aftershock sequence is a well-known problem (Kilb et al., 2007) and was also an issue for the JapaneseEEWsystem dur-ing the 2011 M 9 Tohoku-Oki earthquake aftershock sequence (Hoshiba et al., 2011). We are currently investigating how to improve the associator scheme to recognize and properly account for aftershock and swarm sequences.
The differences betweenANSS and E2 source parame-ters are calculated forMANSS≥3:5andMANSS≥3:0events. We compute errors in earthquake magnitude, origin time, and location by subtracting the E2 results from ANSS results (Fig.7). ForMANSS≥3:0events, we find the median mag-nitude error is −0:050:39, in which the negative −0:05
value indicates that on average E2 slightly overestimates the magnitude by 0.05 magnitude units. For only the larger events (MANSS≥3:5), the errors are0:090:46 (Table3). Errors in origin time and location are both strongly influ-enced by the location algorithm. The origin time errors are not normally distributed; instead, the mean and standard deviations (S.D.) of the origin time errors (in seconds) are −0:291:16for M>3and−0:101:59for M>3:5. The median error in the epicentral location (i.e., distance between true and estimated epicenters) of E2 is 3.78 km. The median location error decreases to 2.01 km for larger events (M>3:5).
System Latency
We define system latency as the time between the origin of an earthquake and the E2 publication of the first alert for the event. This time window includes the time it takes for the
P-wave energy to travel to the first few seismic stations, the delay in packetizing the data, telemetering the data to one of the three WPprocessing hubs, WP processing, sending the parameter data to theEMat UC Berkeley, andEMprocessing up to the point that the alert criteria is satisfied and an alert is published. At each stage the data are passed from one piece of hardware or processing software to another, introducing a delay. 0 100 km 50 1a 1b 1c 1d 2 Stations ANSS Epicenter EEW Epicenter Missed Events False Events Greater Bay Area Box San Francisco Los Angeles LA Box
Figure 6. All detected California events (29), false events
(squares, 2), and missed events (circles, 3) withMANSS≥3:5that occurred between 2 October 2012 and 15 February 2013.ANSS epi-centers (filled stars) and the corresponding E2 epiepi-centers (open stars) are connected with a line. Errors in source parameters are min-imal within regions of high station density and increase in regions offshore and outside of California, such as near Cape Mendocino and south of the California–Mexico border. The two alert regions de-scribed in the text are shown as the San Francisco Bay Area (SFBA, northern) and Los Angeles (LA, southern) boxes and are areas with high densities of both population and seismic stations. The color version of this figure is available only in the electronic edition.
We evaluate four measures of latency: (1) Telemetry latency is the delay in sending waveform data packets from a seismic station to the networkWPprocessing hub. (2) The WP processing delay is the delay in processing the wave-forms by the WP module to generate parameters. (3) The
P-wave latency is the time between theP-wave arrival at a seismic site and the time when that trigger is detected and processed by one of theWPmodules. (4) The alert latency encompasses all components of latency from the origin time of an earthquake to the first published alert from E2.
Telemetry latency is the transit time of data from the station to its network processing hub (e.g., UC Berkeley for BK; USGS Menlo Park for the Northern California Seismic Network [NC] and some for National Strong Motion Program [NP]; Caltech for CI, the Anza Network [AZ], and some NP stations), where theWP module is applied to the
data. This is independent of data packet size, because it is calculated as the time difference between a data packet’s arrival at a WP hub and the time of the last sample in the packet. To evaluate telemetry delay, we collected all packets from all channels/stations and networks from an∼1:5month time window (20 December 2012 to 4 February 2013).
−1 −0.5 0 0.5 1 0 5 10 15 Number of Events −40 −3 −2 −1 0 1 2 3 4 10 20 Number of Events 0 5 10 15 20 25 30 0 10 20 Number of Events M>3 M>3.5 Time Error Magnitude Error Distance Error sec km Median = −0.05 Std = 0.39 Median = −0.29 Std = 1.16 Median = 3.78
Figure7. The magnitude, time, and location errors for E2. The
lighter histograms are errors for all events withMANSS≥3:0, and darker histograms are for events withMANSS≥3:5. For a compari-son of the statistics, see Table5.
Table 3
Magnitude, Origin Time, and Location Error Statistics for E2 Algorithms
MANSS>3:0 MANSS>3:5
Error Median S.D. Median S.D.
Magnitude −0.05 0.39 0.09 0.46
Time −0.29 1.16 −0.10 1.59
Distance 3.78 2.01
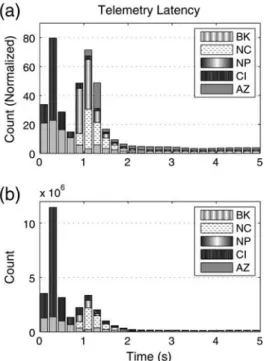
Figure 8. The telemetry latencies by seismic network: UC
Berkeley Digital Seismic Network, (BK),USGSNorthern California Seismic Network (NC), USGS National Strong Motion Program (NP), USGS/Caltech Southern California Seismic Network (CI), and UC San Diego Anza Network (AZ). The telemetry latency is the time it takes for a completed packet to be transmitted from a station to its network processing hub. (a) Theyaxis is normalized so that each network is represented in the histogram by the same area. (b) Histogram displayed with true counts, which correctly rep-resents the average telemetry delay seen by E2. On average, the telemetry latency is 0.44 s (see Table4).
Table 4
Median Telemetry Latencies for the Networks Used by E2 Median (s) S.D. (s) All* 0.46 1.84 BK† 0.44 1.38 NP‡ 1.06 1.80 NC§ 1.36 2.50 CI‖ 0.31 0.96 AZ# 4.57 3.41
Although distribution of latencies is not normal distributed, we list the standard deviations to provide some measure of the variability.
*The top row, labeled‘All,’is a summary of all combined networks.
†UC Berkeley Digital Seismic Network (BK). ‡USGS National Strong Motion Program (NP).
§USGS Northern California Seismic Network (NC).
‖USGS/Caltech Southern California Seismic Network (CI).
Figure8shows the resulting telemetry latencies for each seis-mic network, in which theyaxis is normalized so that each network is represented by the same area in the histogram, allowing comparison of the delays for different networks (Fig. 8a). Comparing actual counts provided by networks, CI provides the most and BK and NP provide about the same amount of information (Fig. 8b). This histogram correctly represents the average telemetry delay of E2. On average, pure telemetry latency is 0.46 s (Table4). The BK network has a median latency of 0.44 s, whereas the NC network has a median of 1.36 s. The CI network has the smallest latency of 0.31 s, and the AZ network has the longest latency of 4.57 s because the AZ transmission is not direct to theWPhub at Caltech, but requires a two-leg transmission.
We also investigated both theWPqueue time (the inter-val a waveform packet waits at a processing center before being processed) and theWPtime (the time needed forWP to process a waveform packet). These two times are deter-mined from the difference between the time a packet is sent to theEMmodule and the time the packet is received at the WPhub from the station. Both these times have median val-ues that are less than 0.001 s. Thus, they are negligible when compared to other delays in the E2 system.
Next, we consider theP-wave latency (Fig. 9), which combines a series of delays. It includes the data packetization by data loggers at the stations. A data logger will not send its data to the data center whereWP takes place until the data packet is full. In the past, data loggers at the BK, CI, and AZ network stations (which provide the bulk of the data for the E2 system) forwarded data in packets holding 4–6 s of data, delaying processing of the earliest data in the packet by that amount. Thanks to recent hardware upgrades (supported by
funding from the ARRA), most of these data loggers have been replaced with more modern units that send data in 1 s packets. TheP-wave latency also includes the telemetry latencies and theWP processing latencies described above. To evaluateP-wave latency (Fig.9and Table5), we col-lected all triggers from all channels/stations and networks from 20 December 2012 to 4 February 2013 for about one and a half months. The medianP-wave latency for all data (and thus for all networks) is 1:142:72s. There is a significant tail to the distribution that extends out to several hundred seconds for a very small percentage of the data. The tail indicates that data from some stations are drastically de-layed, due to poor telemetry, temporary telemetry failure, or some other station disruption.
Before theARRAupgrade of data loggers at 22 of the BK stations and the implementation of processing code to take advantage of the upgrades, the medianP-wave latency was 3.83 s. Currently, with the upgrades and new system, the latency has been reduced by about 3 s to0:880:37s. The equipment operated by the CI network was also upgraded in August 2012, and the median latency for CI is now
1:031:82s. Latencies for the NC network follow a more Gaussian-shaped distribution, with a larger median latency of 6:203:28s. The median latency for NP stations is
1:933:77s. In the NP network, there are a significant number of stations with large latencies resulting in a larger standard deviation. AZ has the highest median latency, 6.80 s, because there is an extra telemetry step in which the data are forwarded from the Scripps Institute of Oceanogra-phy to the regional processing center at Caltech.
Finally, we investigate how many seconds the entire E2 system requires, on average, to publish an alert for an event (Fig.10a). This alert latency is determined for the E2 dataset and represents the entire delay, including the time for theP
wave to propagate to the stations, for data packets to be filled, for the telemetry to the hubs, for WP processing, telemetry of parameters toEMat UC Berkeley, and forEM processing. We calculate alert latencies for the 469 events that E2 detected between 2 October 2012 and 15 February 2013, including small earthquakes. We find that, on average, E2 needs12:375:21s to issue an alert to users. The tail in the alert time histogram is mainly caused by events offshore of Cape Mendocino and events located in poorly instru-mented areas, such as the north and northeastern regions of
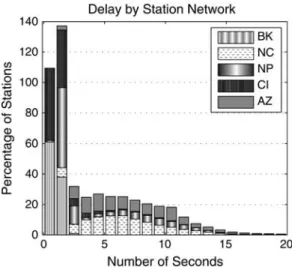
Figure9. P-wave latencies by seismic network. This is the time
that aWPmodule detects aPwave minus the arrival time of theP
wave at the seismic station. It includes data packetization, transmis-sion to the network hub, andWPprocessing. Data latencies are nor-malized for each network so that each network is represented by the same area in the histogram, allowing comparison of the delays for different networks. On average P-wave latency is 1.14 s (see Table5).
Table 5
MedianP-Wave Latency by Network
Median (s) S.D. (s) All 1.14 2.72 BK 0.88 0.37 NC 6.20 3.28 NP 1.93 3.77 CI 1.03 1.82 AZ 6.80 3.86
California. We also find that alerts for offshore events and those that occur south of the California–Mexico border typ-ically take more than 20 s, whereas alerts for events in the San Francisco Bay and Los Angeles regions take less time, averaging11:363:55and9:885:54s, respectively. The remaining California onshore events typically have alert times of12:844:88s (Table6).
We also determine both the time for thePwave to reach the first seismic station and the time from the firstP-wave trigger to the alert for the same set of events. From the first
P-wave trigger time, we subtract theANSSorigin time to de-termine how long it takes for a network station to first receive information about the earthquake. This duration has a median of3:233:75s (Fig.10b). For events in regions of sparse network coverage, it takes more than 10 s for theP
wave to arrive at the first station. In more densely instrumented regions, such as the San Francisco Bay and Los Angeles areas, this time is about 2–3 s. The E2 processing latency, which is the alert time minus the time of the firstP-wave arrival at the closest stations, has a median time of8:683:73s (Fig.10c
and Table6). Currently E2 processing latency is the smallest in the Los Angeles area, with a median of 6:723:96s,
which is almost 2 s faster than the latency in the San Francisco Bay Area. This is due to the additional delays from NC stations, which comprise a large fraction of the stations in northern California.
Conclusions
We are now operating a completely new version of the ElarmS algorithms on theCISNreal-time systems in Califor-nia. E2 was rewritten and rebuilt from what was a research prototype algorithm to production-quality code for faster operation and easier maintenance and modification. At the same time, improvements to the algorithms were developed and implemented. The new code maximizes the current network, hardware, and software performance capabilities by improving both the speed and accuracy of early warning processing. E2 is designed as a modular code and consists of a newWPmodule that provides data more rapidly to theEM. The newEMmodule has a significantly improved associator that allows for more rapid association with fewer triggers, while also adding several new alert filters that check each event prior to release, which in turn minimizes false alarms. E2 detects and generates alert information for earth-quakes throughout California. E2 detected 26 of 29
MANSS>3:5events in California, missing three events and issuing two false alerts during the real-time testing period (October 2012 to February 2013). None of the three missed events were in the San Francisco Bay or Los Angeles re-gions, but were instead in more remote parts of California where seismic station density is low. The two false alerts re-sulted from large regional earthquakes outside of the foot-print of our network, and large teleseismic earthquakes generated no false alerts. Standard deviations of magnitude, origin time, and median location errors are 0.39 magnitude units, 1.16 s, and 3.78 km, respectively. E2 currently issues an alert on average8:683:73s after the firstP-wave de-tection for all events across California. We continue to review E2’s performance to reduce the delays still further.
Figure10. E2 latencies for earthquakes detected in real time from 2 October 2012 to 15 February 2013. (a) The E2 alert latency is the
difference between the time an alert is first published and the origin time for the earthquake in the ANSS catalog. The median is
12:375:21s. (b) The time it takes the firstP-wave arrival to travel to the first station is derived by subtractingANSSorigin time from the trigger time at the first station. The median is3:233:75s. (c) The E2 processing latency, which is alert time minus the time of the first
P-wave arrival at a seismic station shows total time the network and E2 require to alert on an event. The median is8:683:73s. Alerts are faster for the San Francisco Bay and Los Angeles areas (see Table6).
Table 6
E2 Latencies, Measured from Real-Time E2 Performance from October 2012 to February 2013
Alert—ANSS Origin Time Median±S.D. (s) First Station Trig—ANSS Origin Time Median±S.D. (s) Alert—First Station Trig Median ±S.D. (s) Others 12:844:88 3:303:07 8:903:81 Offshore 22:597:44 12:077:36 11:404:46 Los Angeles 9:885:54 3:263:16 6:723:96 Bay Area 11:363:55 2:663:26 8:622:81 All 12:375:21 3:233:75 8:683:73
Latencies are shown for various regions (LA and SFBA boxes in Fig. 1). Latencies are smaller in the San Francisco Bay Area and Los Angeles due to dense station coverage.
Data and Resources
In order to evaluate the E2 performance, we used Cal-ifornia earthquakes in the merged catalog of the ANSS (http://www.ncedc.org/anss/; last accessed March 2013) for earthquakes from 2 October 2012 to 15 February 2013. Our analysis uses standardized E2 output provided to the Shake-Alert project, and these are the same output data provided to theEEW DM. The analysis programming codes were written in MATLAB (http://www.mathworks.com/; last accessed June 2013).
Acknowledgments
This project was only possible because of the collaborative efforts of many people working at the CISN operating institutions: UC Berkeley, Caltech,USGSMenlo Park, andUSGSPasadena. This work is funded by
USGS/National Earthquake Hazards Reduction Program Awards G09AC00259 and G12AC20348 and by the Gordon and Betty Moore Foun-dation through Grant GBMF3024 to UC Berkeley. Figure1was produced using Generic Mapping Tools byWessel and Smith (1995).
References
Allen, R. M. (2004). Rapid magnitude determination for earthquake early warning, inThe Many Facets of Seismic Risk, G. Manfredi (Editor), University of DegliStudi di Napoli“Federico II”, Naples, Italy, 15–24. Allen, R. M. (2006). Probabilistic warning times for earthquake ground shaking in the San Francisco Bay Area, Seismol. Res. Lett. 77, no. 3, 371–376.
Allen, R. M. (2007). The ElarmS earthquake early warning methodology and application across California, in Earthquake Early Warning, P. Gasparini (Editor), Springer, Milan, Italy, 21–44.
Allen, R. M., and H. Kanamori (2003). The potential for earthquake early warning in southern California,Science300,786–789.
Allen, R. M., H. Brown, M. Hellweg, O. Khainovski, P. Lombard, and D. Neuhauser (2009). Real-time earthquake detection and hazard assessment by ElarmS across California, Geophys. Res. Lett. 36, L00B08, doi:10.1029/2008GL036766.
Böse, M., R. Allen, H. Brown, G. Cua, M. Fischer, E. Hauksson, T. Heaton, M. Hellweg, M. Liukis, D. Neuhauser, P. Maechling, and CISN EEW Group (2013). CISN ShakeAlert: An earthquake early warning dem-onstration system for California, inEarly Warning for Geological Disasters—Scientific Methods and Current Practice, F. Wenzel and J. Zschau (Editors), Springer, Berlin, Germany, ISBN: 978-3-642-12232-3.
Böse, M., E. Hauksson, K. Solanki, H. Kanamori, Y.-M. Wu, and T. H. Hea-ton (2009). A new trigger criterion for improved real-time performance
of on-site earthquake early warning in southern California,Bull. Seis-mol. Soc. Am.99,no. 2A, 897–905, doi:10.1785/0120080034. Brown, H. M., R. M. Allen, and V. F. Grasso (2009). Testing ElarmS in
Japan,Seismol. Res. Lett.80,727–739.
Brown, H. M., R. M. Allen, M. Hellweg, O. Khainovski, D. Neuhauser, and A. Souf (2011). Development of the ElarmS methodology for earth-quake early warning: Realtime application in California and offline testing in Japan,Soil Dynam. Earthq. Eng.31,188–200, doi:10.1016/ j.soildyn.2010.03.008.
Cua, G., M. Fischer, T. Heaton, and S. Wiemer (2009). Real-time perfor-mance of the virtual seismologist earthquake early warning algorithm in southern California,Seismol. Res. Lett.80,no. 5, 740–747. Hoshiba, H., K. Iwakiri, N. Hayashimoto, T. Shimoyama, K. Hirano, Y.
Yamada, Y. Ishigaki, and H. Kikuta (2011). Outline of the 2011 Off the Pacific Coast of Tohoku earthquake (Mw9.0)—Earthquake
early warning and observed seismic intensity,Earth Planet. Space
63,547–551.
Kilb, D., V. G. Martynov, and F. L. Vernon (2007). Aftershock detection thresholds as a function of time: Results from the ANZA seismic net-work following the 31 October 2001ML5.1 ANZA, California,
earth-quake,Bull. Seismol. Soc. Am.97,780–792.
Kuyuk, H. S., and R. M. Allen (2013a). Optimal seismic network density for earthquake early warning: A case study from California,Seismol. Res. Lett.84,no. 6, 946–954.
Kuyuk, H. S., and R. M. Allen (2013b). A global approach to provide magnitude estimates for warthquake early warning alerts,Geophys. Res. Lett.40,doi:10.1002/2013GL058580.
Olivieri, M., R. M. Allen, and G. Wurman (2008). The potential for earth-quake early earning in Italy using ElarmS,Bull. Seismol. Soc. Am.98, 495–503, doi:10.1785/0120070054.
Olson, E. L., and R. M. Allen (2005). The deterministic nature of earthquake rupture,Nature438,no. 7065, 212–215.
Tsang, L., R. M. Allen, and G. Wurman (2007). Magnitude scaling relations fromPwaves in southern California,Geophys. Res. Lett.34,L19304, doi:10.1029/2007GL031077.
Wessel, P., and W. H. F. Smith (1995). New version of the Generic Mapping Tools released,Eos Trans. AGU76,329.
Wurman, G., R. M. Allen, and P. Lombard (2007). Toward earthquake early warning in northern California,J. Geophys. Res.112,no. B08311, doi:
10.1029/2006JB004830.
Seismological Laboratory University of California McCone Hall, UC Berkeley Berkeley, California 94720 [email protected]
Manuscript received 5 June 2013; Published Online 24 December 2013